















Notice the structure
Detections mark where a defined shape formed, not where price goes next. The match score measures fit to that definition.1
Stocks · Forex · Crypto · One workspace
Charts that detect patterns as you work, strategies you build visually, tests against history and a journal for every decision, with an AI agent you can put to work across all of it. Start with the tools you know. Go further when you’re ready.
Intelligent charts Agentic workflow Visual strategies
Analess is in an early phase. The features on this page are under development and will arrive in stages. See the roadmap for planned release timing. Screenshots use illustrative data, and final product features may vary.
Intelligent charting
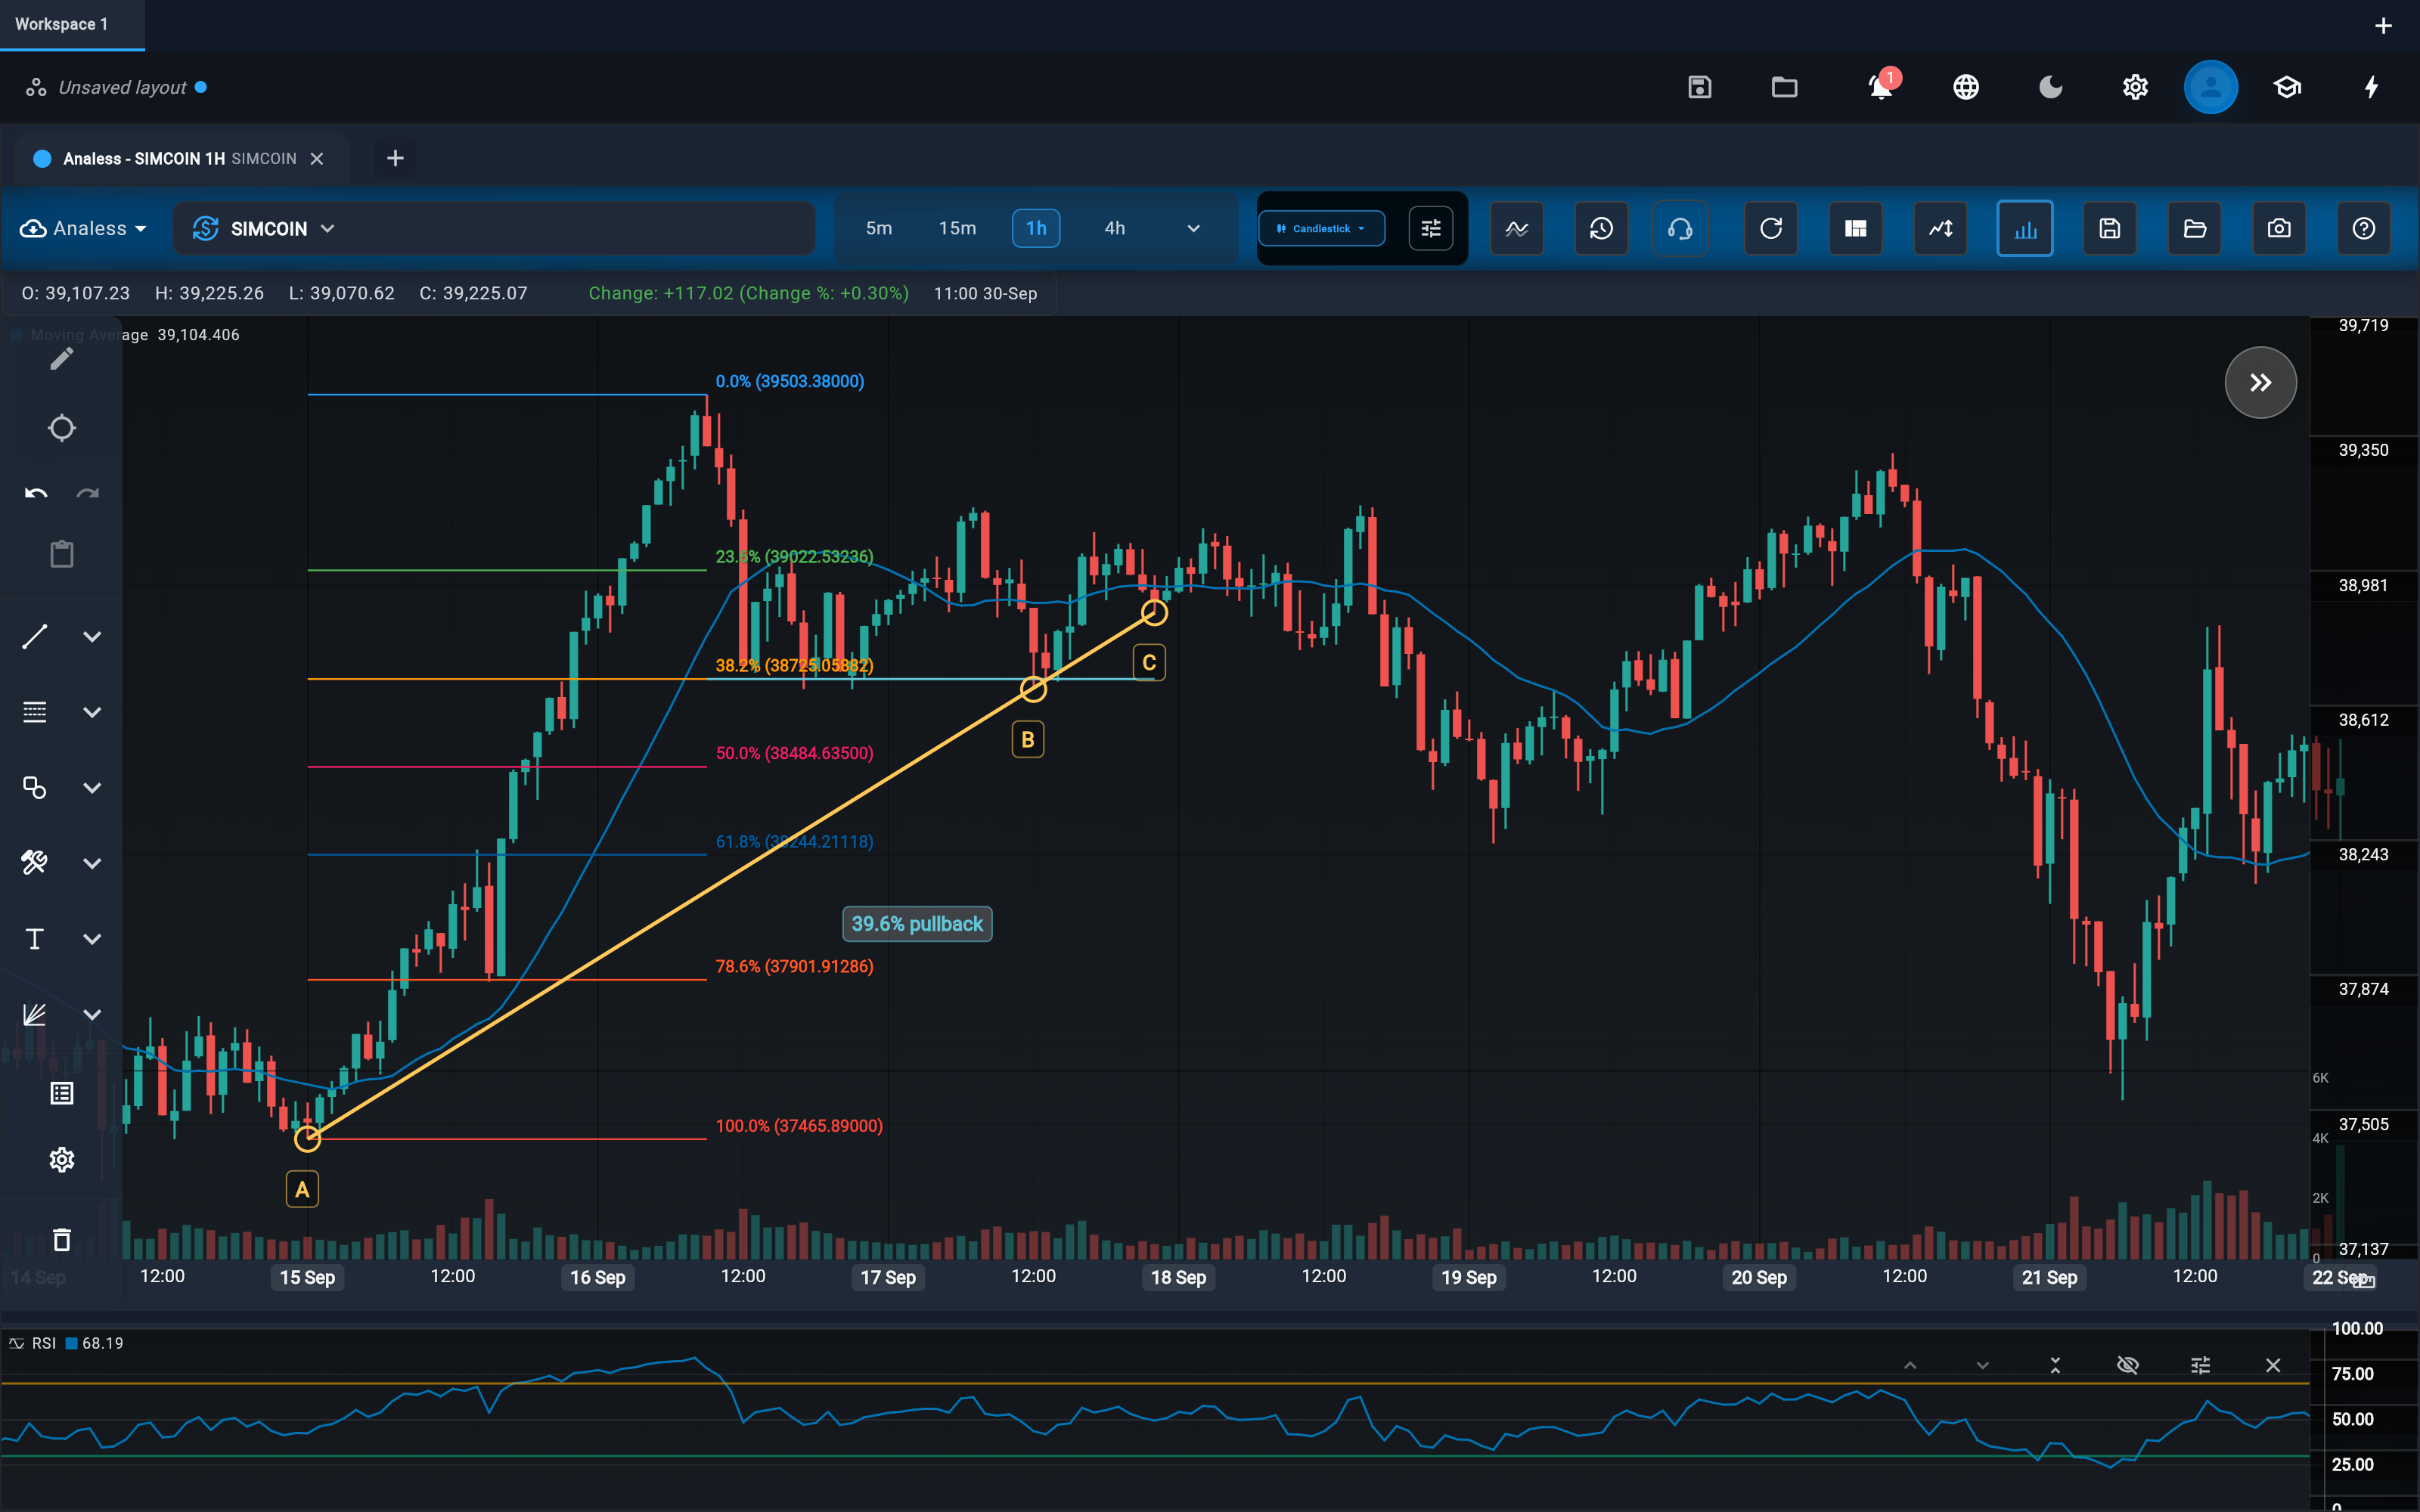
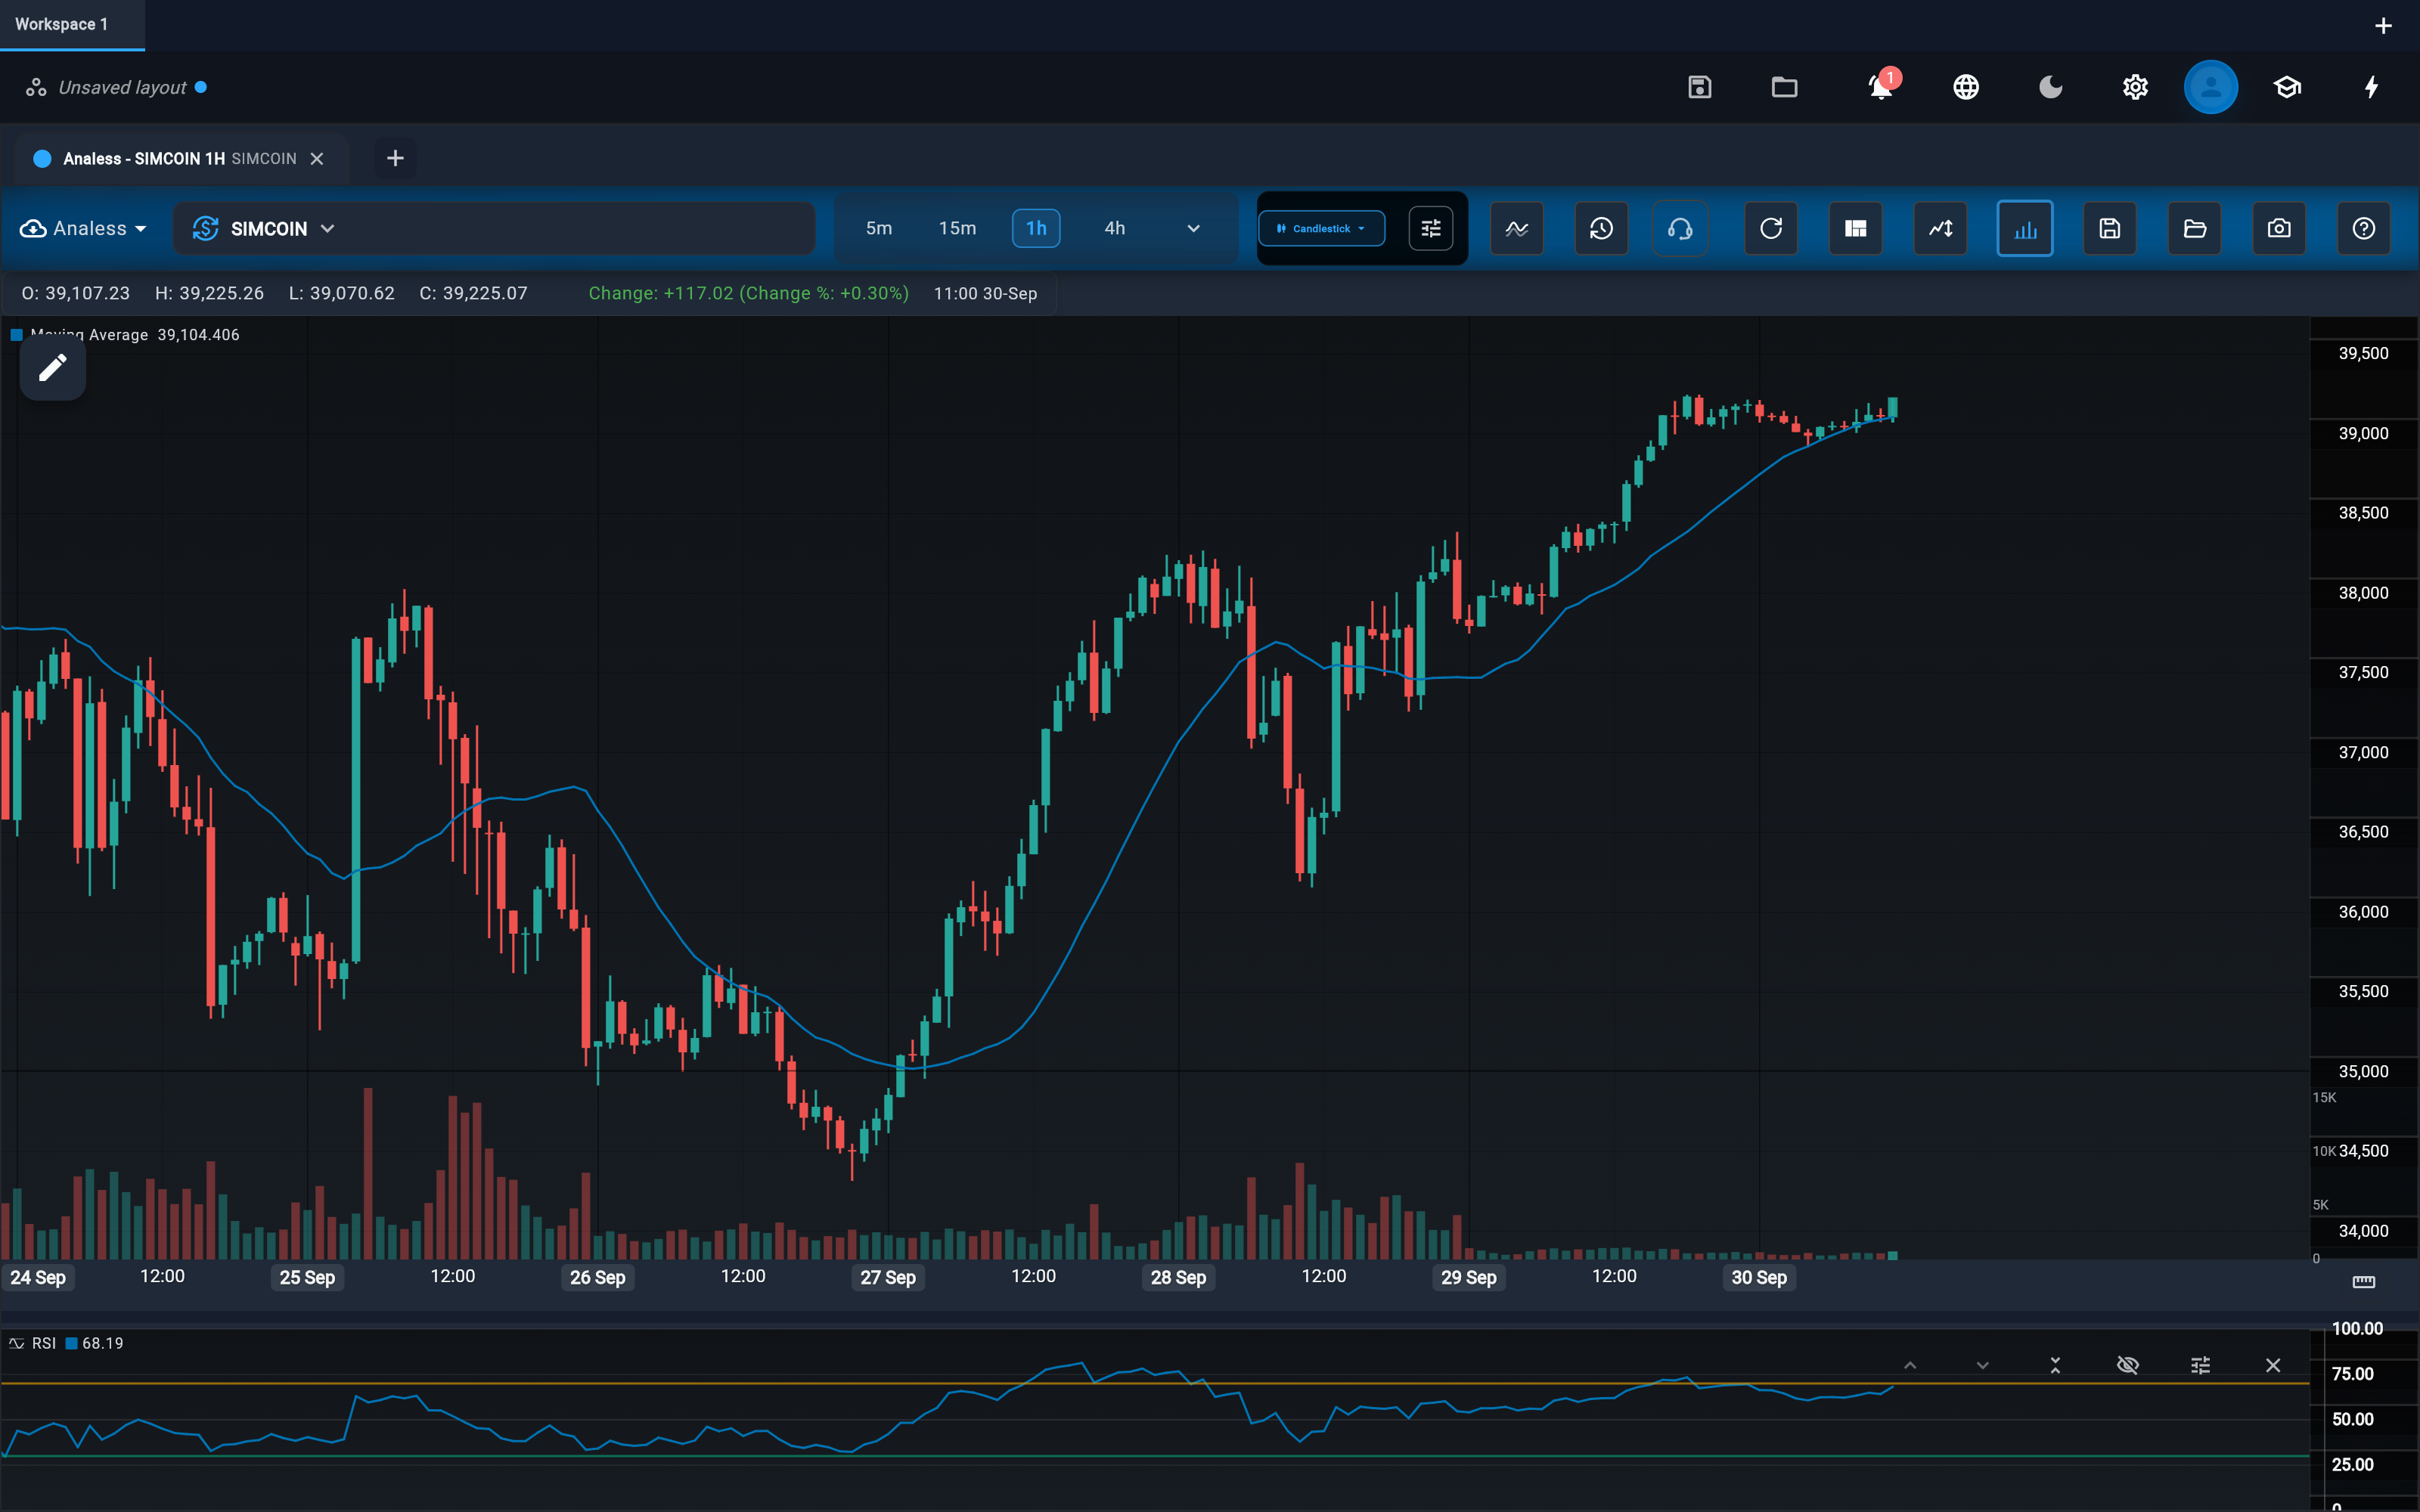
The chart is full of intelligent features that work alongside you. They help you recognise patterns, spot indicator information and clearly read price action, making the bigger picture clearer.
Detections mark where a defined shape formed, not where price goes next. The match score measures fit to that definition.1
Add an indicator, draw a reference line and choose the timeframe that answers your question.
Pattern recognition finds defined shapes on your chart, and auto-annotation draws the structure for you as marks you can edit.
Get a clear understanding of what’s behind what you see on the chart. Follow any mark back to the calculation that made it. Explore chart assistance
Visual strategies
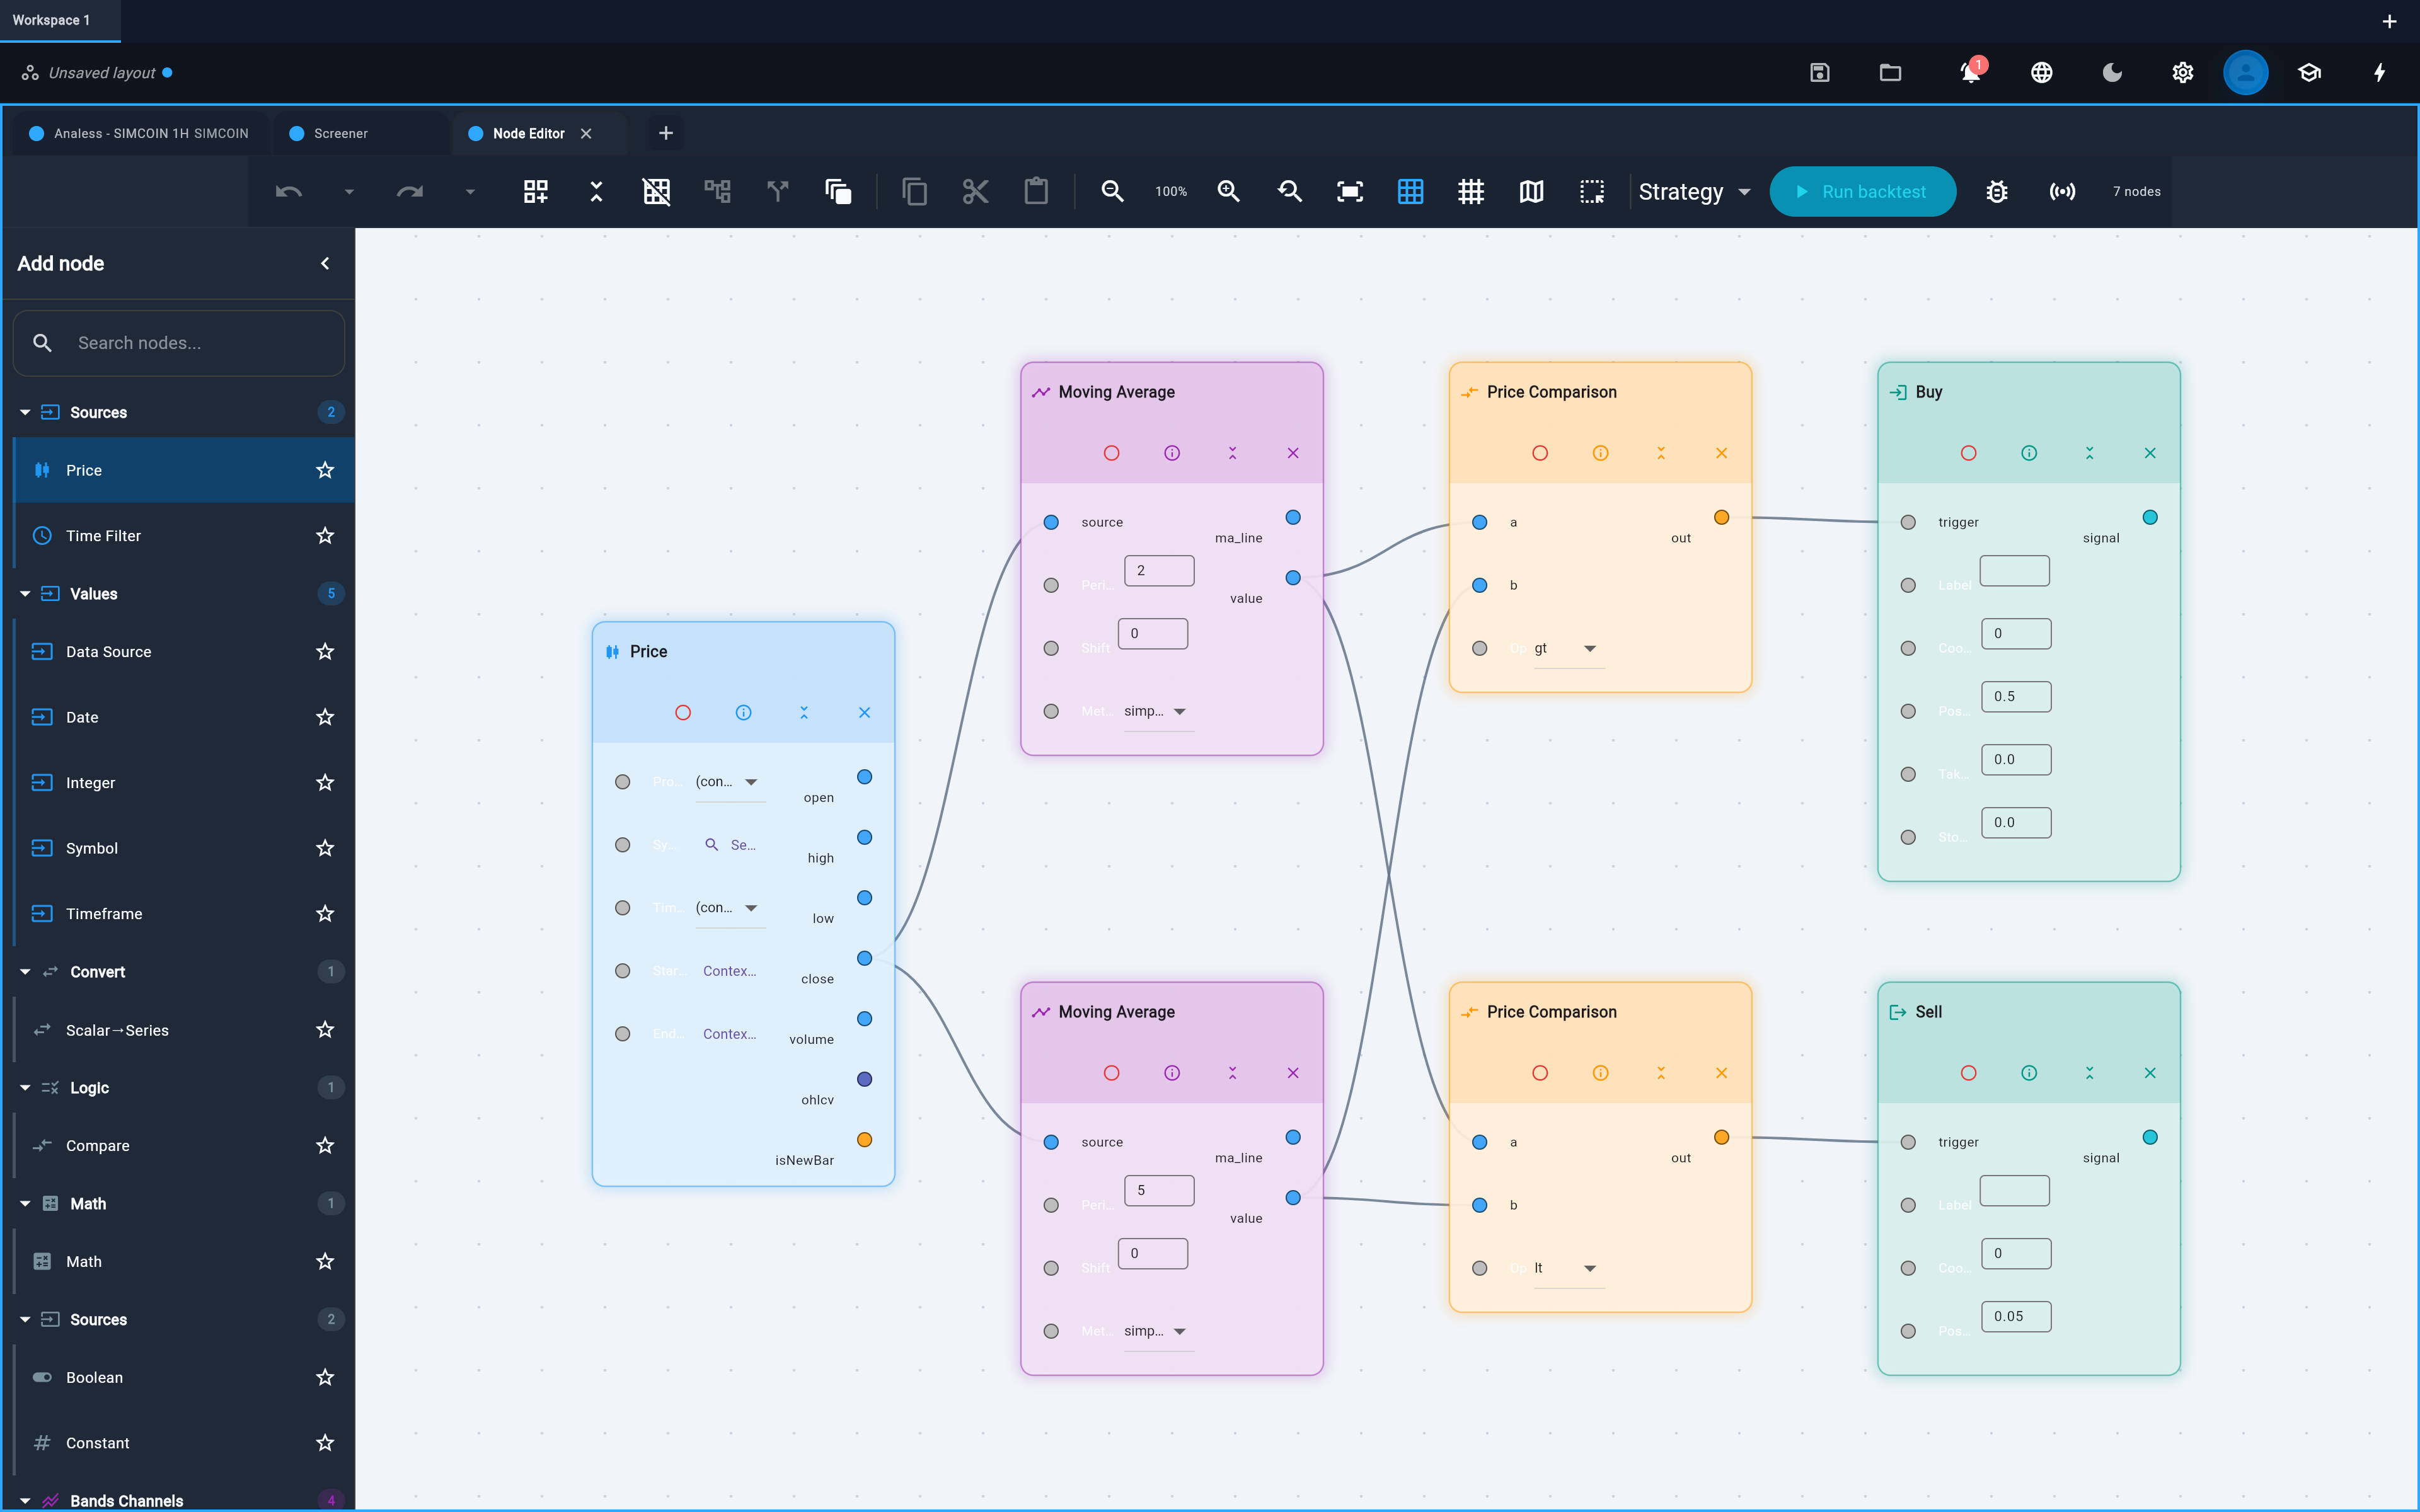
Drag in price, indicators and conditions, connect them, and you have a strategy, with no code required. Then replay it bar by bar and see exactly which path fired and what value moved along each wire.
Wiring a node into a strategy graph.
Pick nodes from the palette and connect their ports. When enabled, create custom nodes of your own to sit beside the built-in ones. The graph is the strategy.
Open a debug replay to step forward and back through history. The active path lights up, breakpoints stop on the bar you choose, and hovering a wire shows the value passing through it.
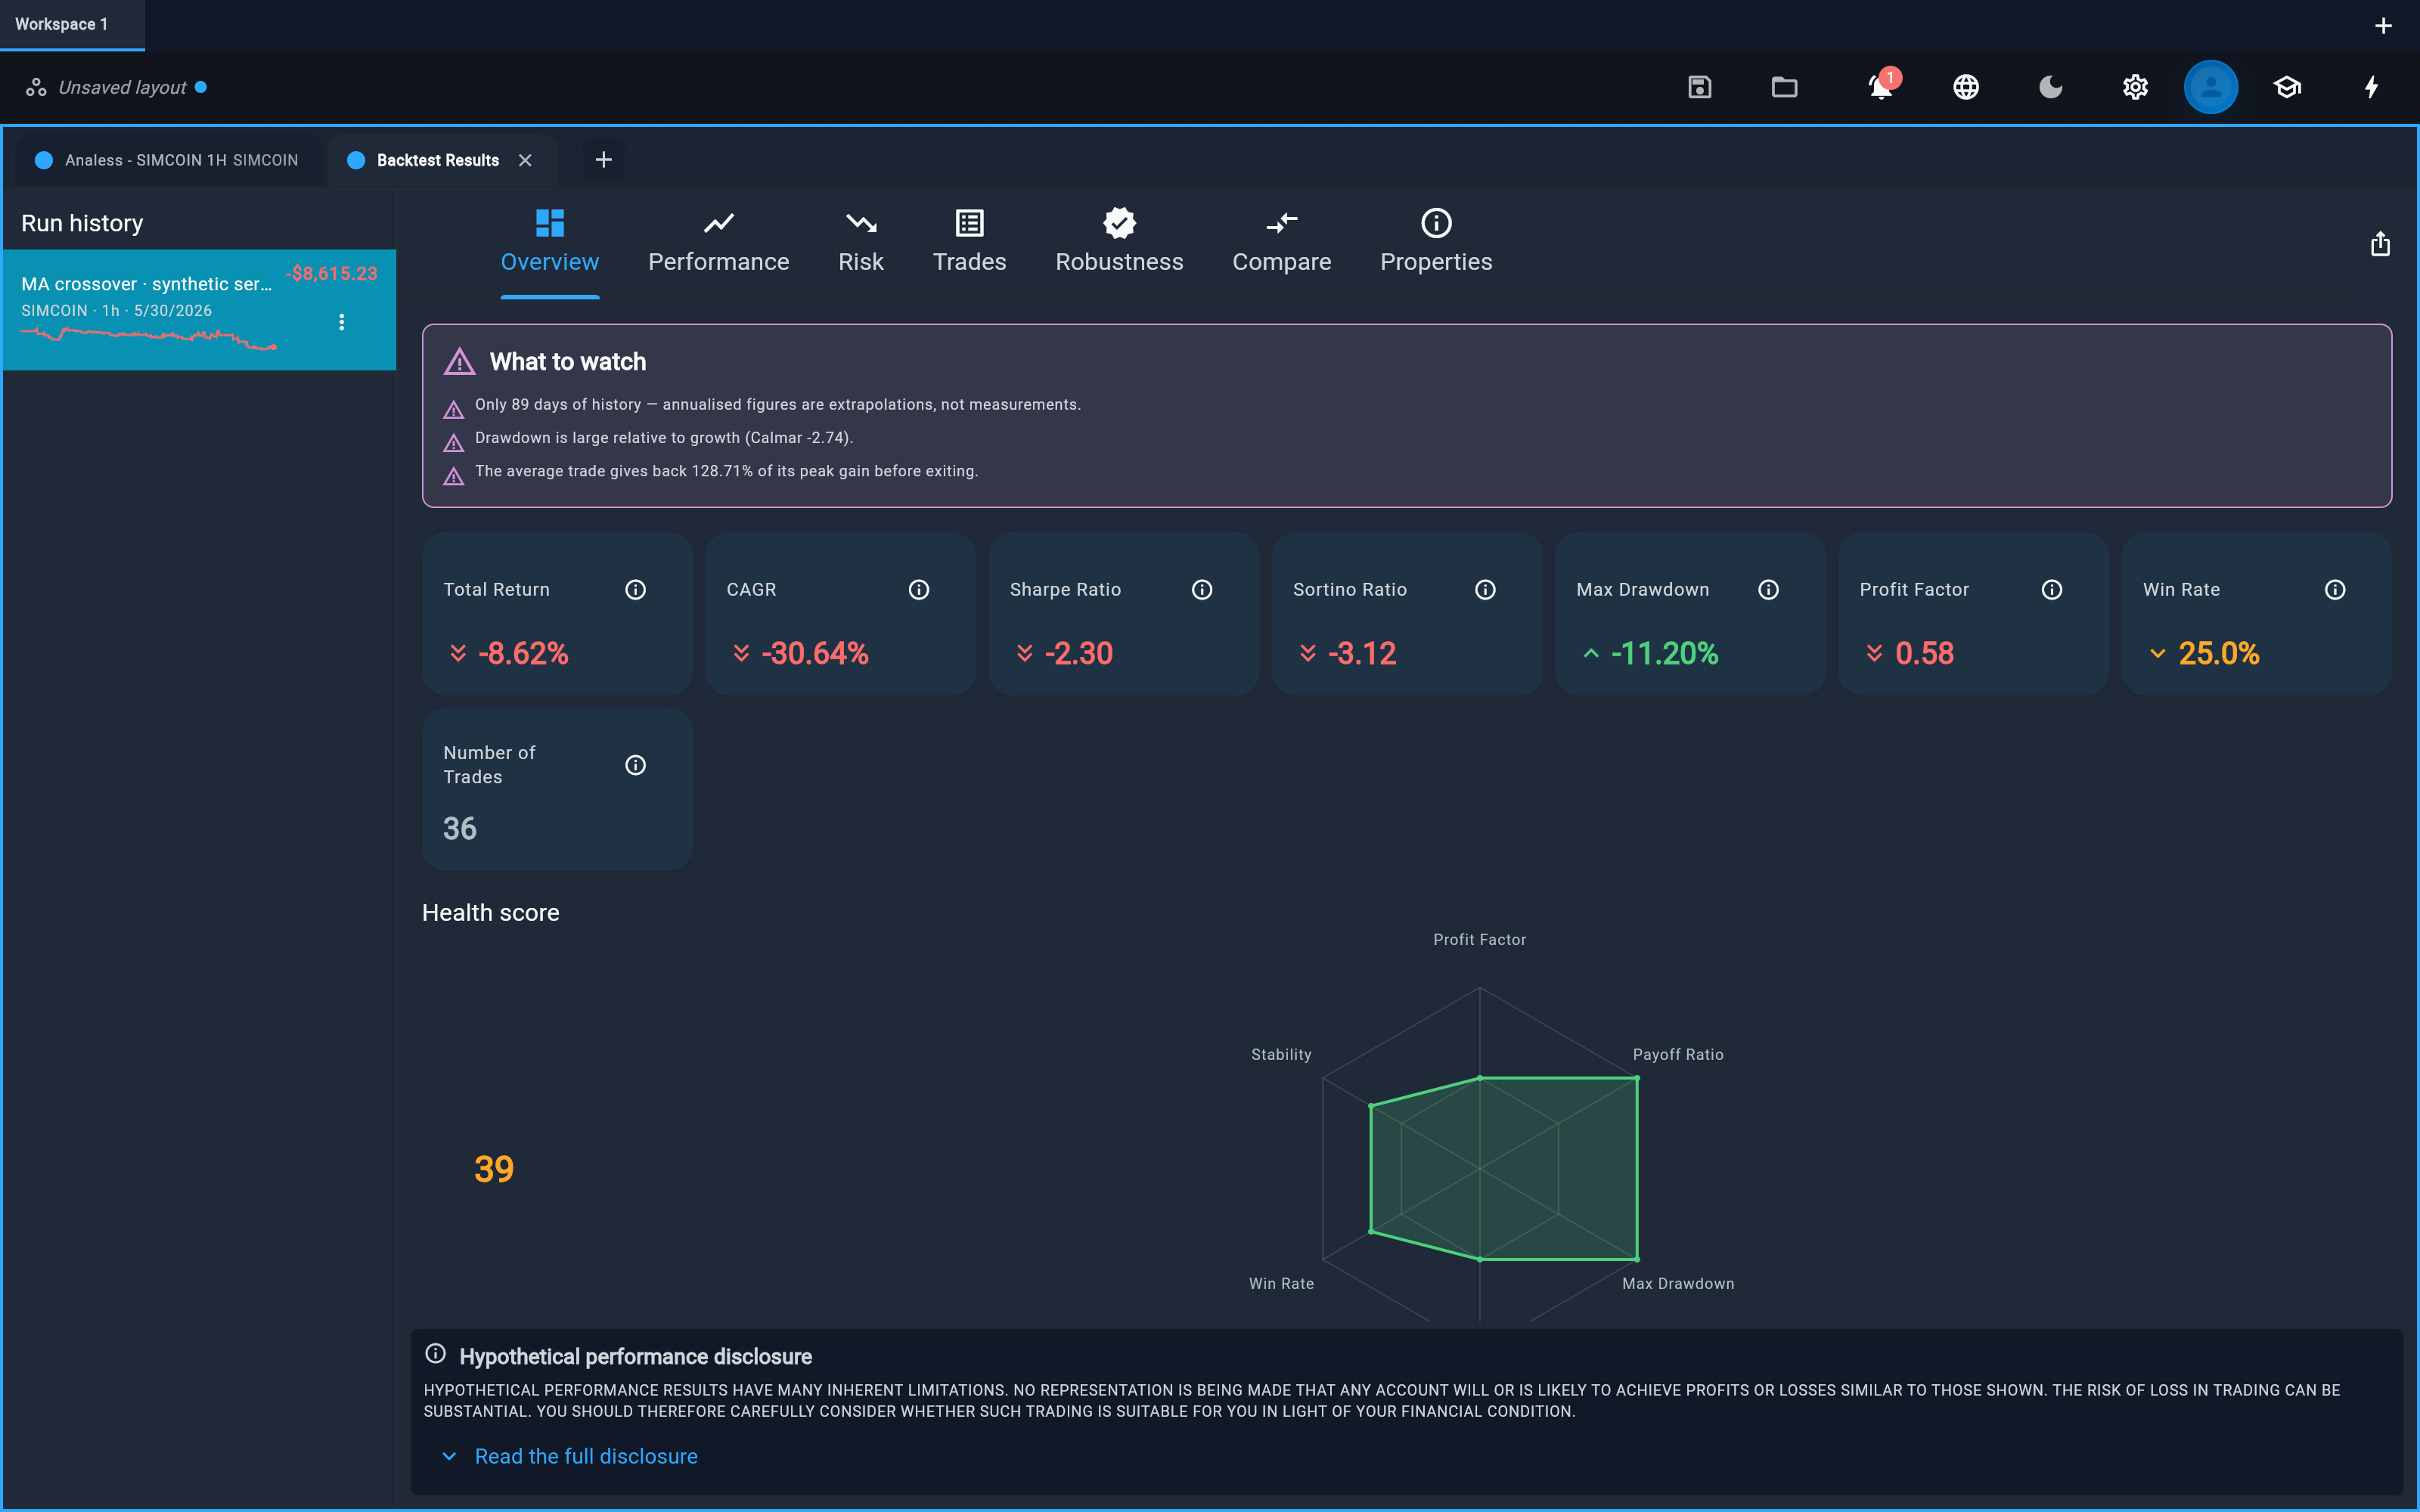
Run a hypothetical backtest of the graph as a strategy, draw it as an indicator on your chart, or use it to screen markets. One graph, wherever you need it.2
Code when you want it
A full code editor backs the visual builder. Take an idea further in JavaScript or Python, the languages you already know, with autocomplete, an AI coding assistant and a console in the same workspace.
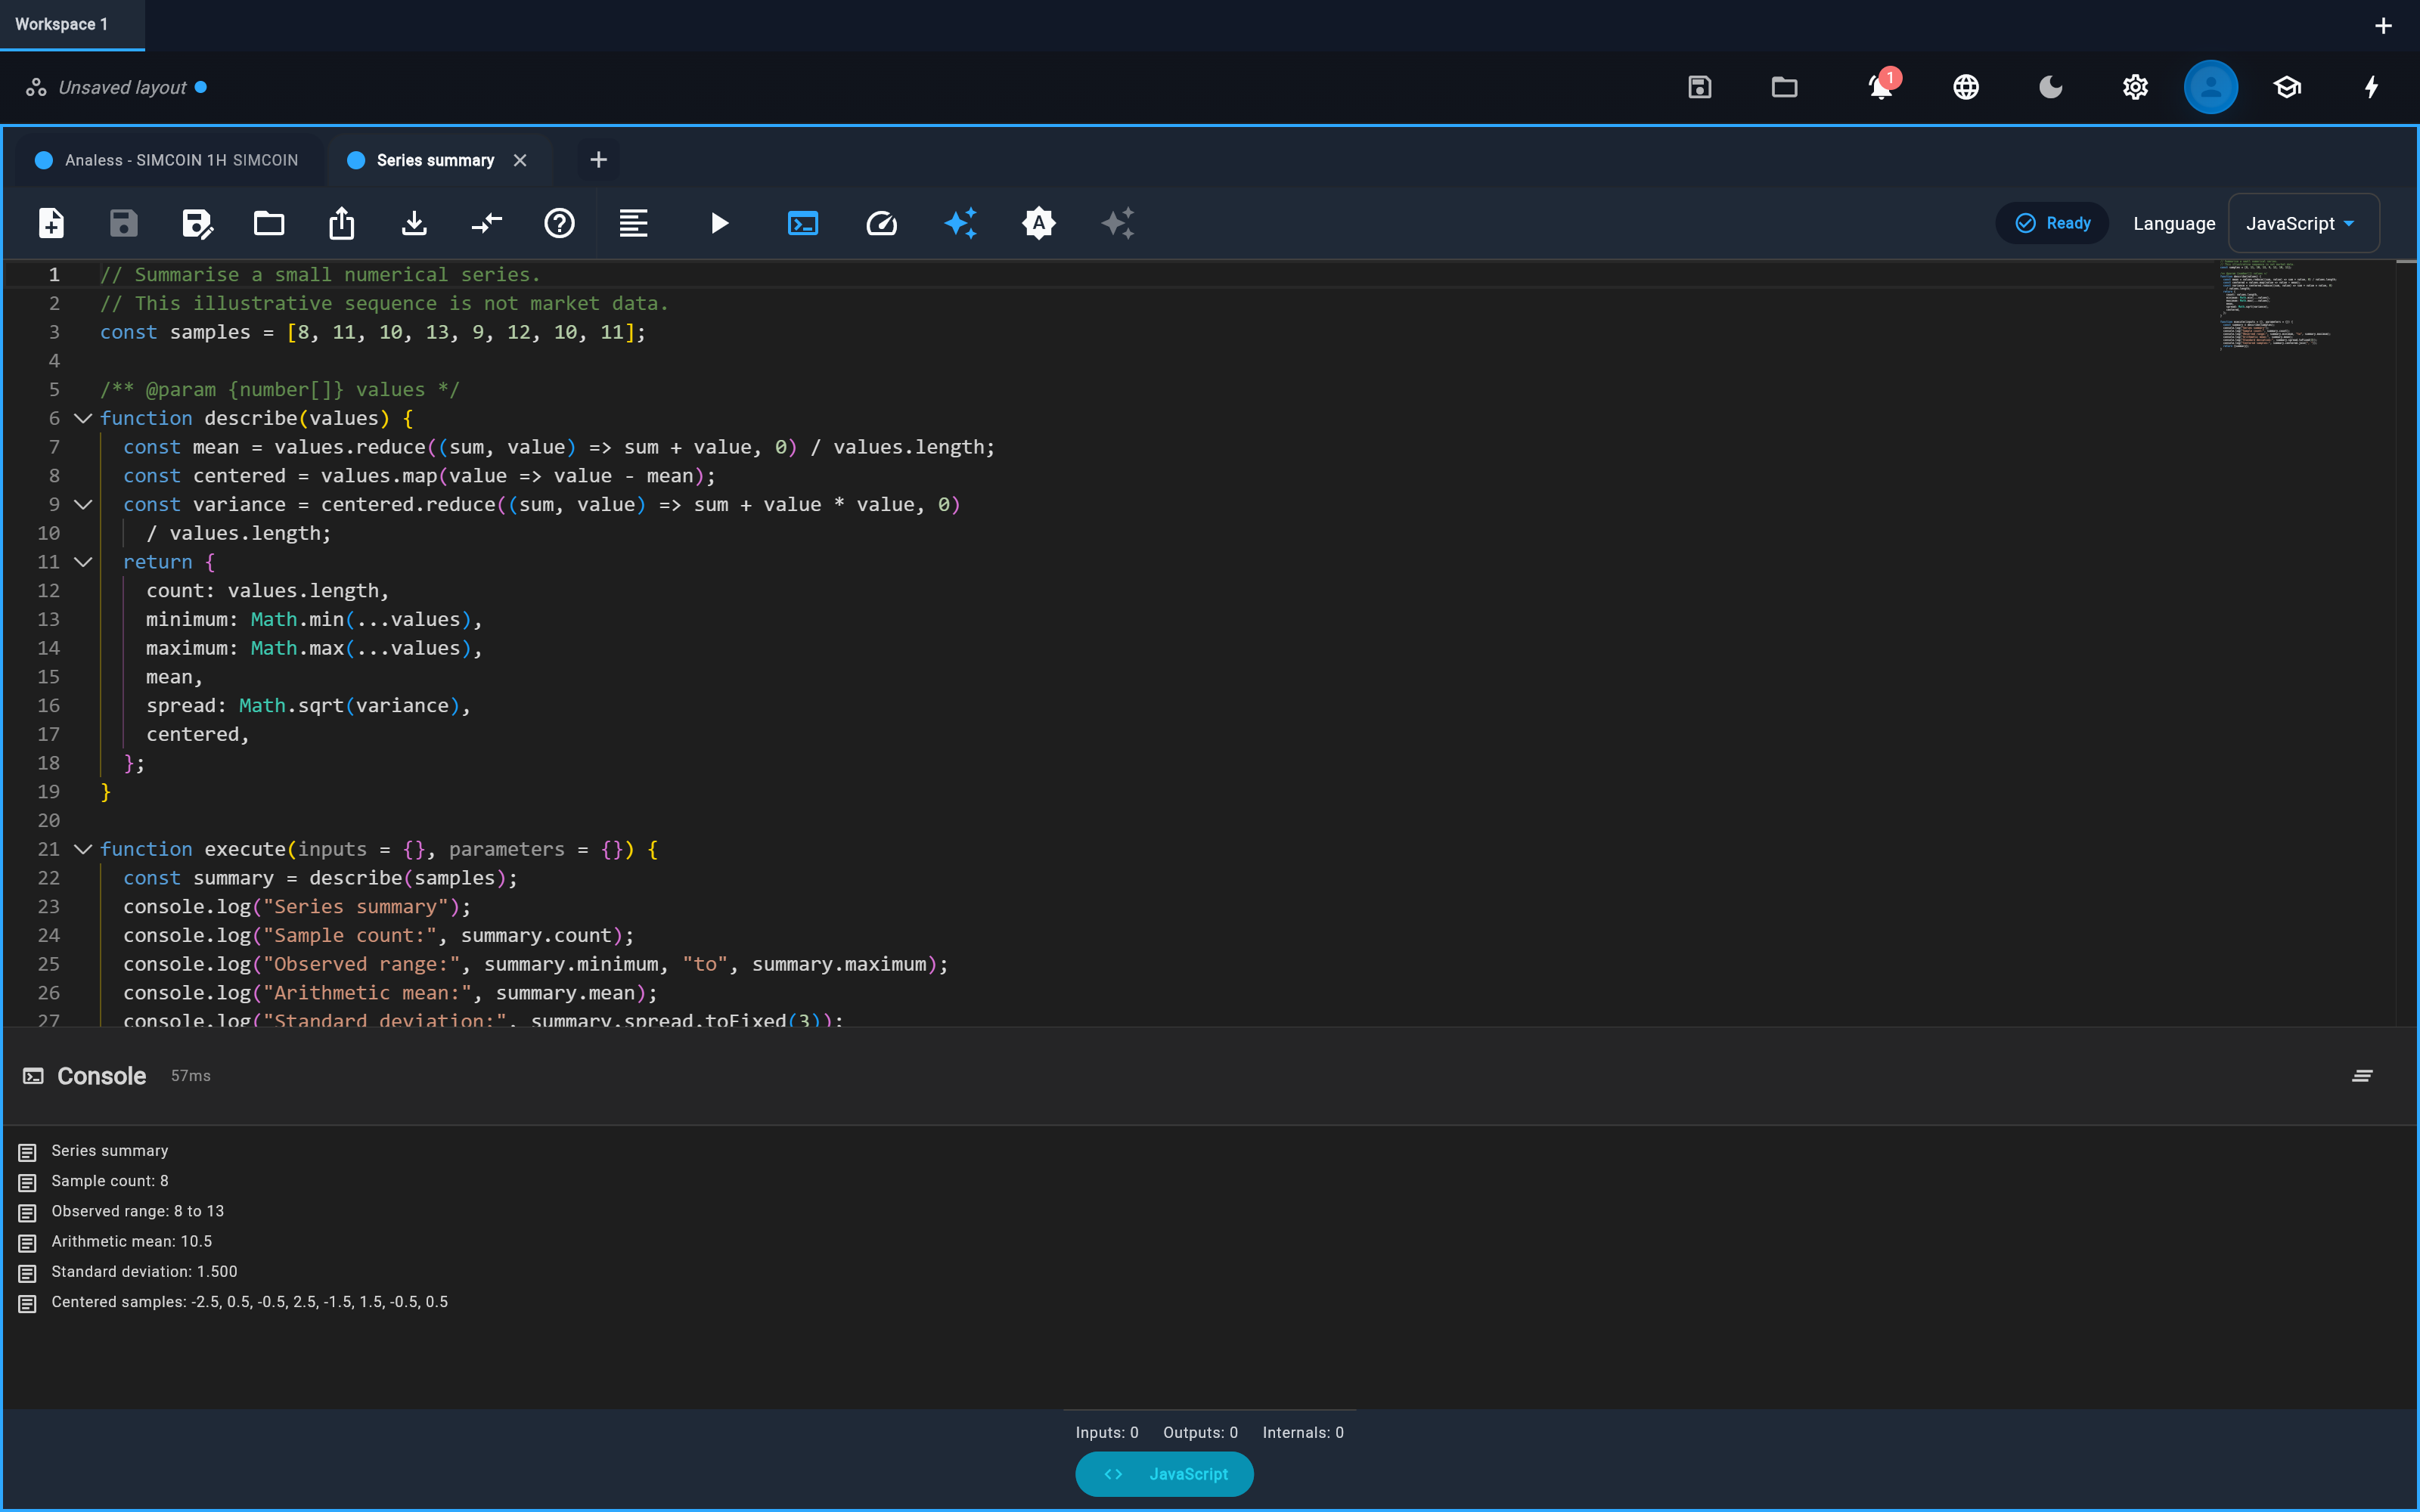
JavaScript and Python run inside the app. What you learn here works everywhere else.
When enabled, custom-code nodes drop your own logic into a strategy graph beside the built-in ones.
IntelliSense completes as you type. An assistant drafts and completes code inline; you decide what stays.
Keep the script and its console together. Explore the coding tools.
Shared analysis tools
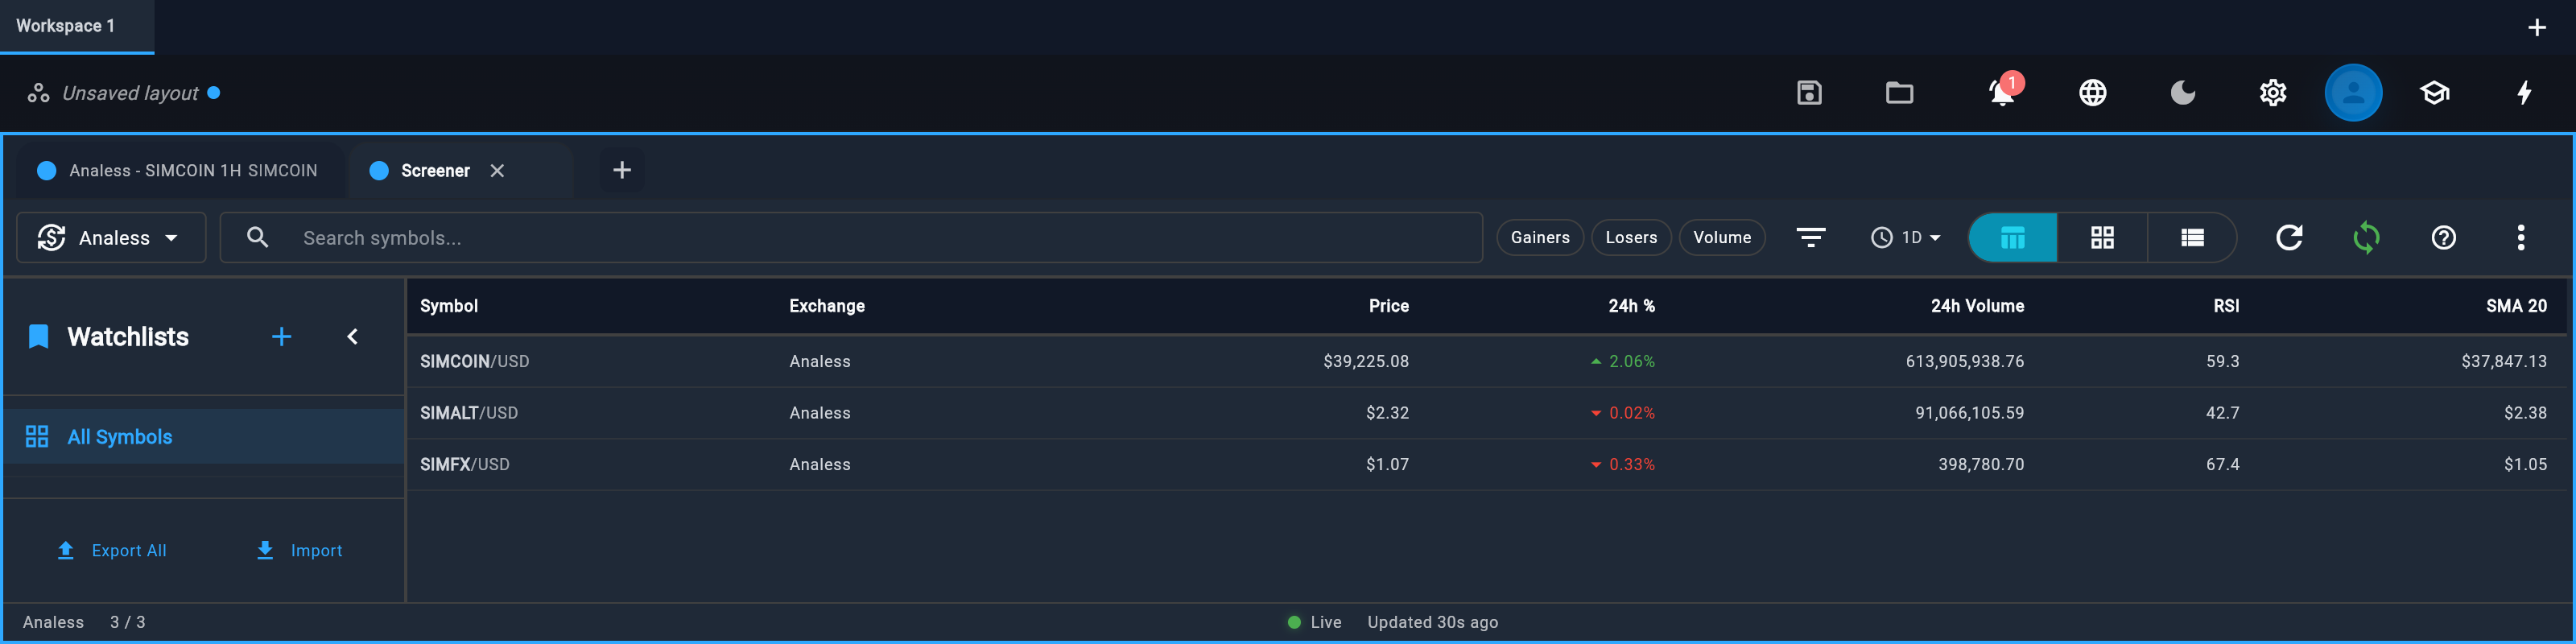
Stocks, forex and crypto share the same charts, indicators, screens and strategy graphs. Learn a tool once and it works in every market you follow, on data from providers you choose.
One rule close > 50-bar average
Chart and screen equities, with fundamentals where your provider supplies them.
Apply the same indicators and rules to supported currency pairs.
Study supported spot crypto instruments with the same tools.
Coverage depends on your feed. Choose your data sources.
Agentic workspace
Turn a small setup task into a conversation. When enabled, an agent can work across the tools while you review what it proposes.
“Add a moving average to this chart and arrange the workspace for a closer look.” An example of a task you could give the planned agent.
Review the proposed changes before approving them. AI responses may contain errors.3 See actions and permission boundaries
One workspace
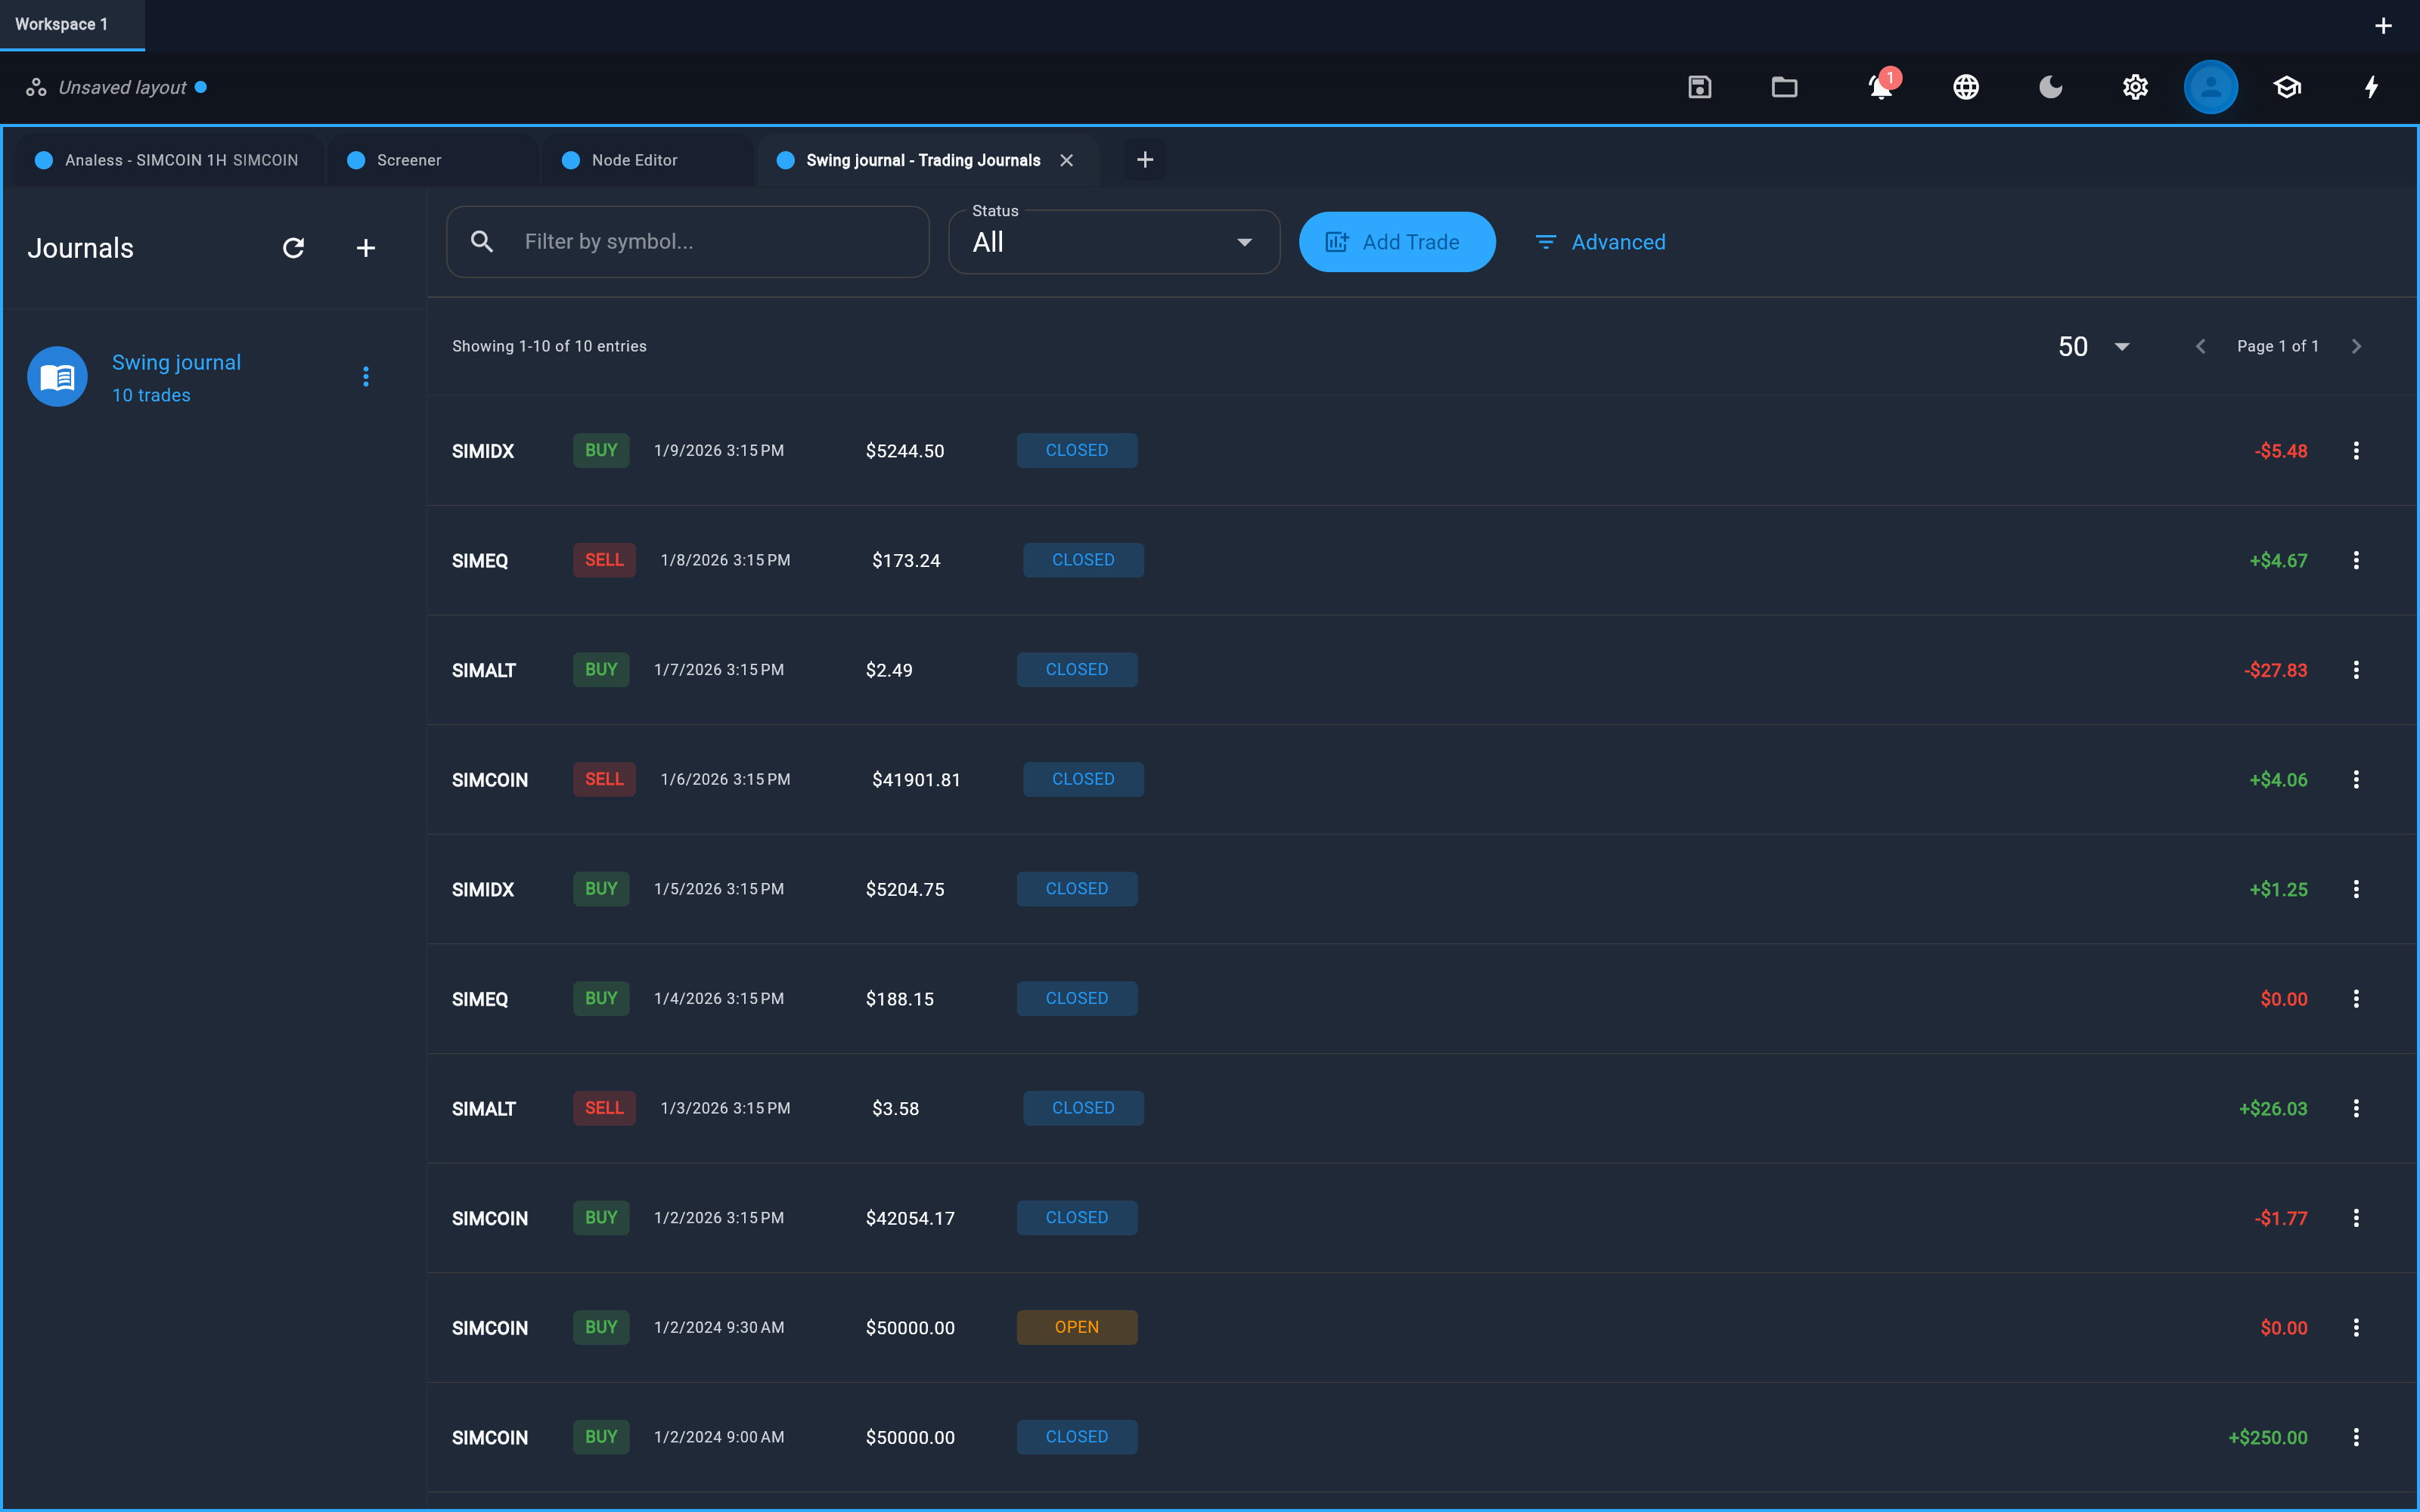
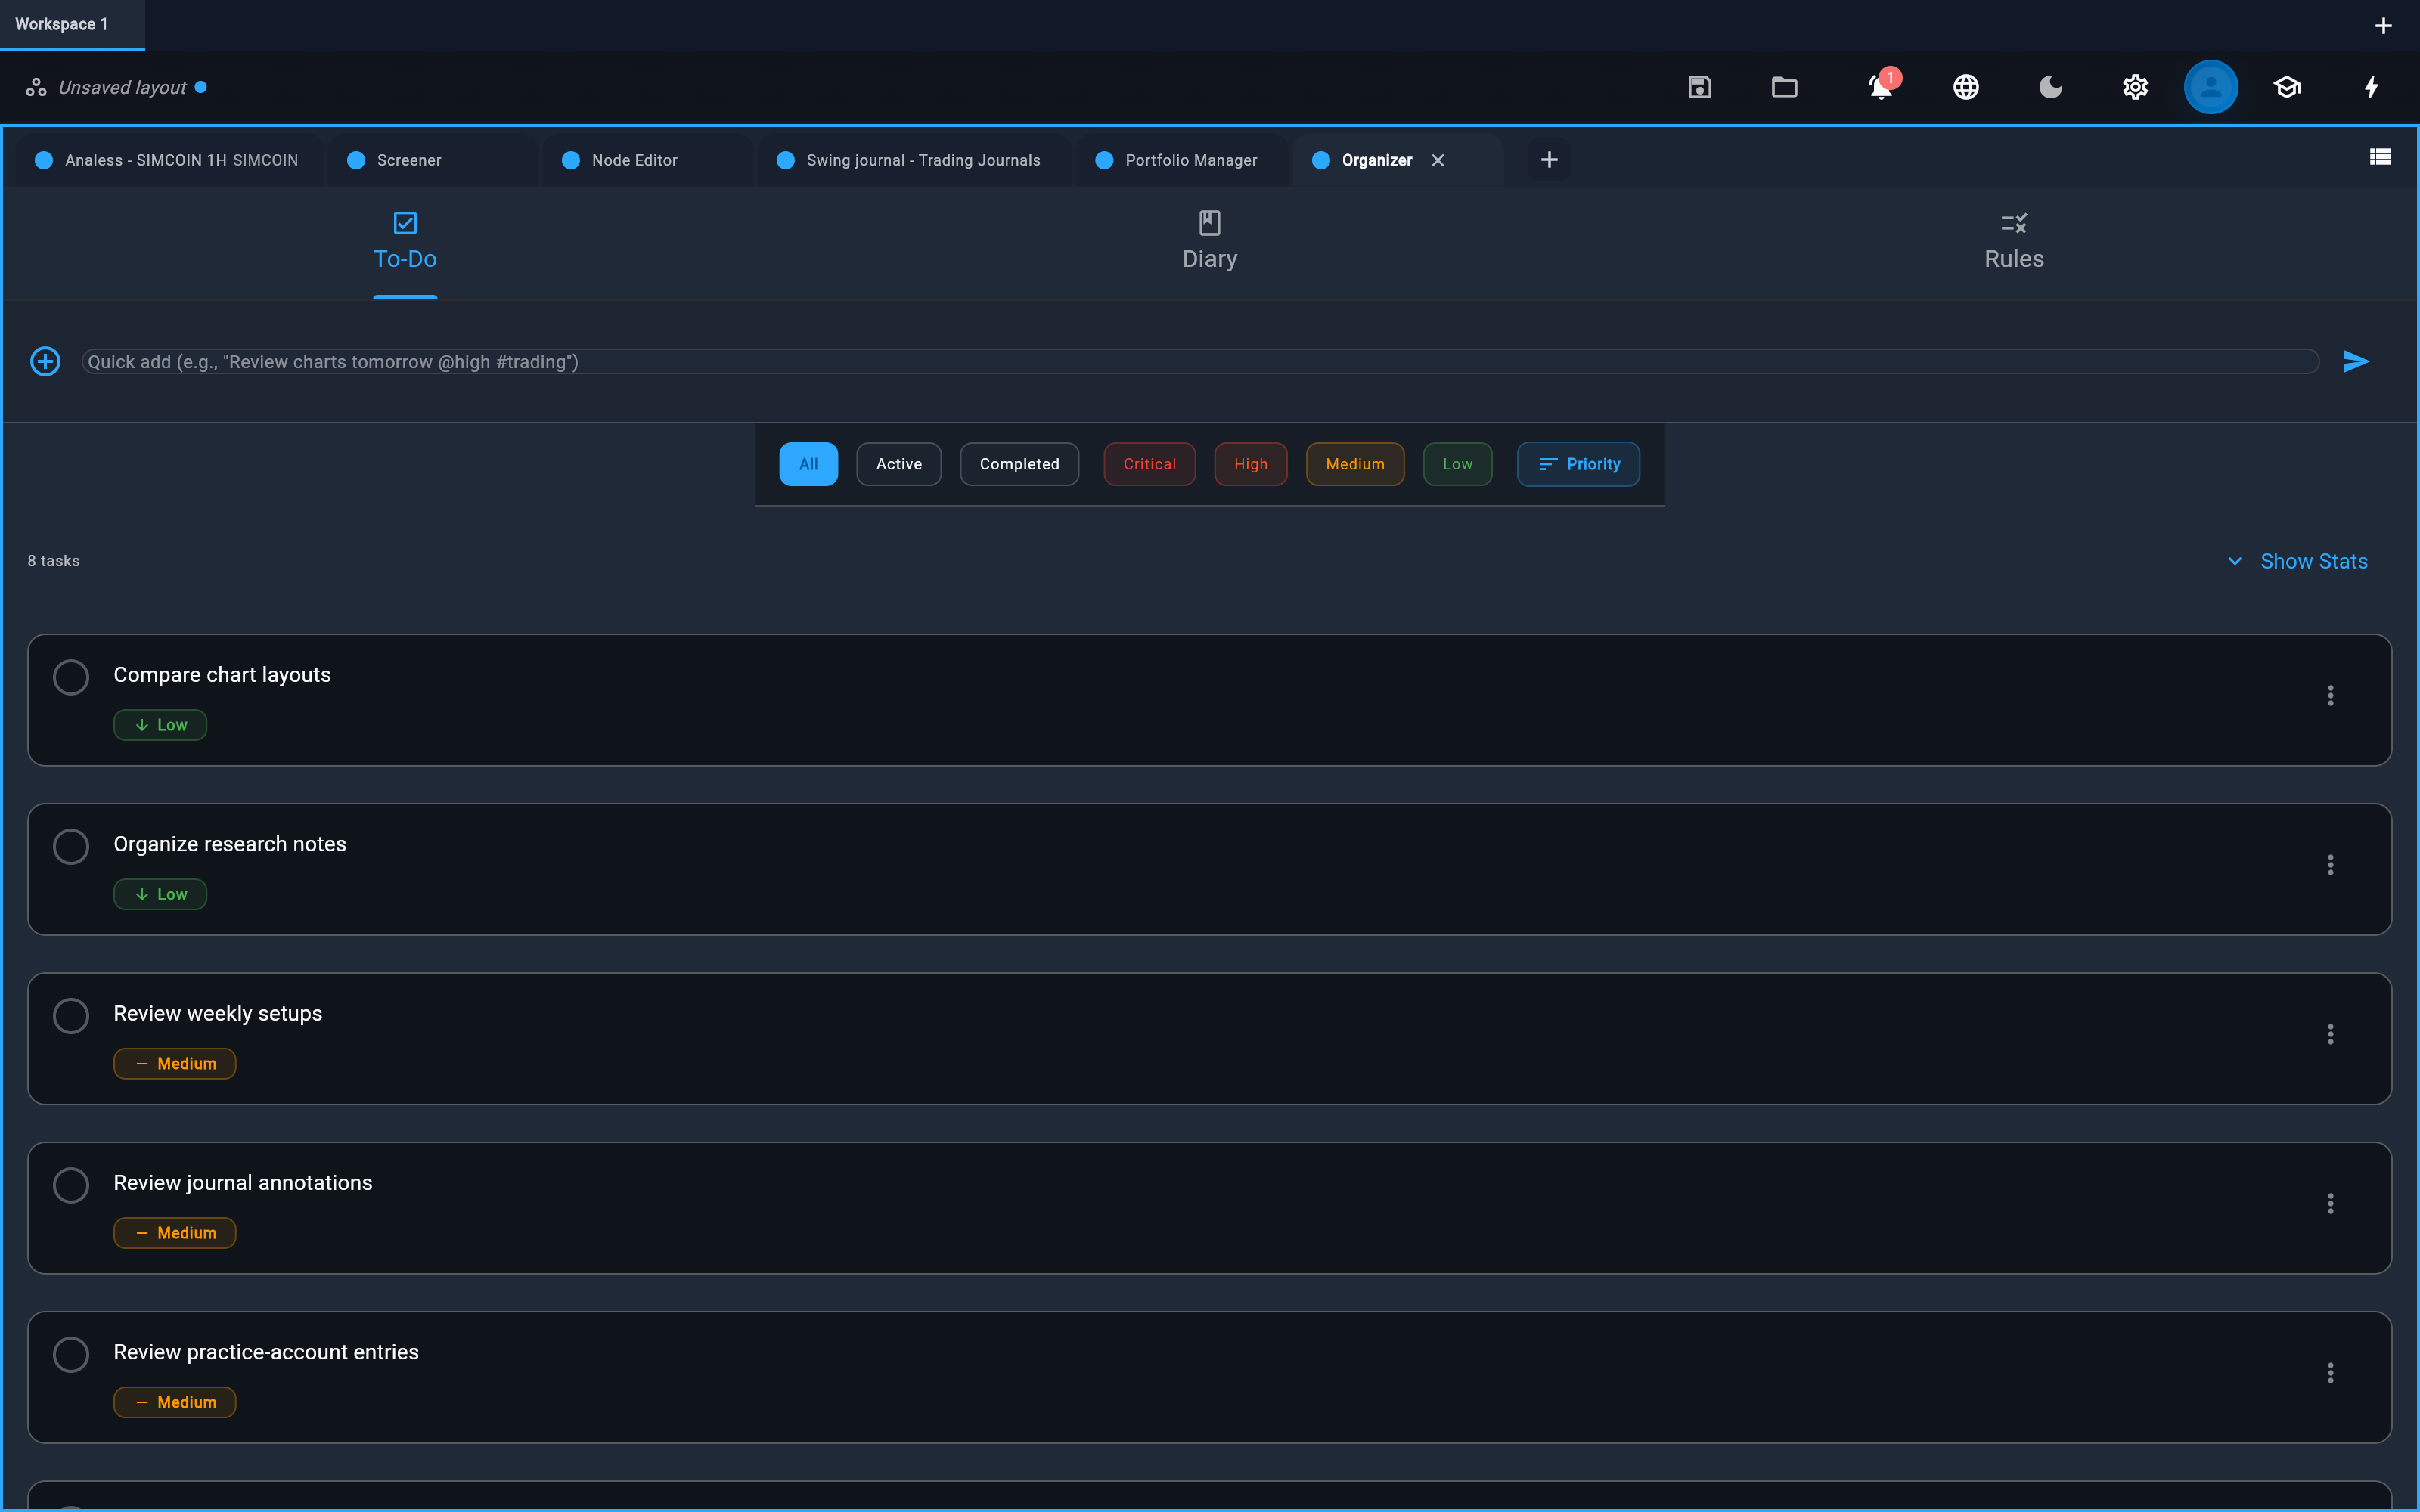
The tools you would normally spread across separate products open as tabs in one window. Split them side by side, float a panel above the layout, and pick up where you left off: workspaces restore automatically.
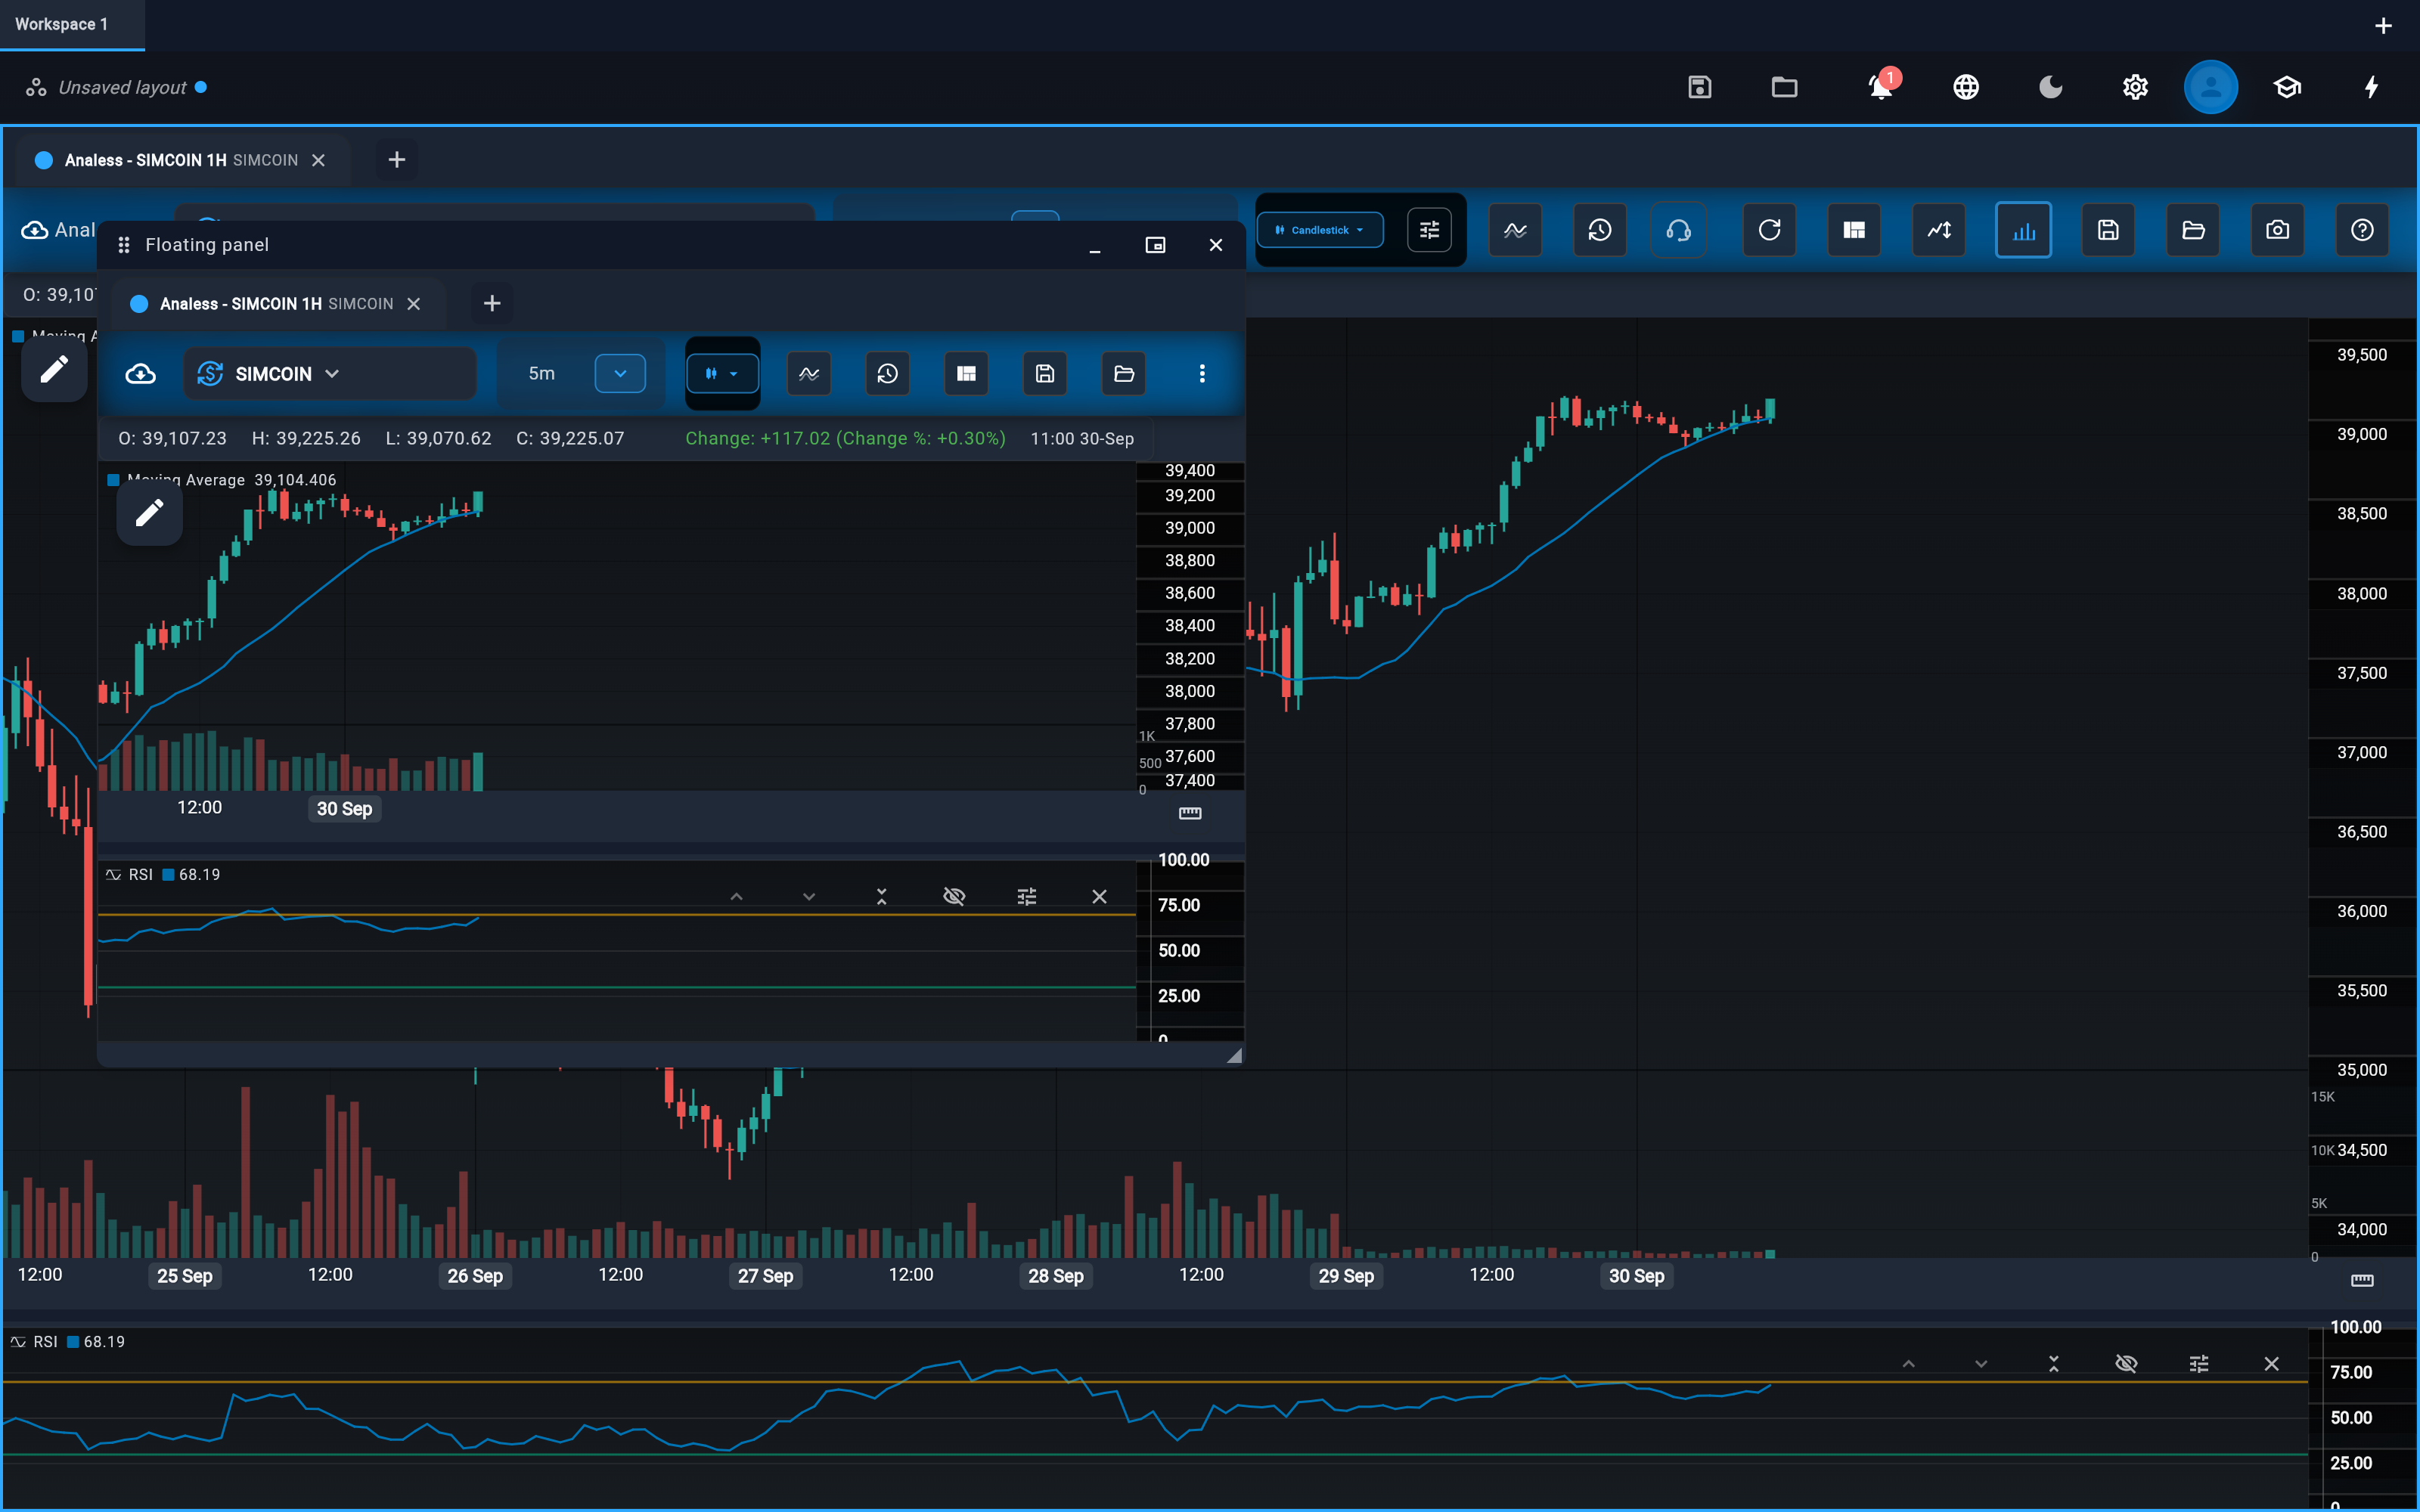
Every device
A desktop for the deep dive, a browser when you’re away, a phone for a quick look. We’re designing familiar research tools for each screen, with layouts that adapt to the space you have.
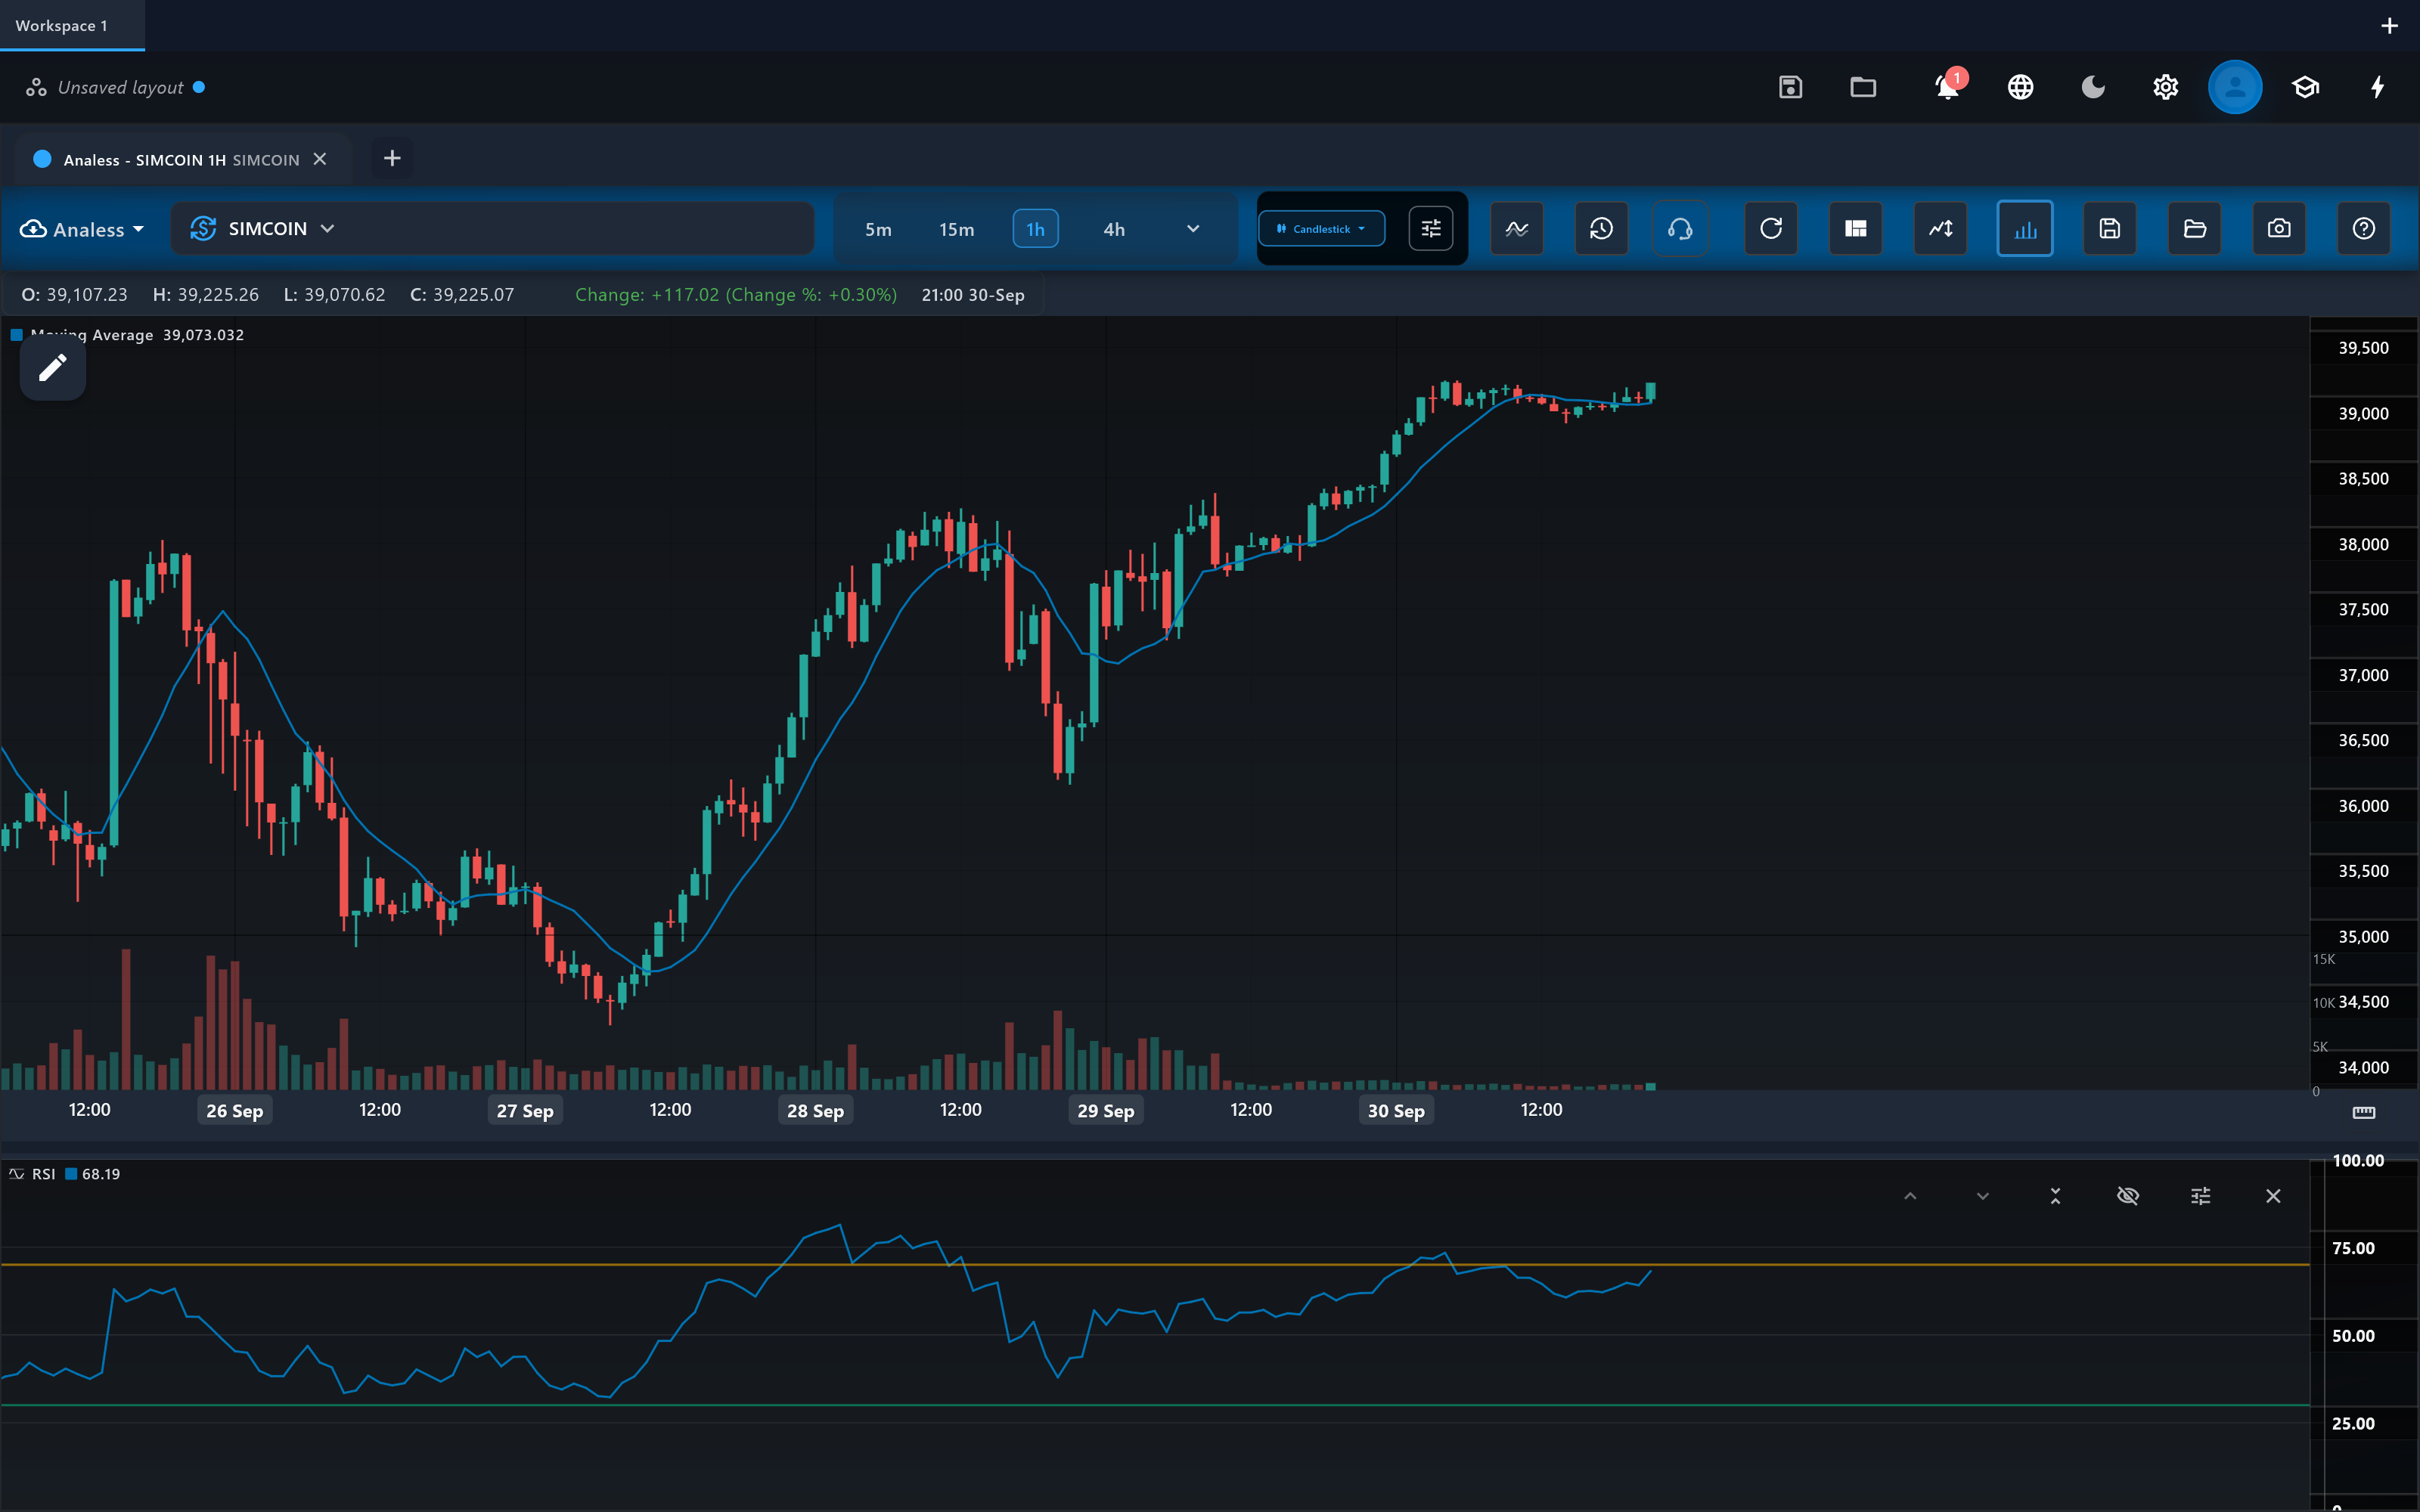
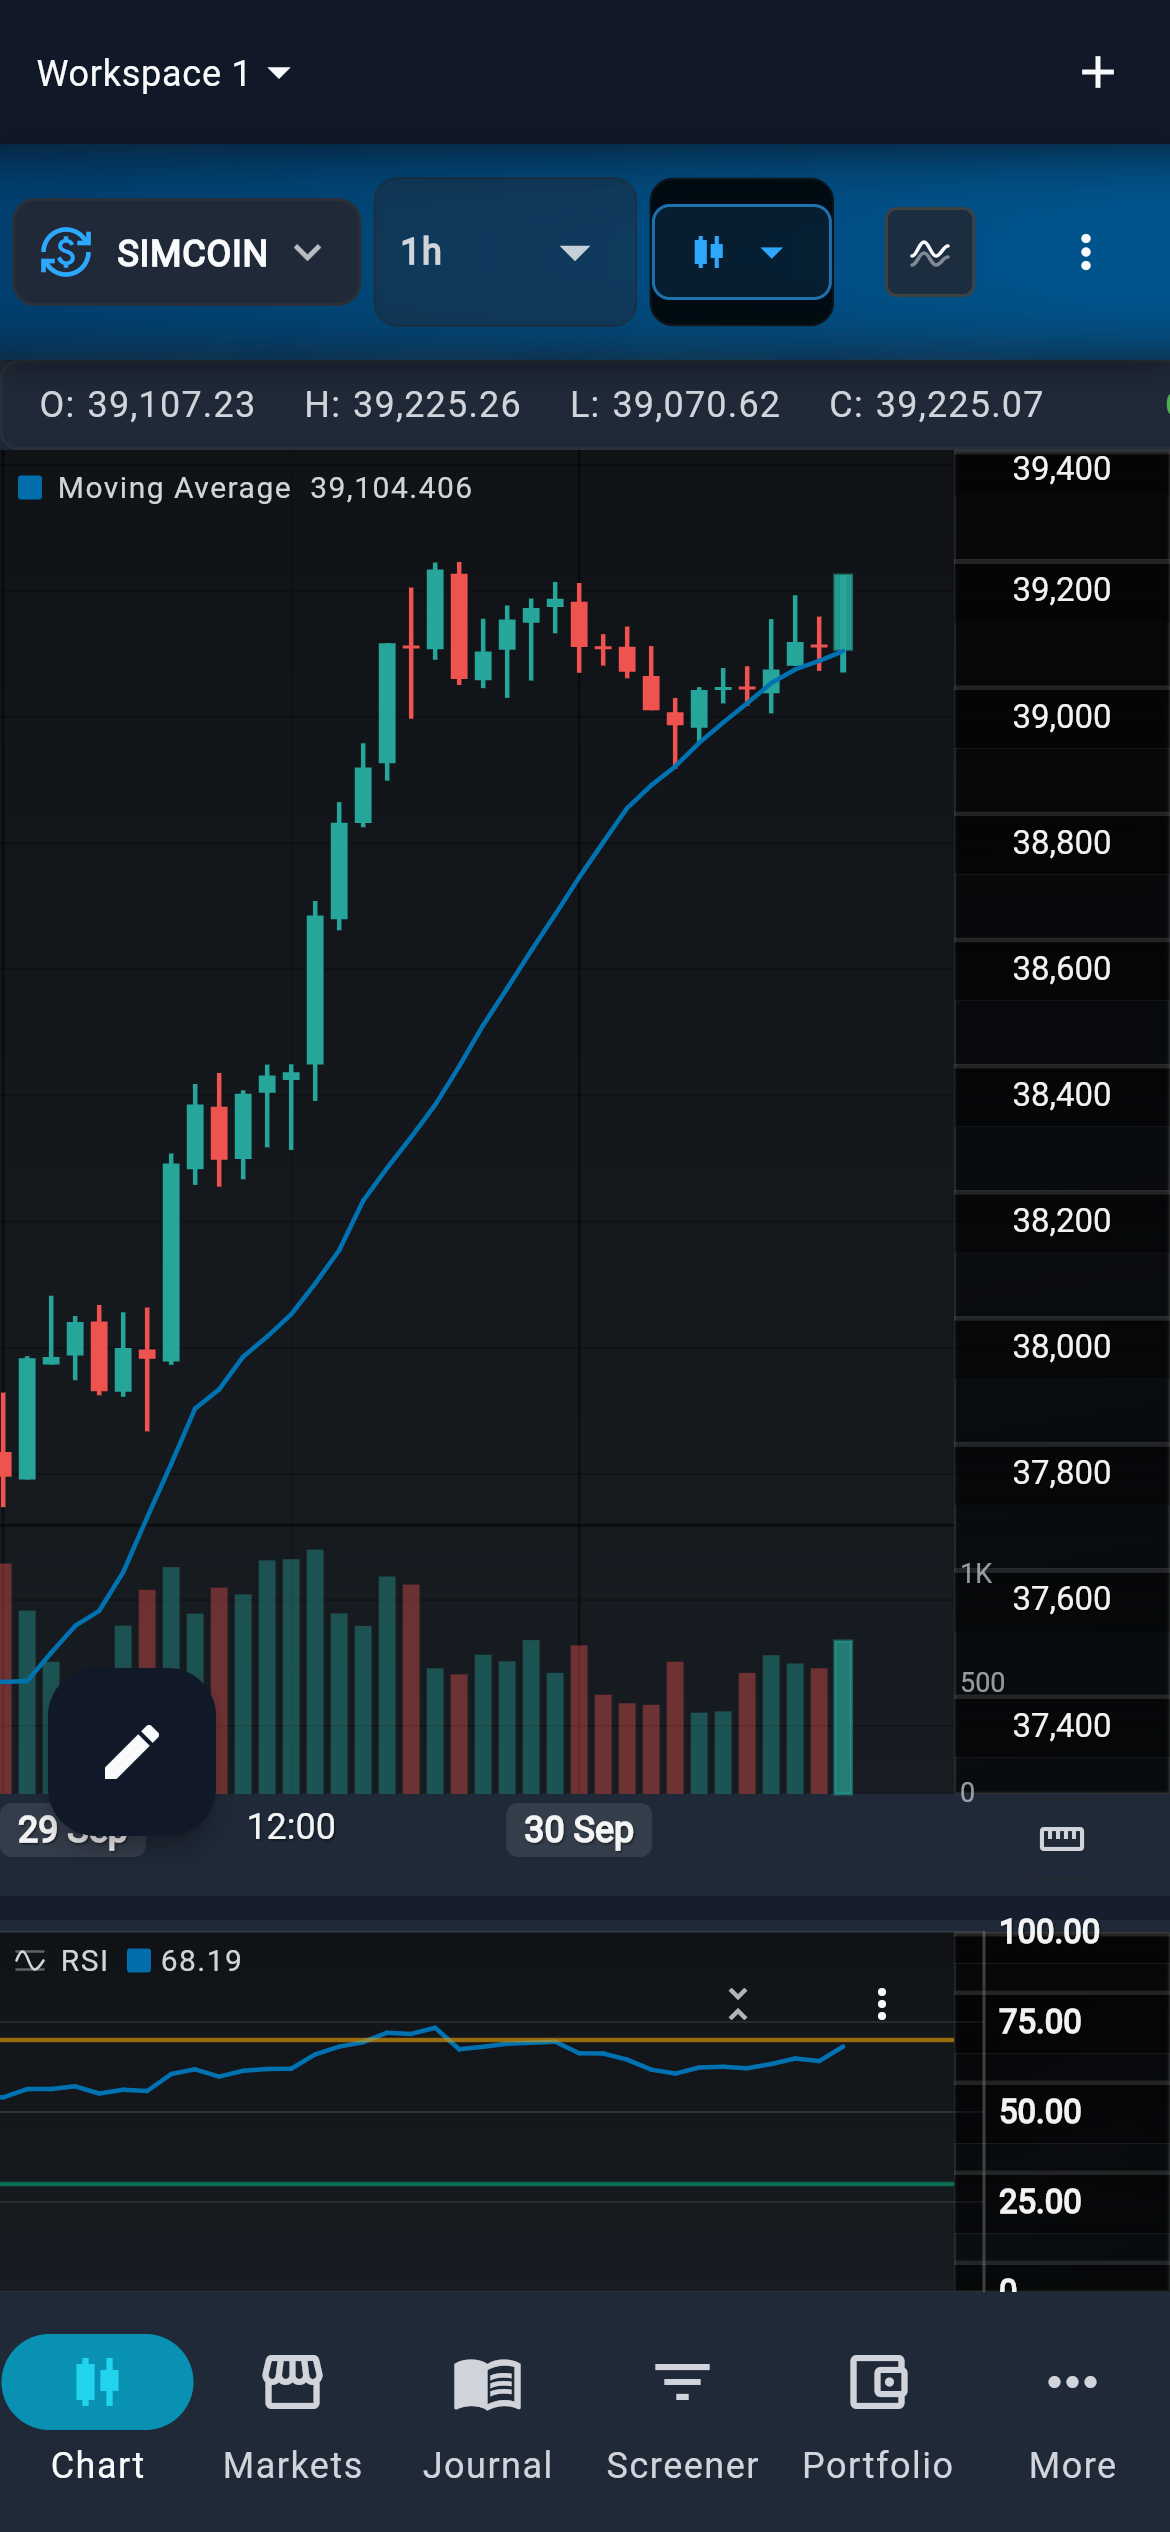
Progressive rollout. Devices arrive in stages, and not every one will be available at the start. See device support.
Made for everyone
Professional tools should not depend on the language you read or how you use a screen.
The workbench is available in 15 languages, and so are all its educational materials. Learn in the language you think in.
Which languagesScreen-reader labels, a spoken summary of the chart, respect for your reduced-motion setting, and a command for any panel you would otherwise drag.
How it worksResearch on your terms
A workbench should earn your trust as well as your attention. Local-first research gives you a place to work before choosing how to connect.
Your research is stored on your device by default. Cached chart history remains there to study offline.
Local storage and data pathsConnect the supported data, AI and personal-cloud services that fit your research. Each has its own requirements and availability.
Explore connectionsEncryption and key protection depend on the platform. The browser’s default key is unprotected until you enable Browser protection.
Encryption and its limitsNext-gen market tools
One workspace that meets you where you are and has room for where you are going.
New to markets
Start with a chart and plain-language lessons. Add tools one at a time, as each starts to make sense.
Start with the essentialsAlready trading
Bring a question, trace your logic and review the results without losing the context that led you there.
Explore every featureFree to start, free to stay. No card required.