Charting
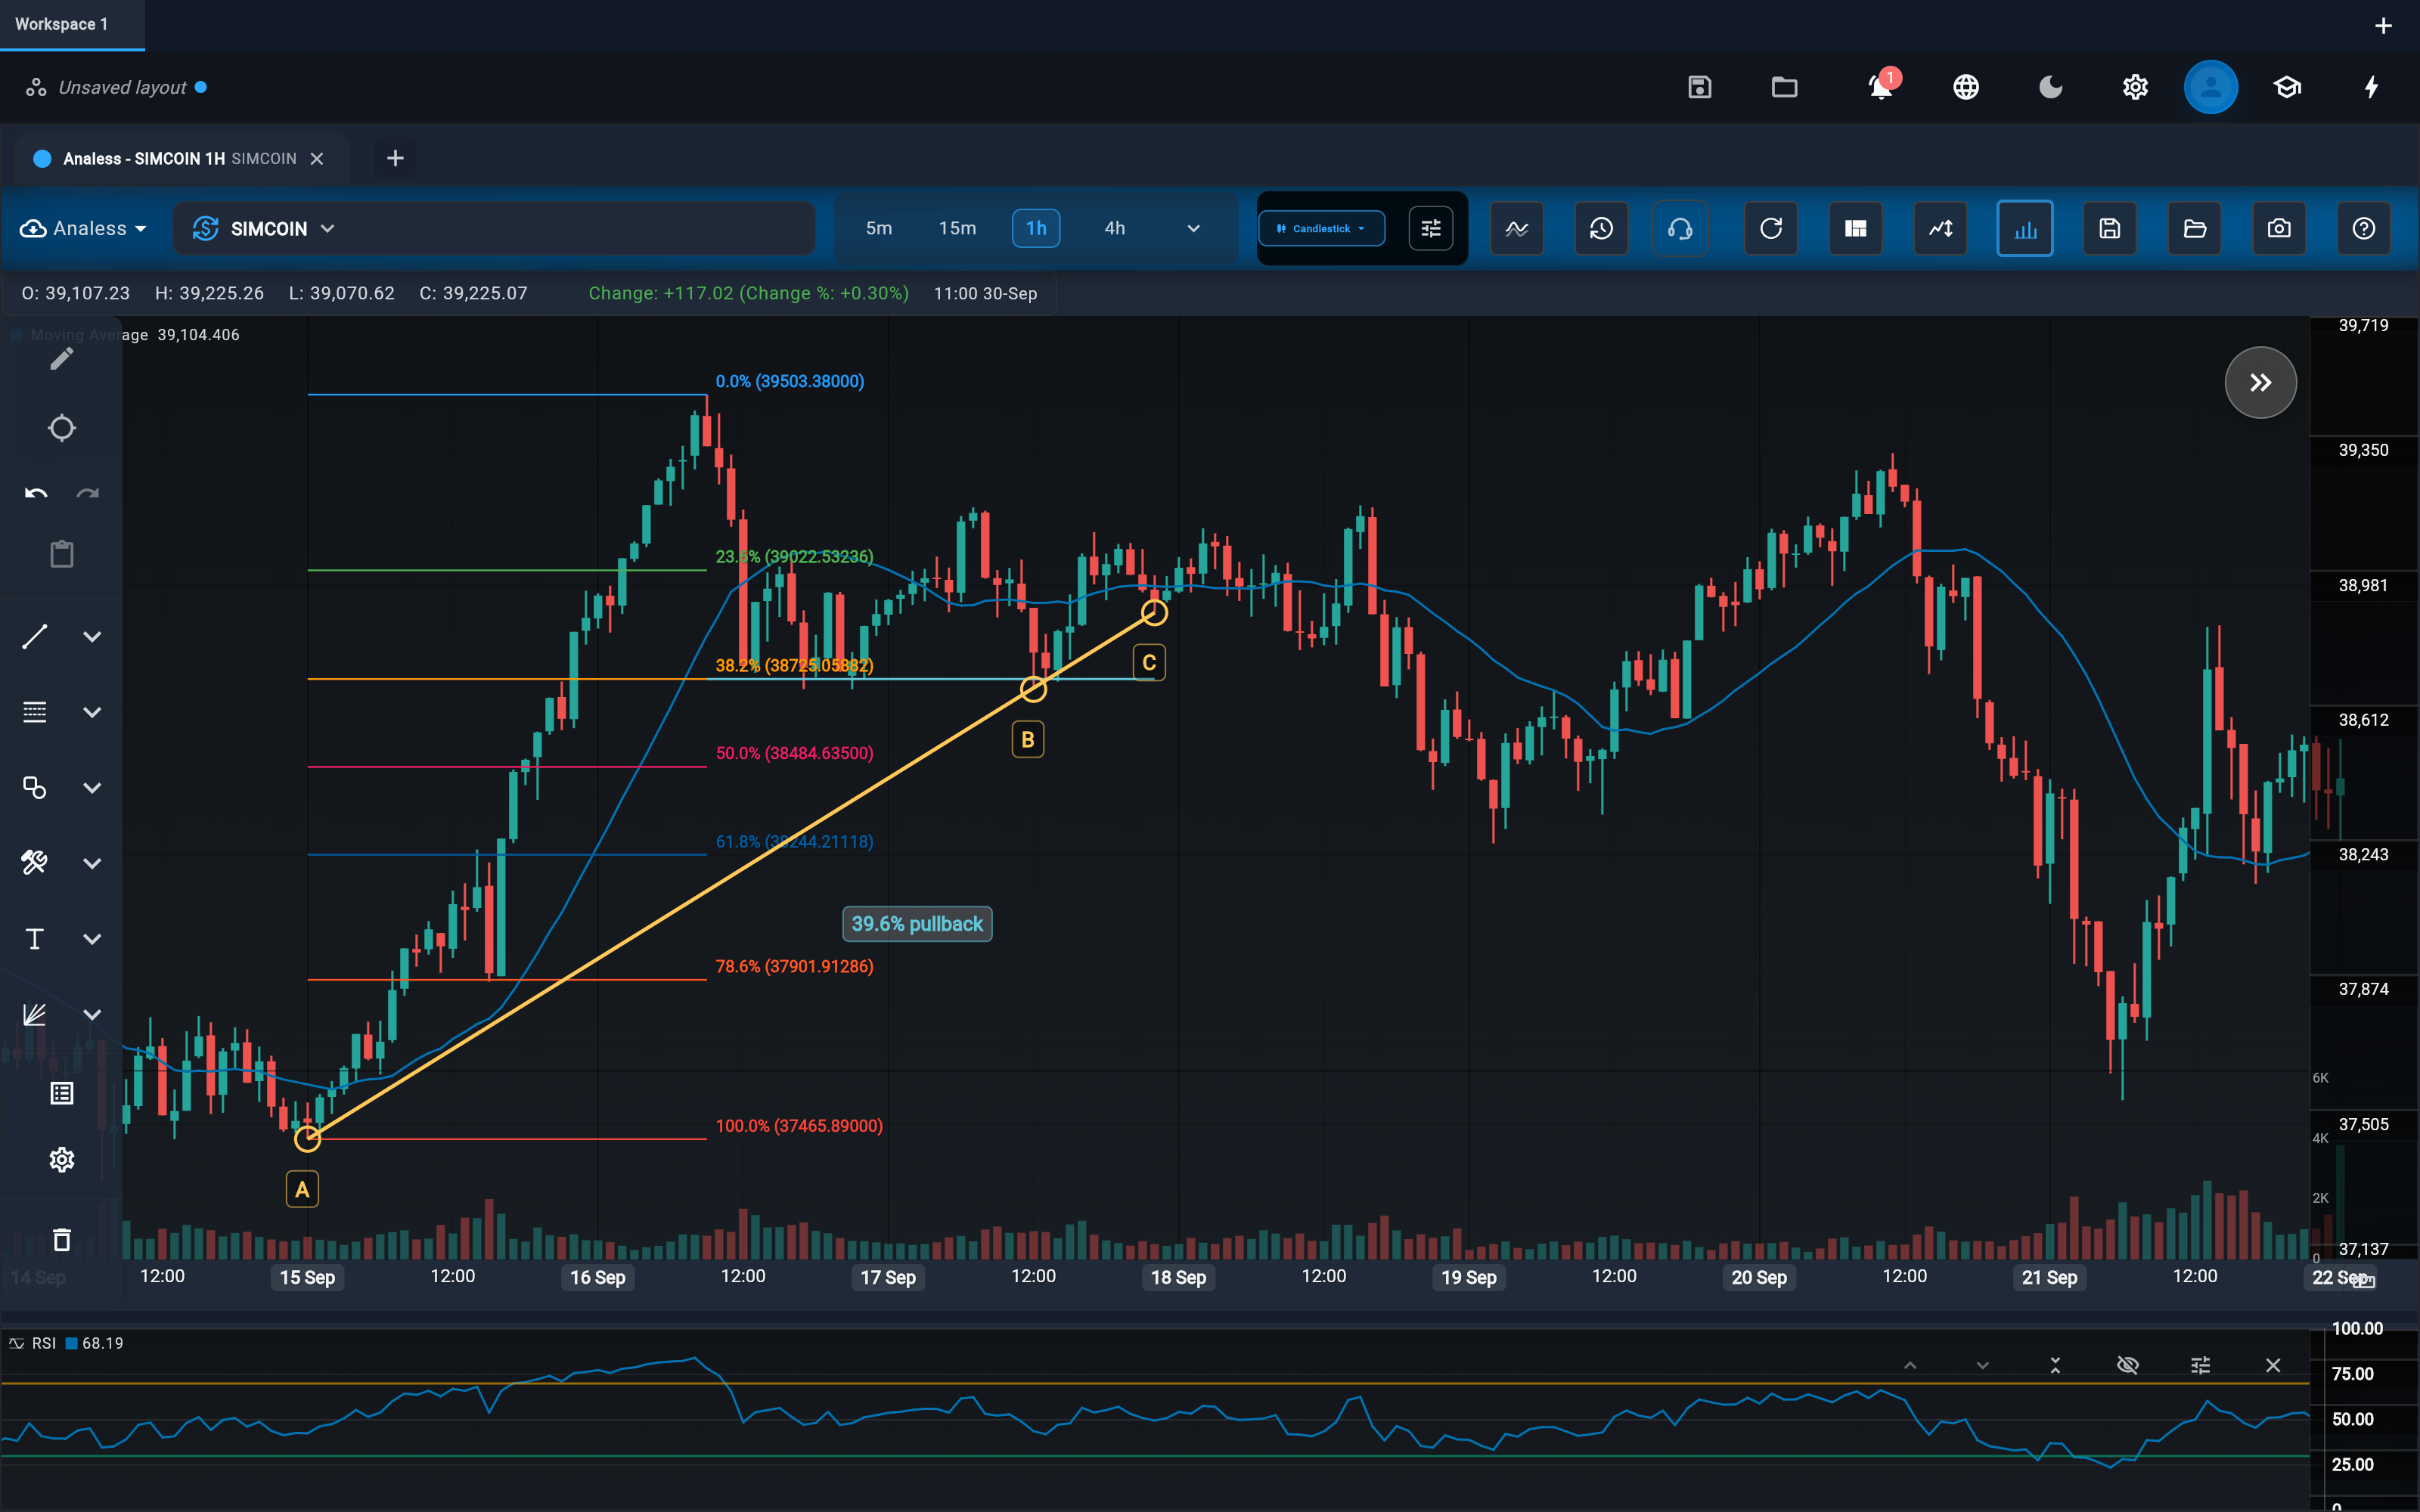
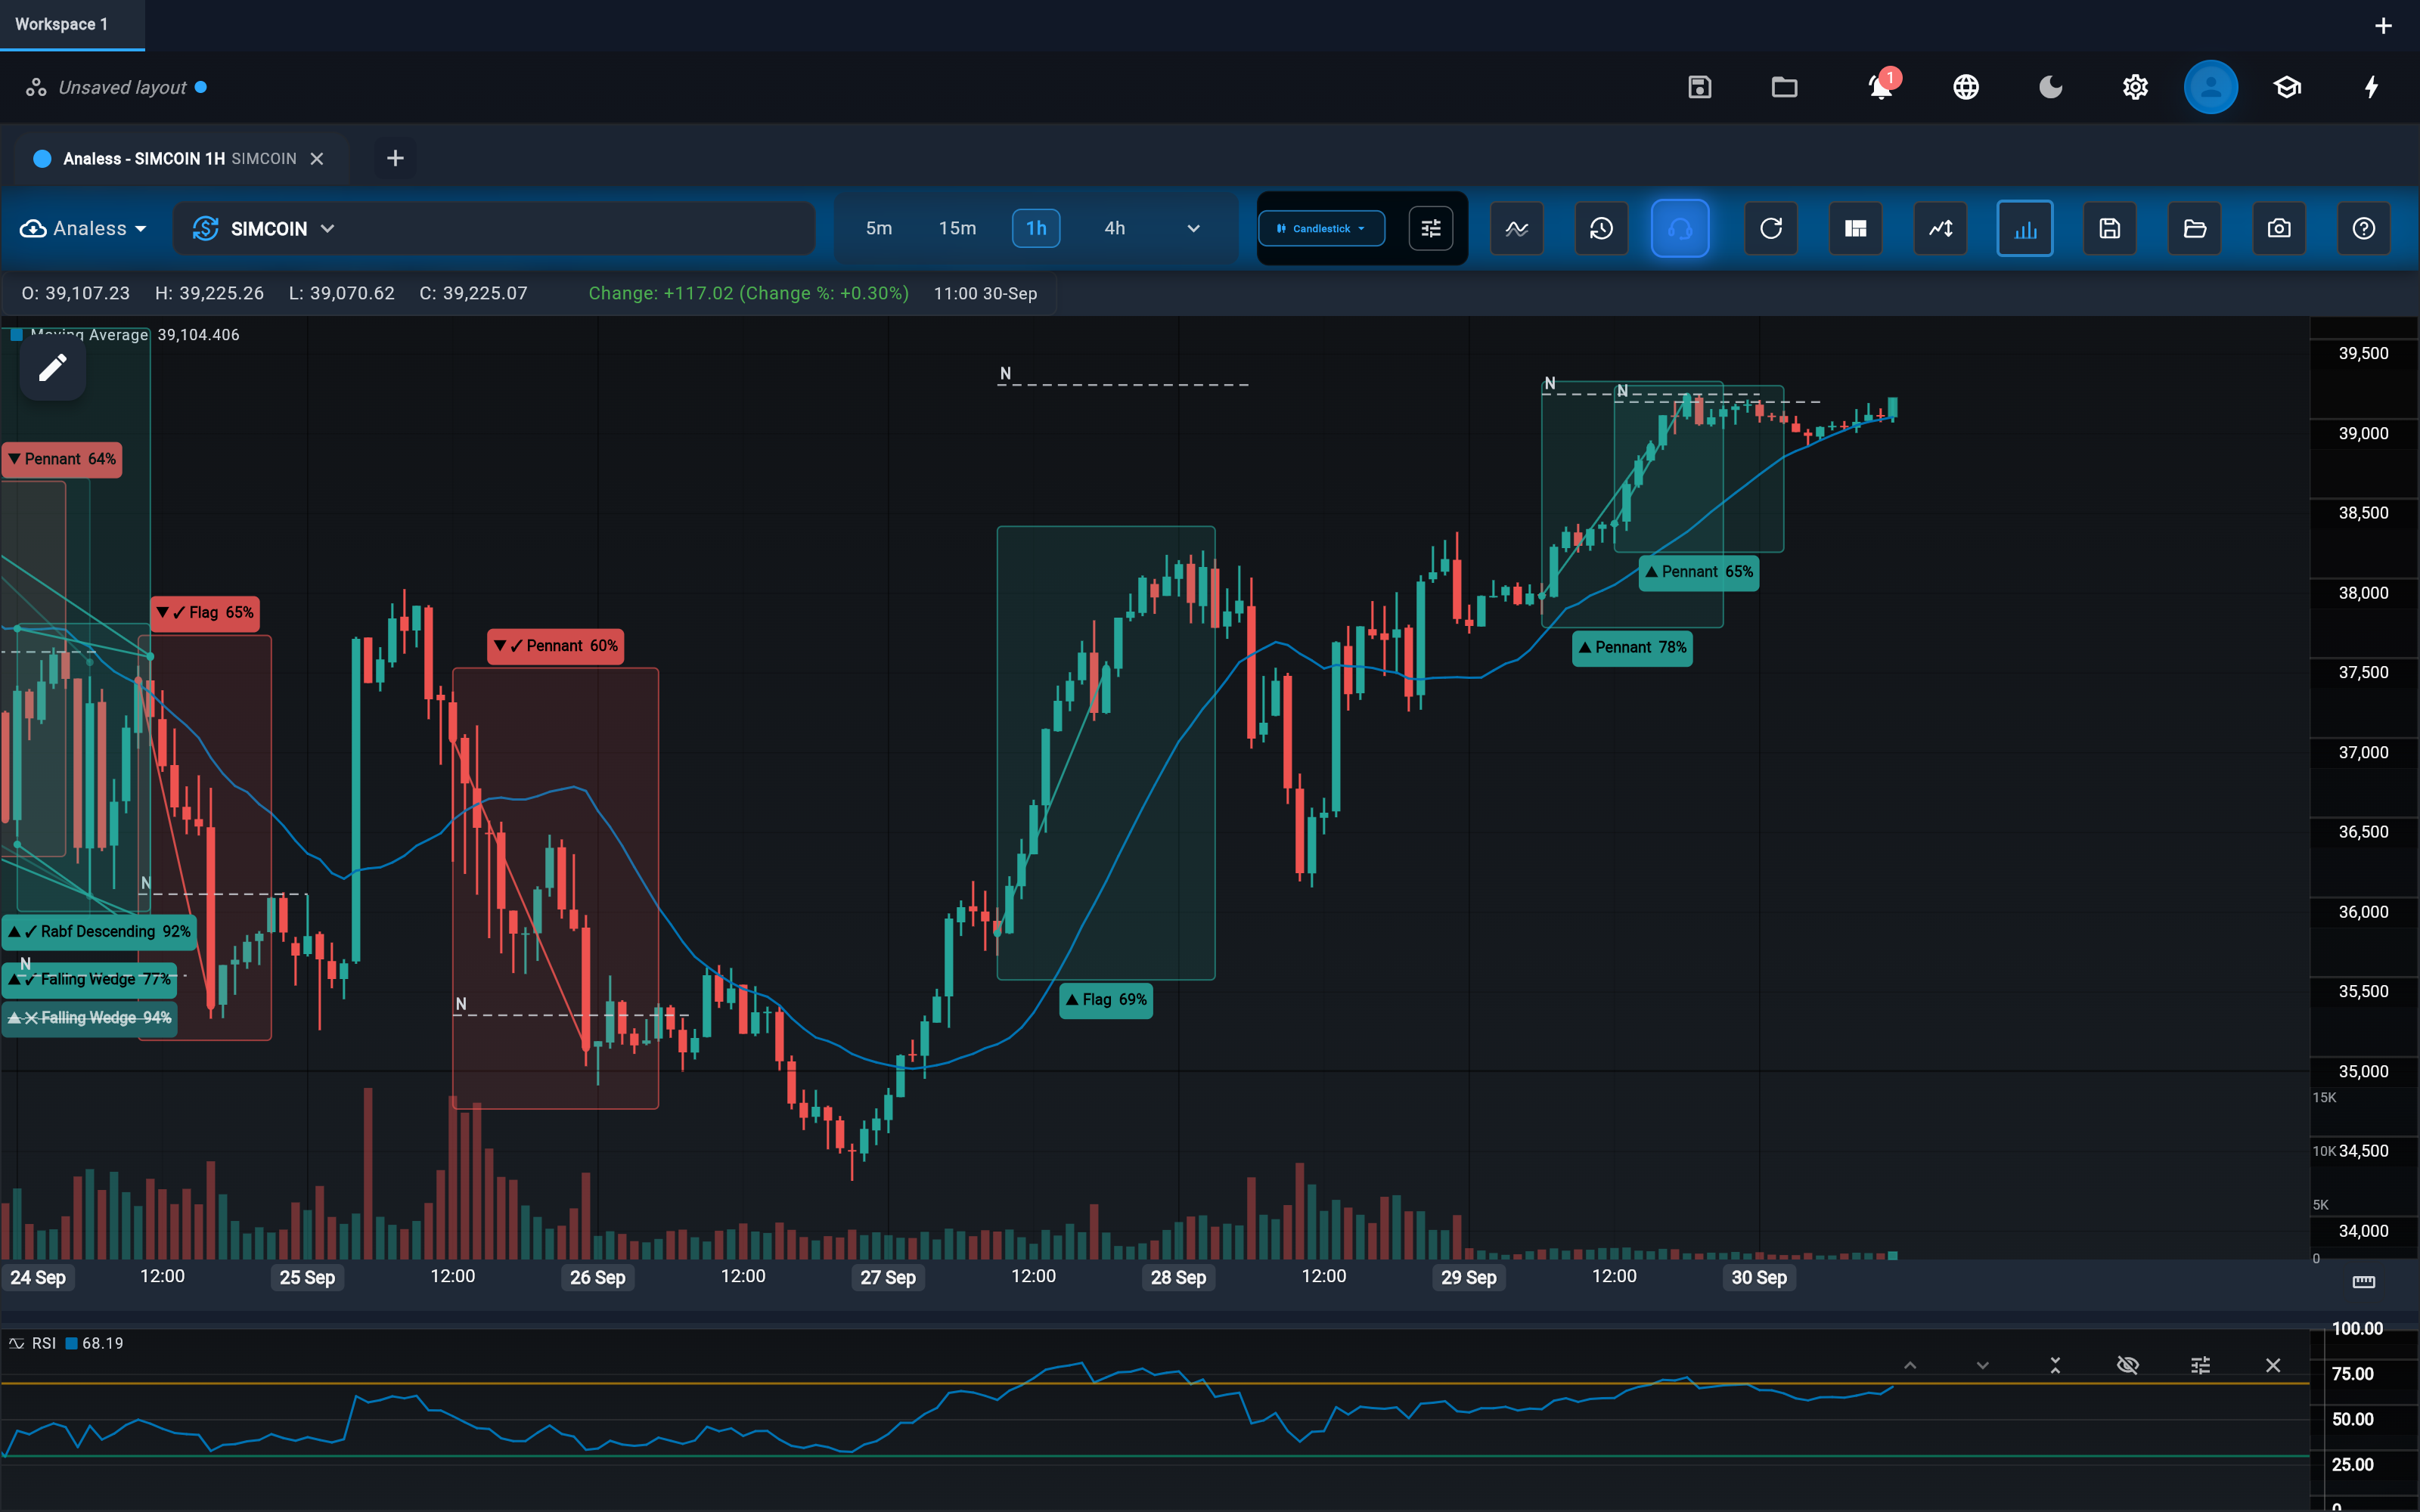
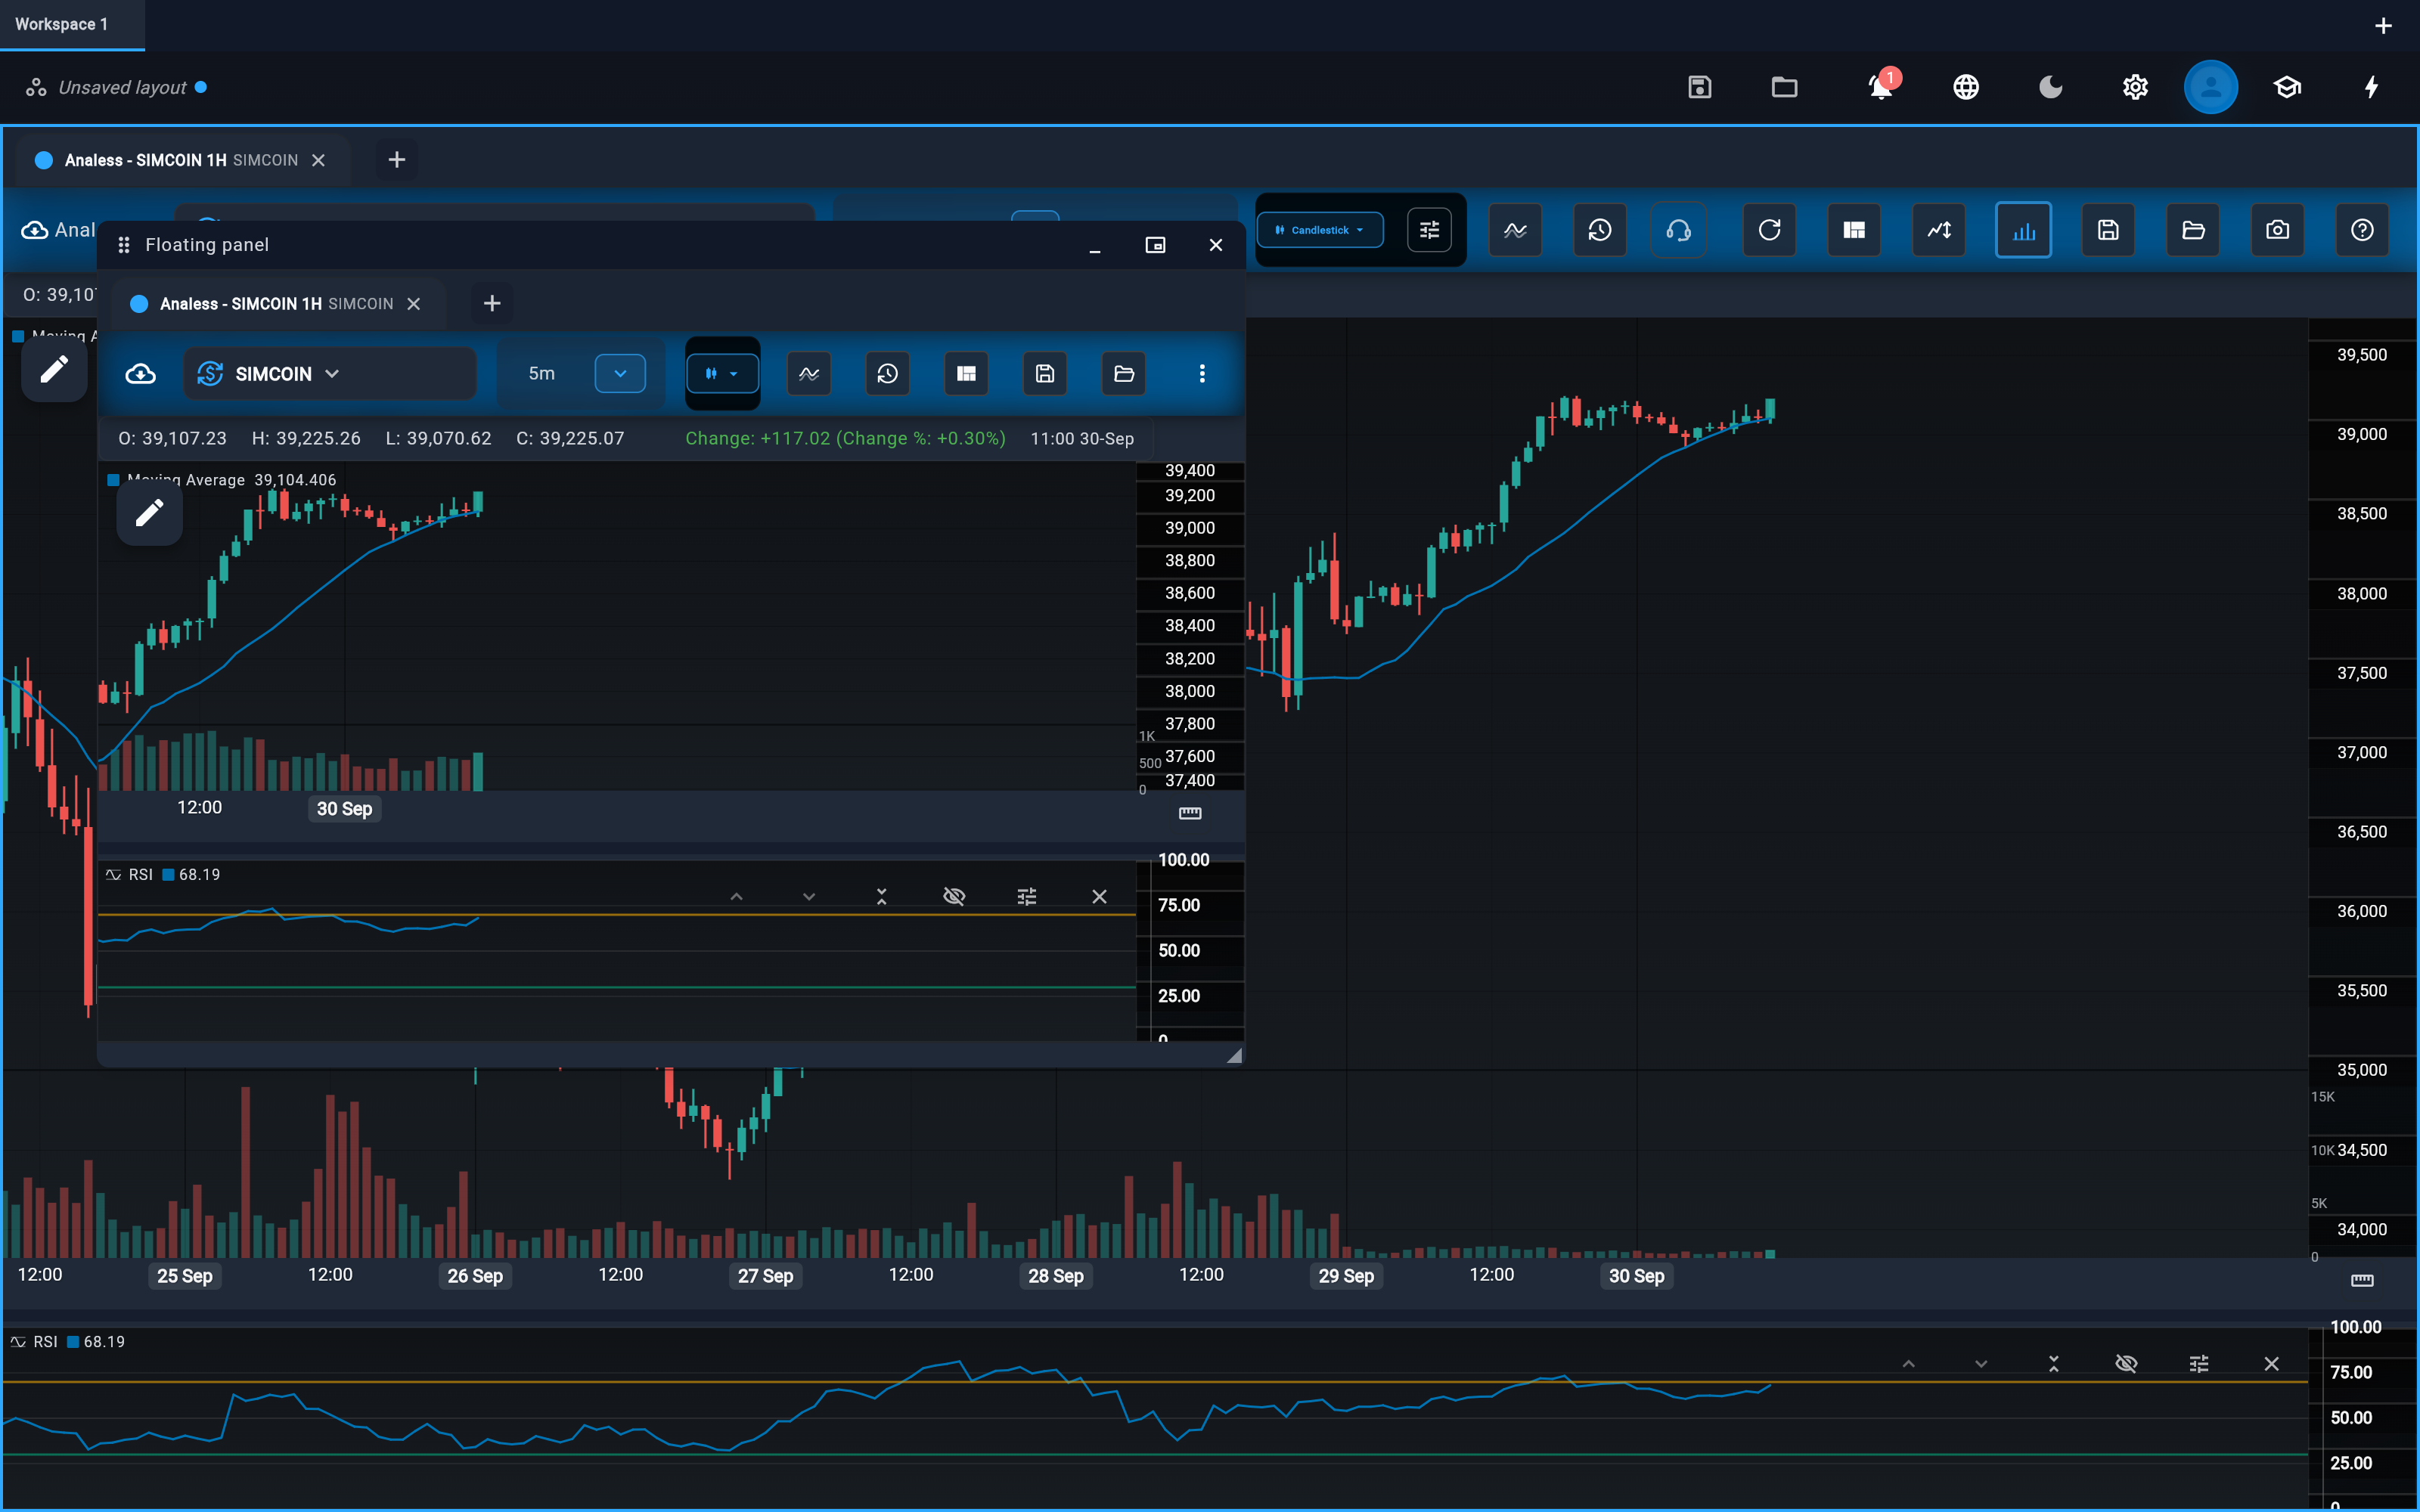
The chart at the centre of a connected research workbench.
- Crypto, forex and equities on one rendering and indicator engine
- Seven chart types: candlestick, OHLC, line, Heikin-Ashi, Renko, Kagi, Point & Figure
- Linear and logarithmic price scales, and multi-timeframe analysis
- Replay any chart bar by bar with the Time Machine
What sets it apart
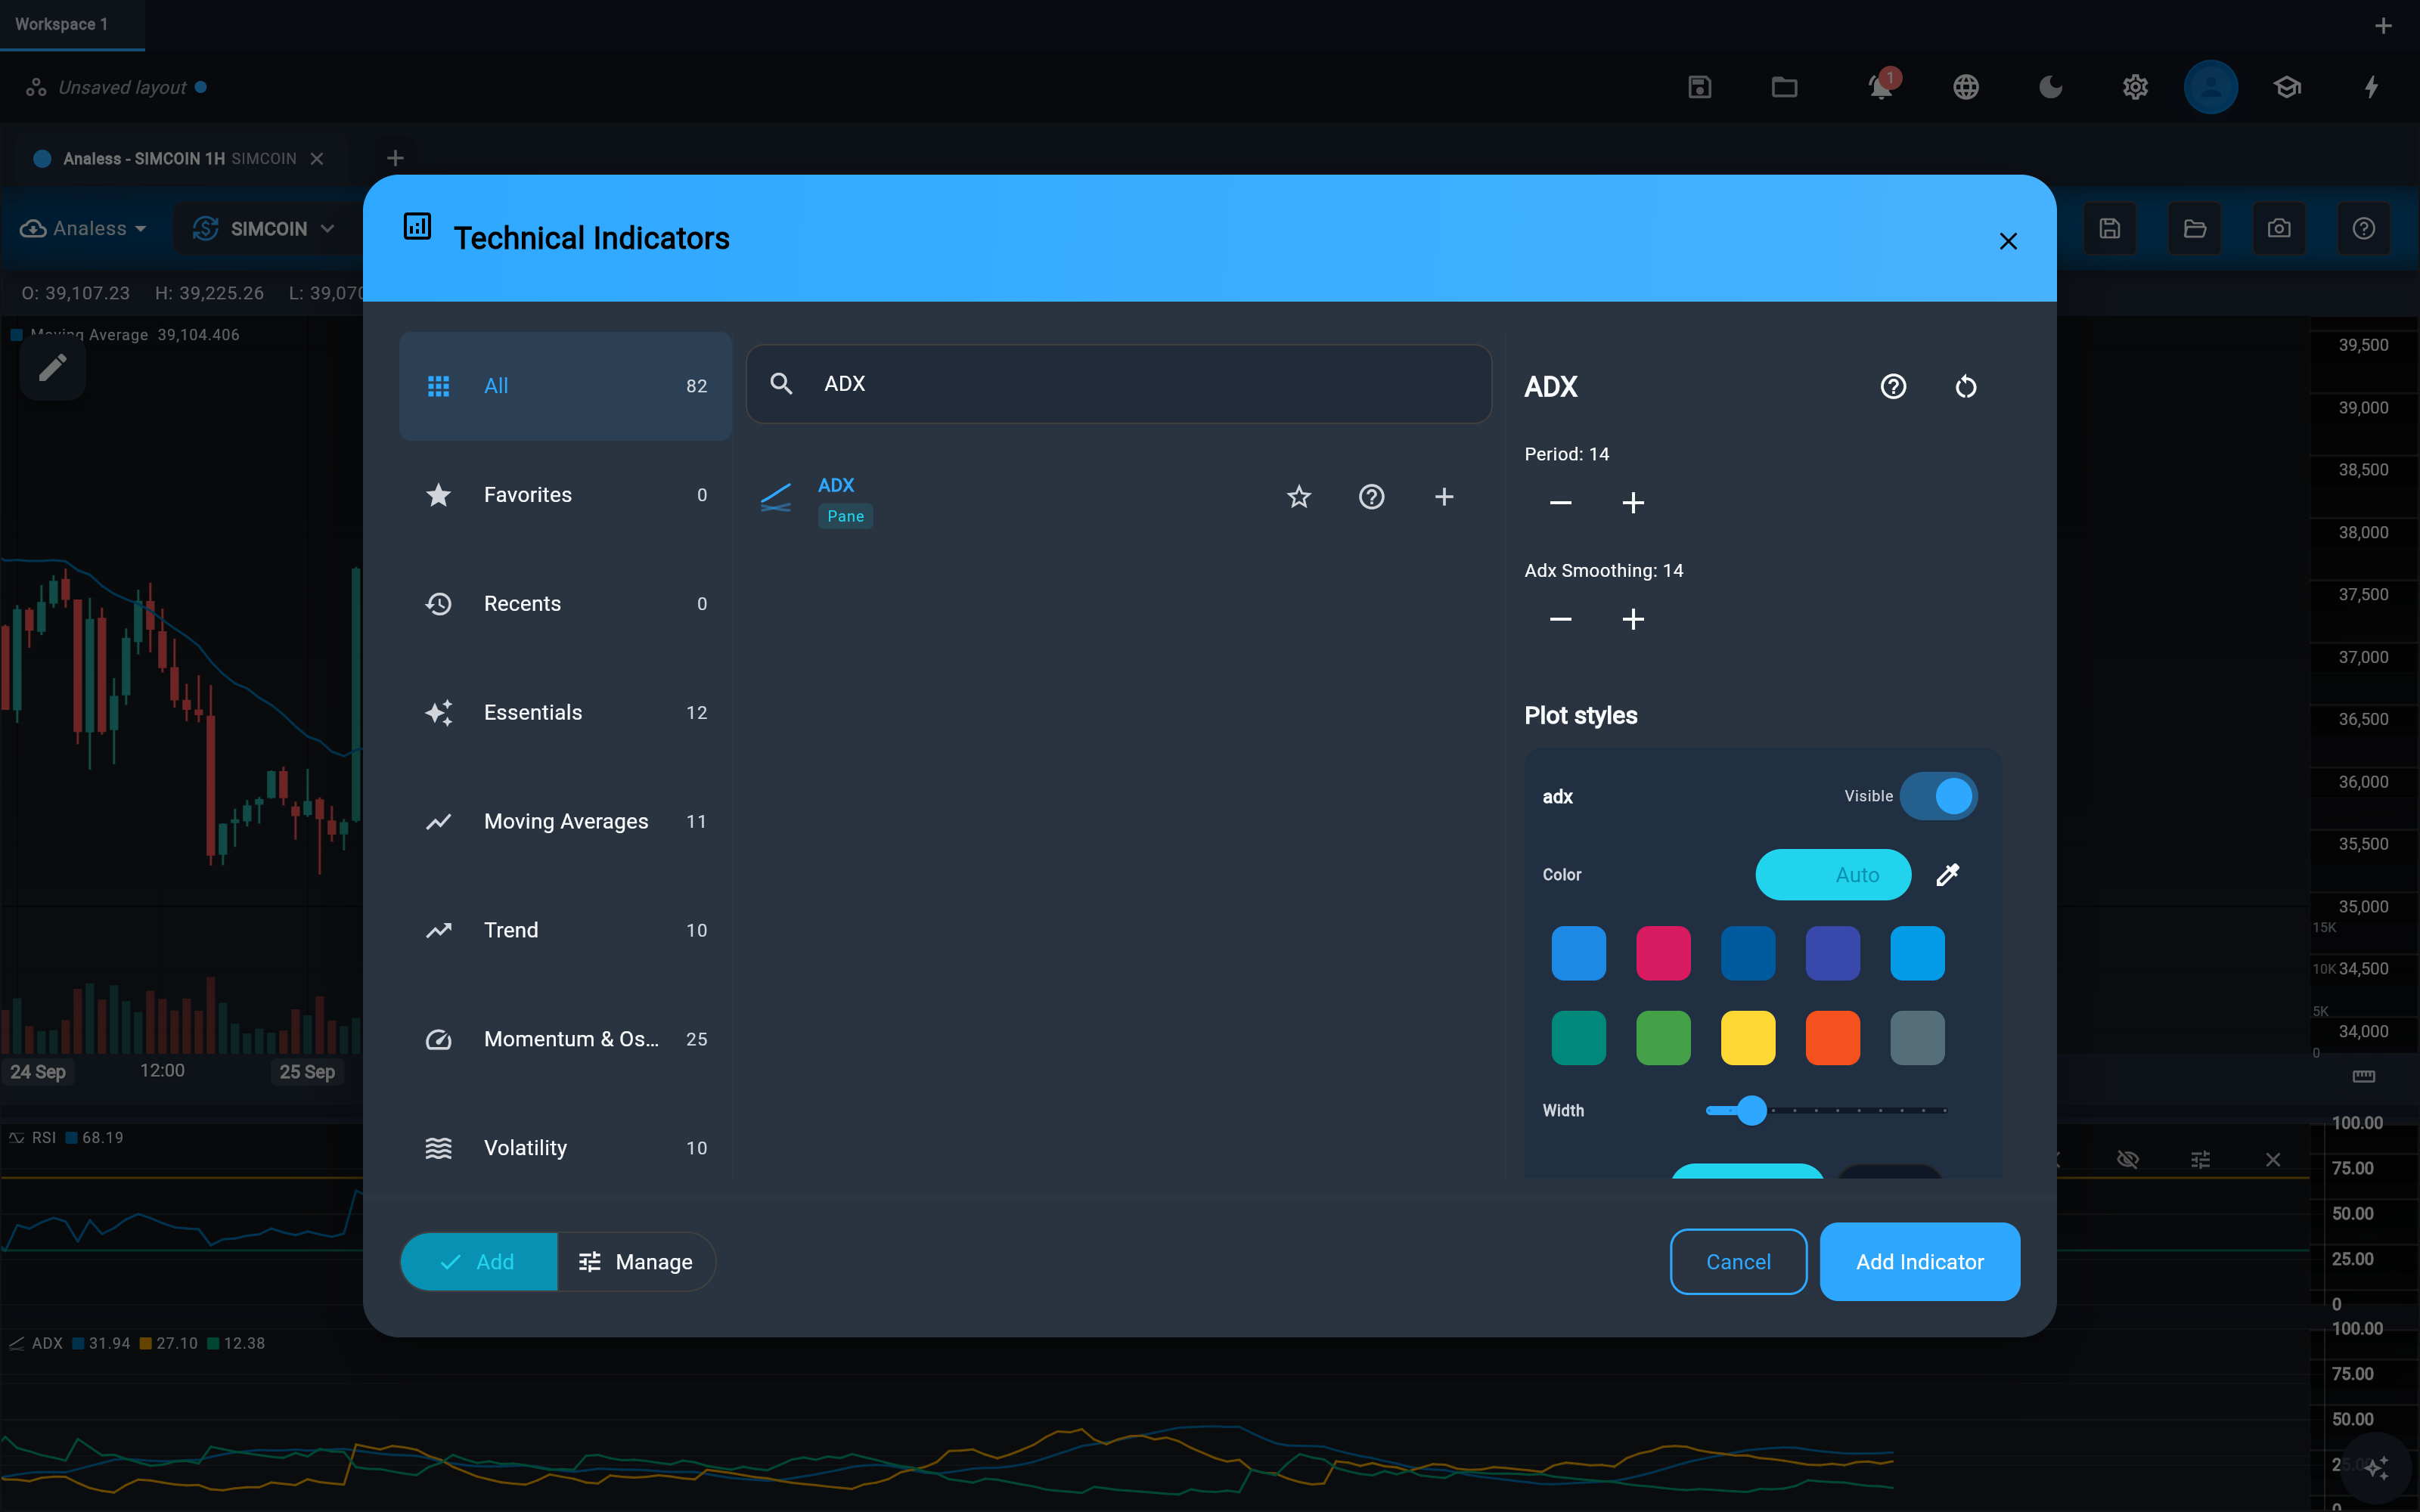
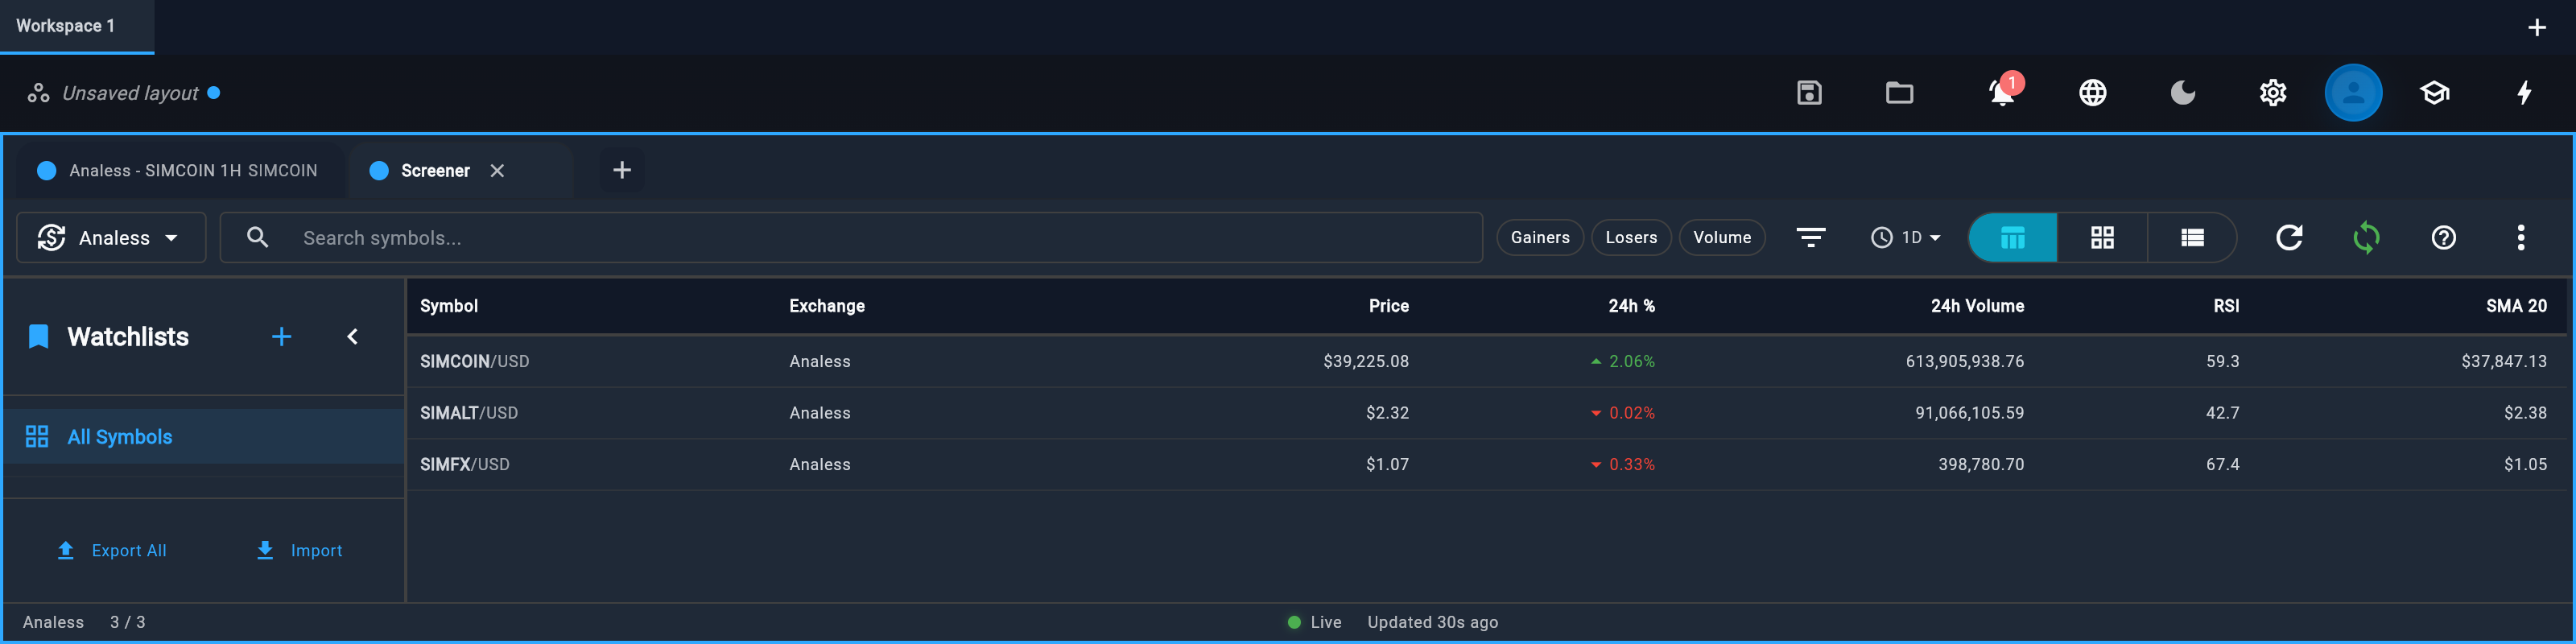
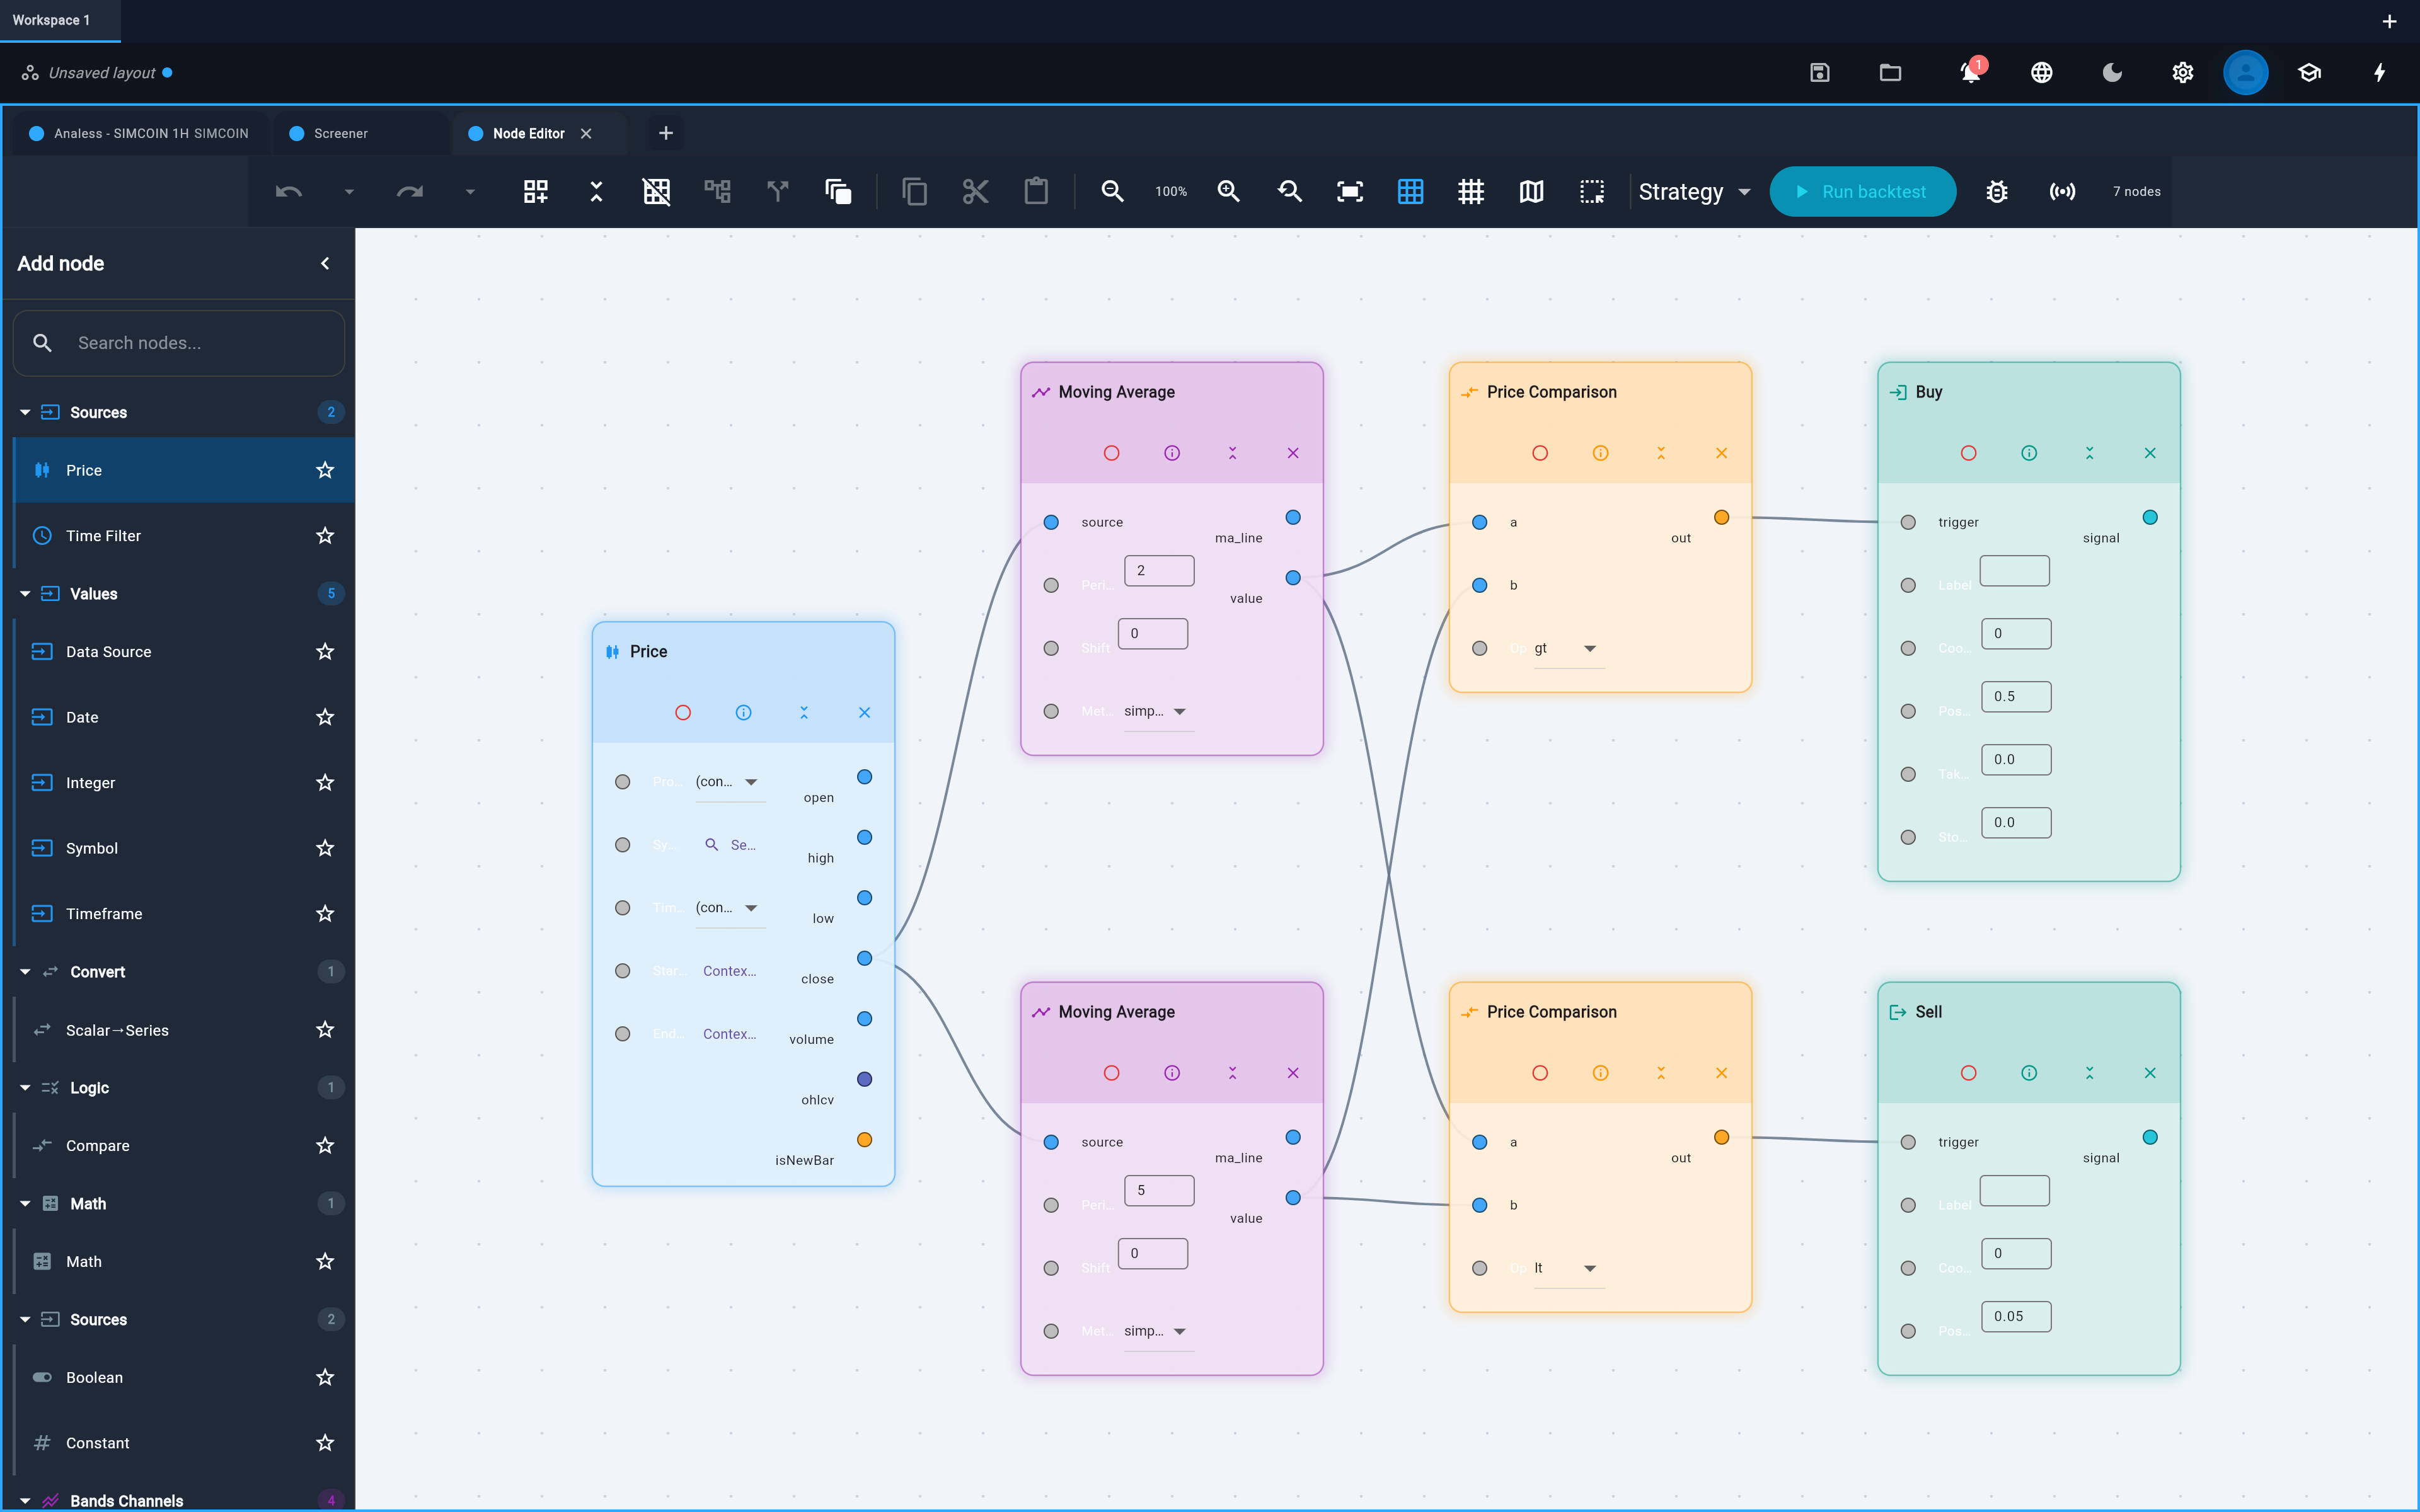
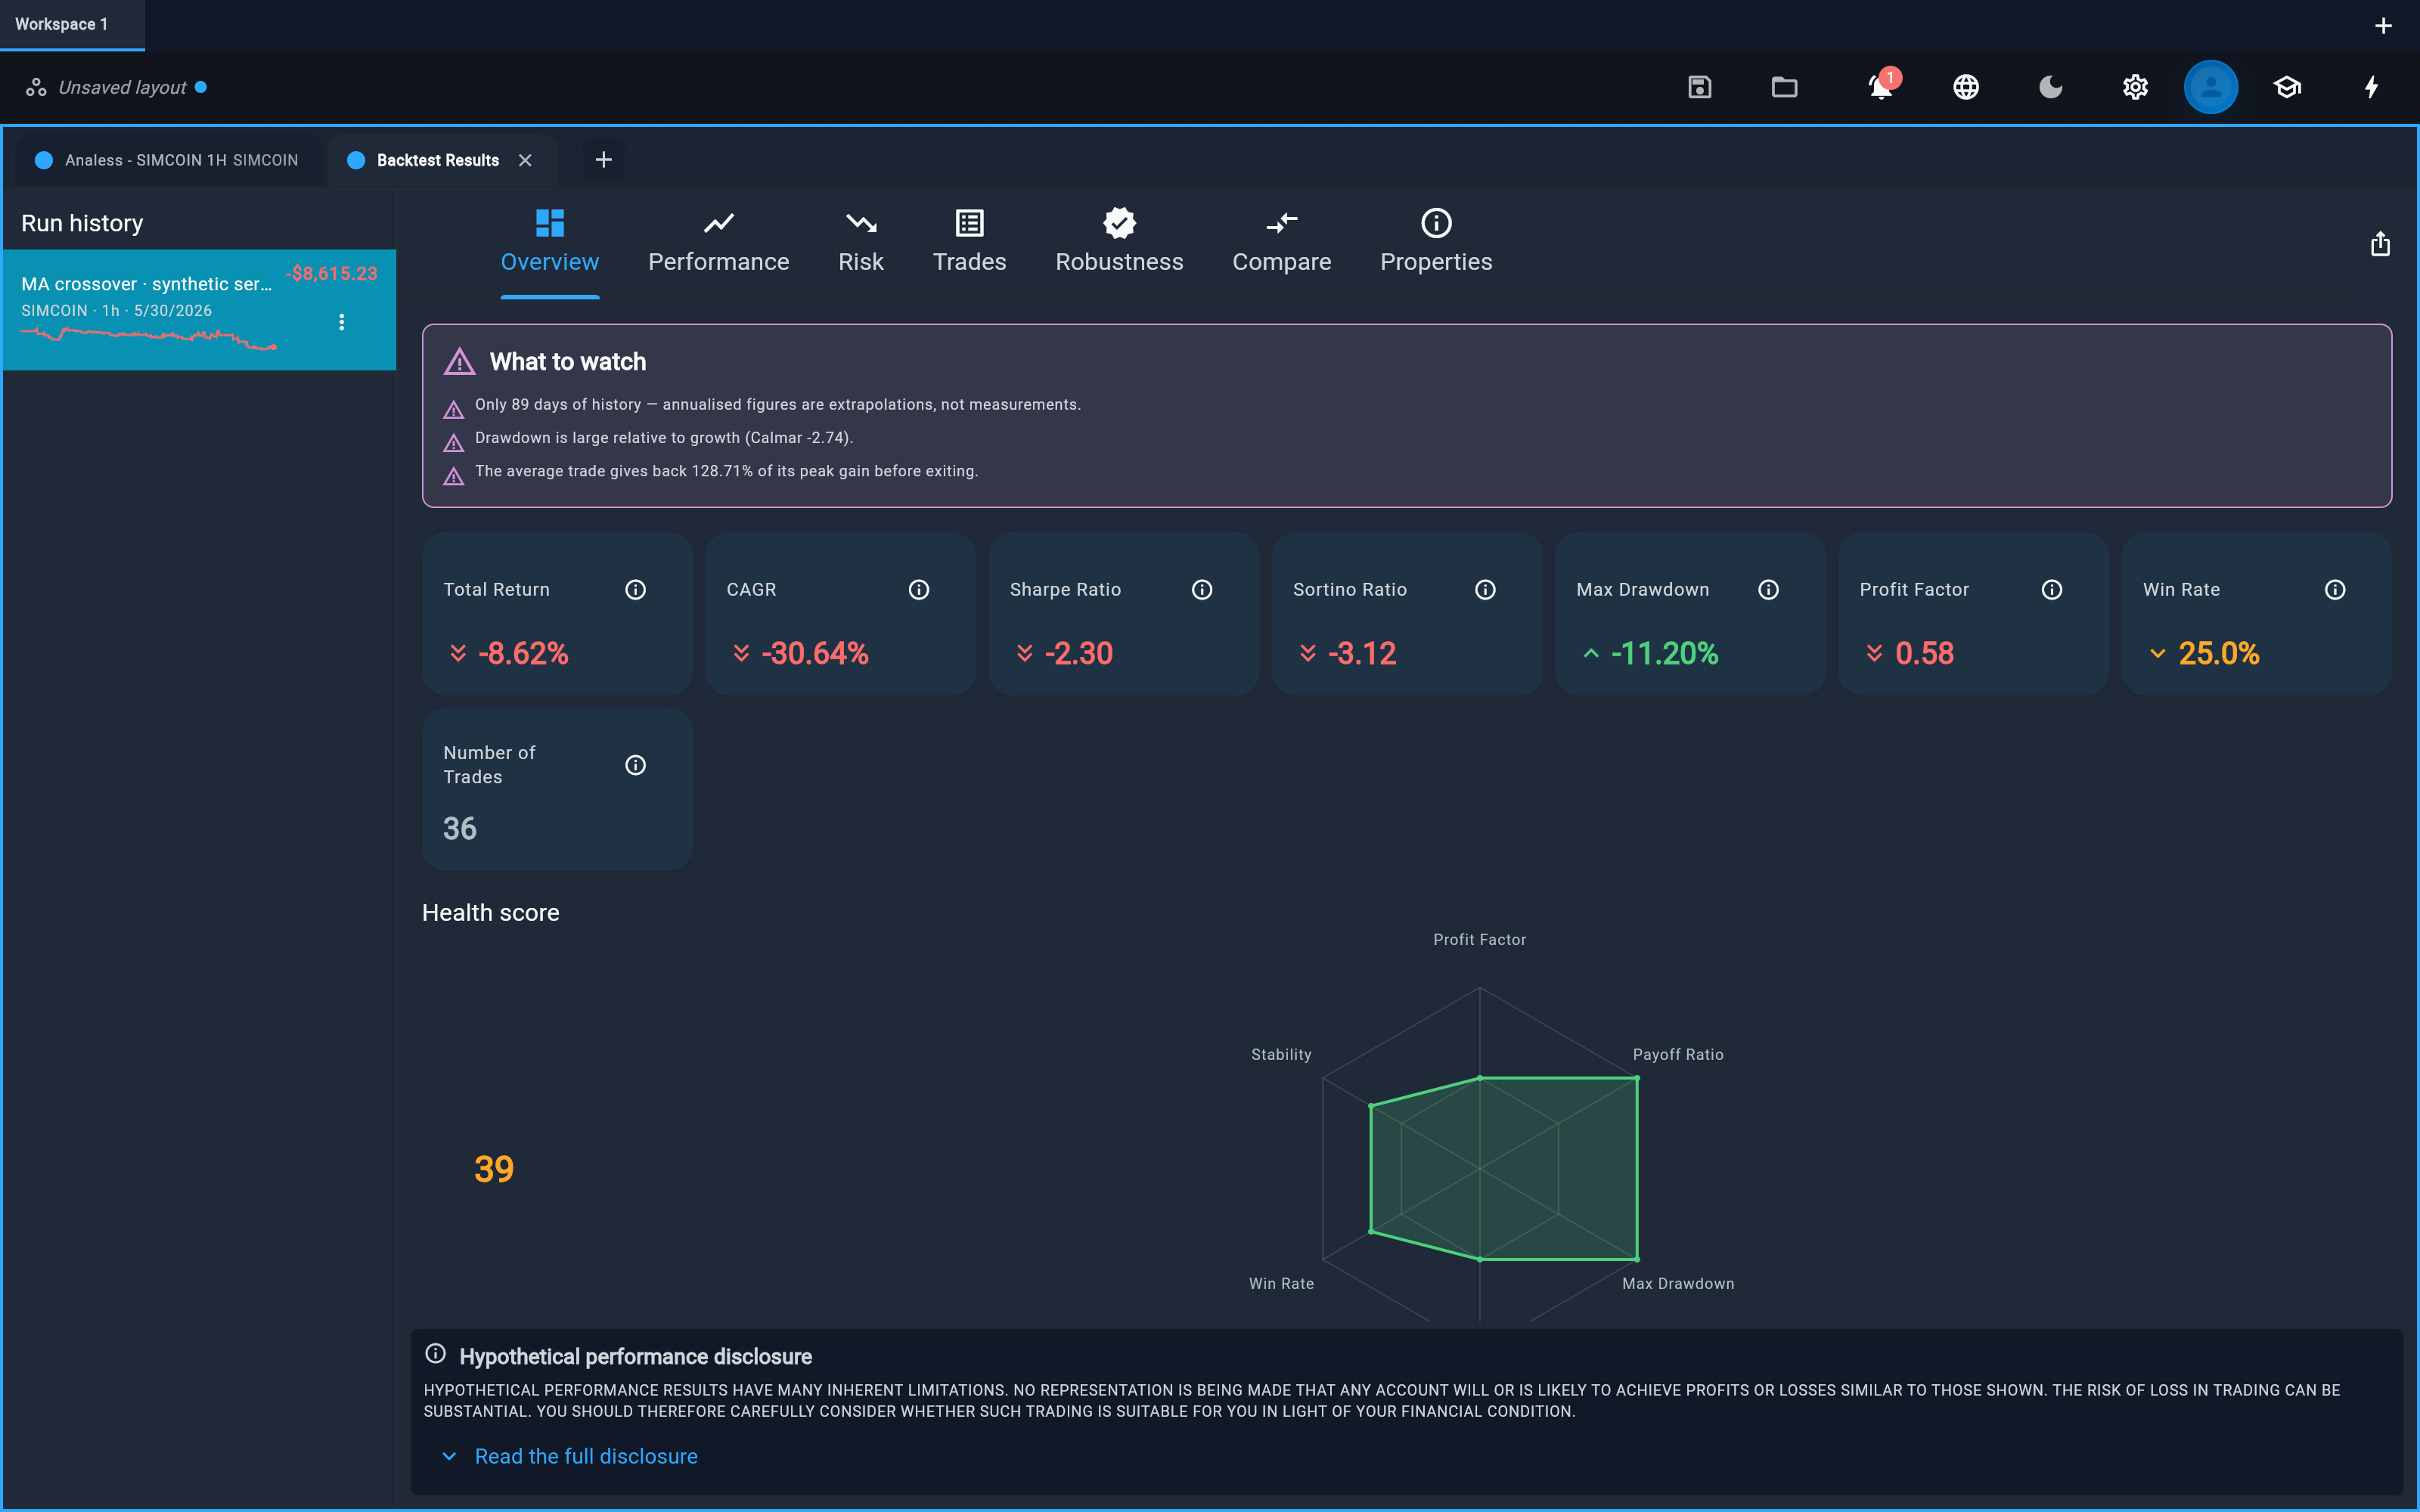
The chart is a working surface for the wider research engine. The same graph drives chart studies, screening and backtests: develop a rule on a chart, apply it across supported markets, then inspect its historical run in one workbench. Indicators, drawings and bar-by-bar replay stay part of that connected workflow.