















Indicators · Statistical
Linear Regression Slope
The slope of the best-fit line — the direction and steepness of the trend.
Origin: Method of least squares—Legendre, 1805; Gauss, 1809
- Best suited to
- Trending markets
- Responsiveness
- Lagging
- Family
- Statistical
What it is
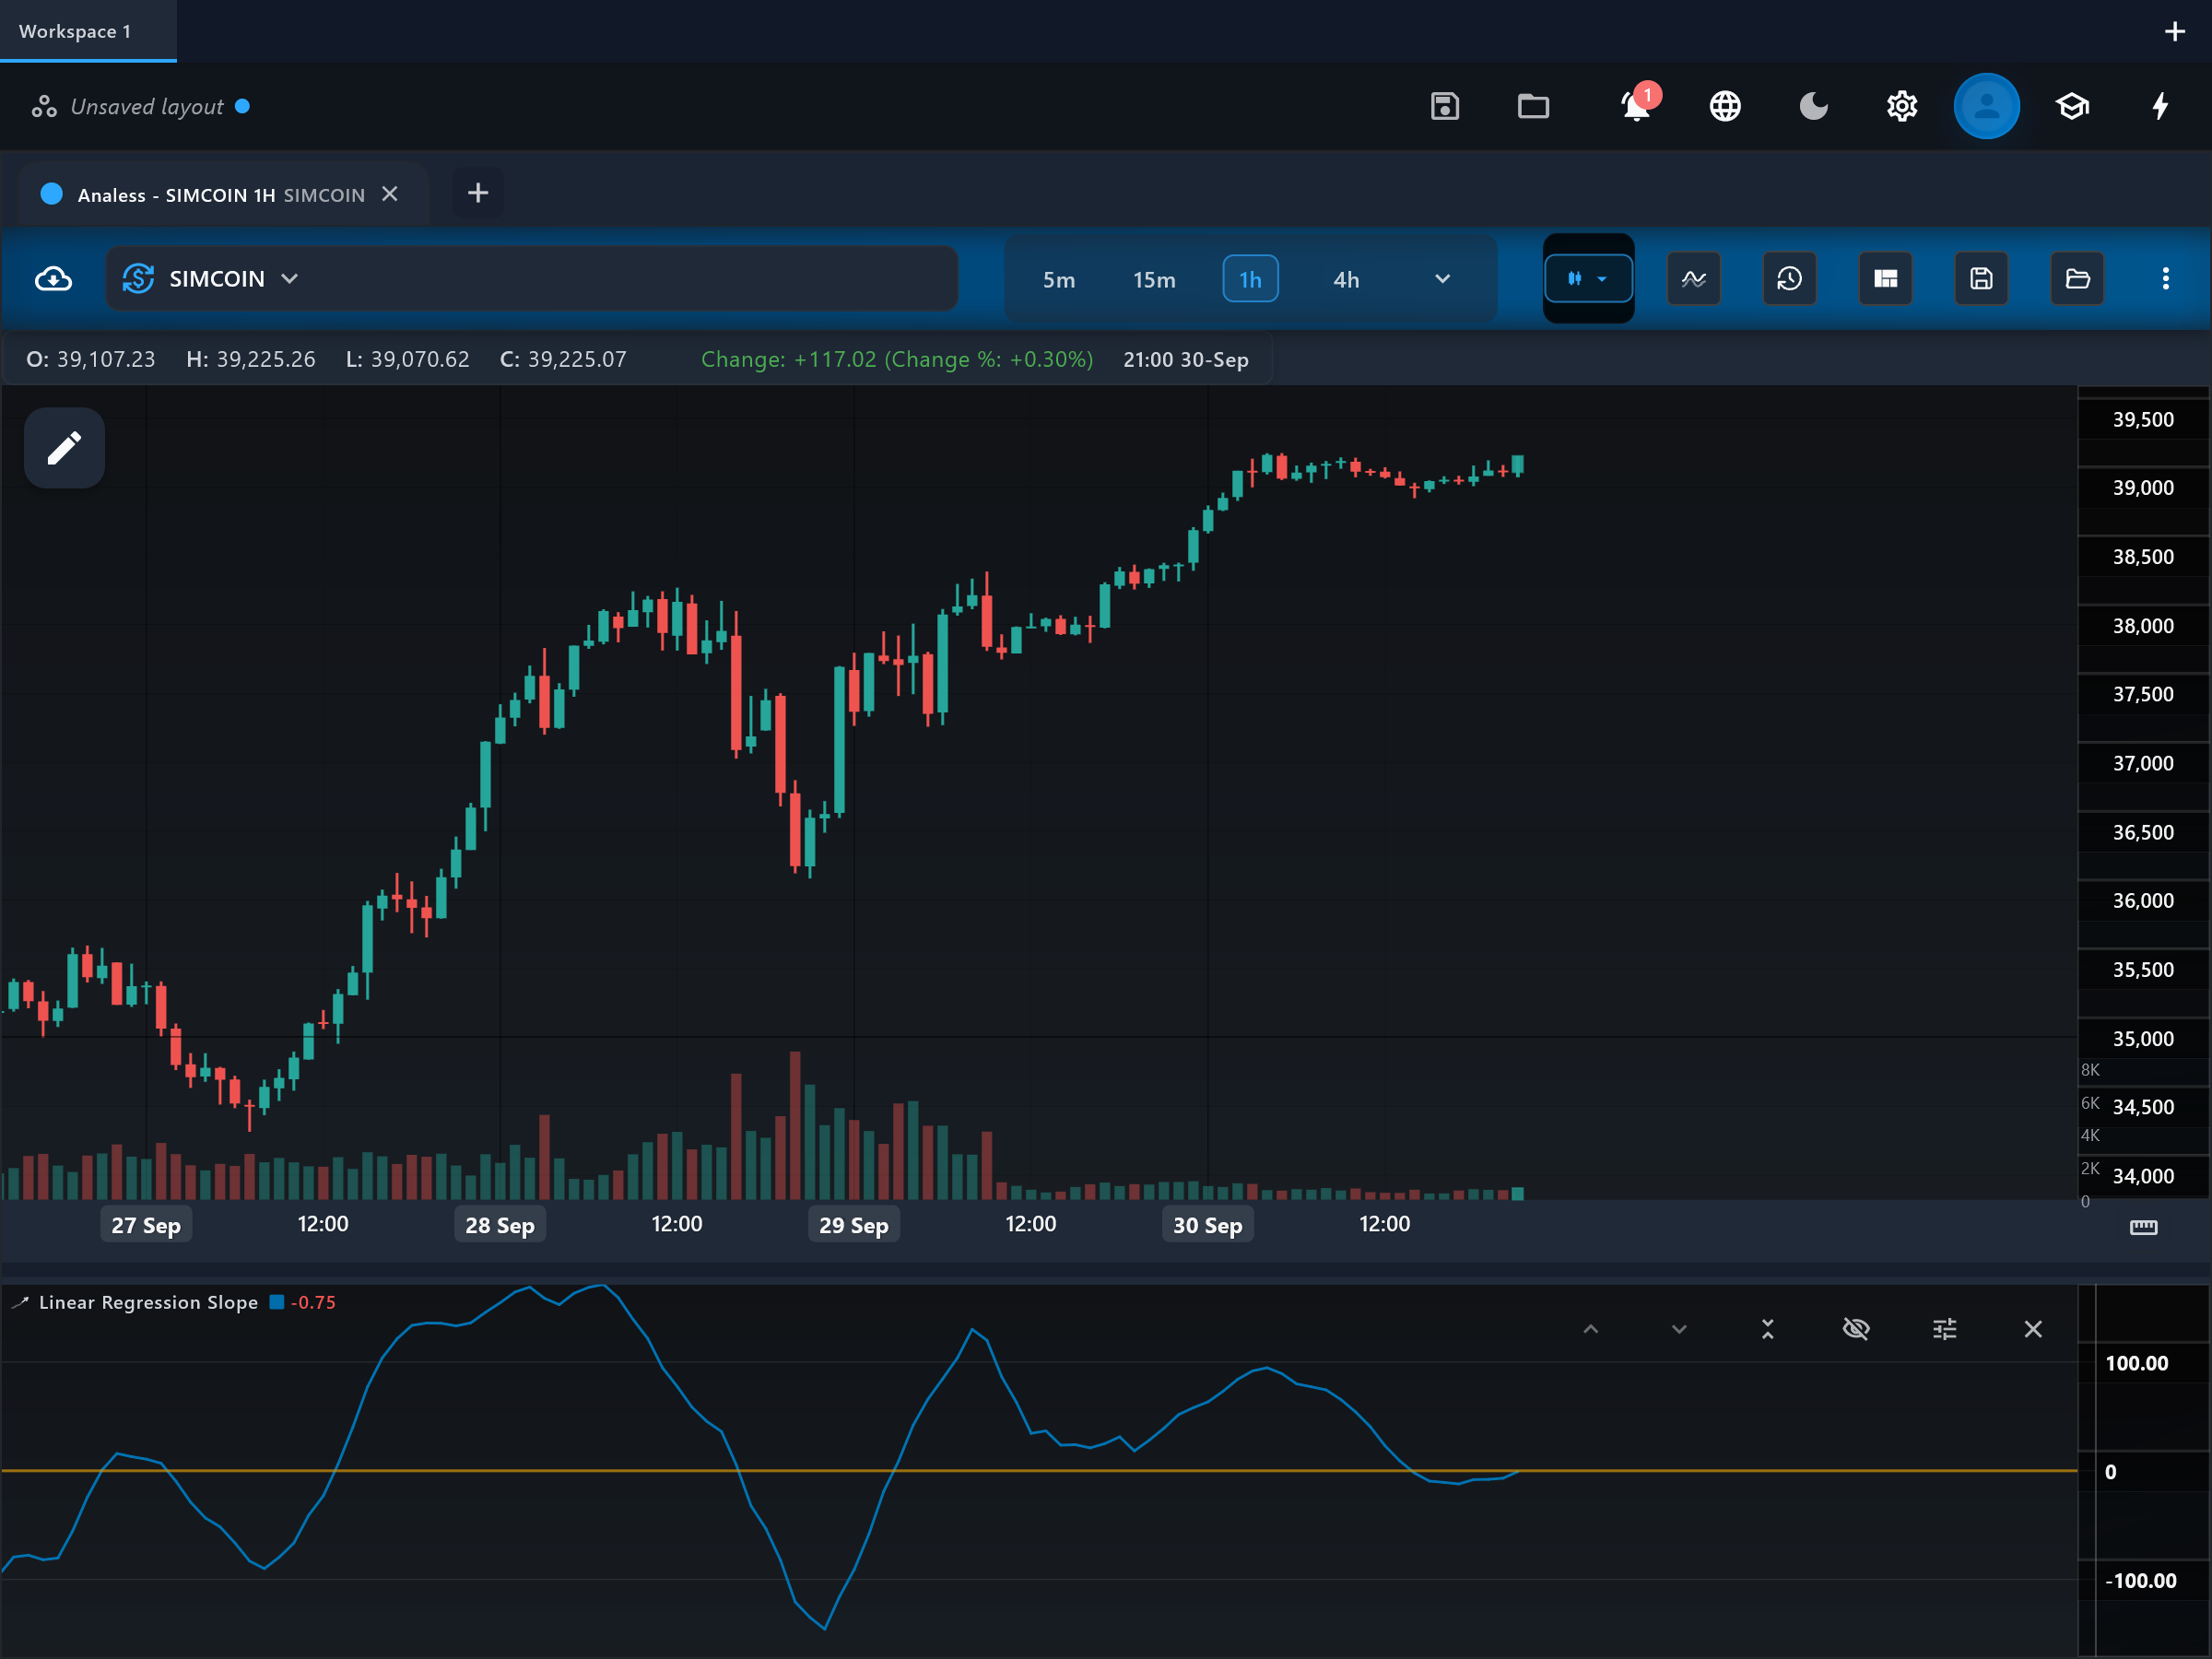
Linear Regression Slope plots the steepness of the least-squares line fitted through the last N prices, as an oscillator in its own pane. Instead of showing where the trend line is, it shows how fast the trend is rising or falling — a direct "momentum of the trend" reading.
How it is calculated
Each bar, the app fits an ordinary least-squares line through the last period values of the selected source and outputs the line's slope in price units per bar. A positive value means the best-fit trend over the window is rising; a negative value means it is falling; the magnitude is the average price change per bar implied by the fit. The series is drawn as slope_line around a fixed zero_line guide.
How to read it
slope_line above zero_line means the fitted trend is up; below zero means it is down. The distance from zero is trend speed: a climbing slope_line shows an accelerating advance, while a slope_line that is still positive but falling shows an uptrend losing steam — often the earliest visible warning. The zero cross itself is the moment the fitted trend flips direction. Because slope is measured in price units per bar, its absolute scale differs between symbols; compare it to its own recent history, not across charts.
What to look for
- Centre-line crossUpside
slope_line crossing above zero_line marks the fitted trend turning upward — a trend-flip signal.
- Centre-line crossDownside
slope_line crossing below zero_line marks the fitted trend turning downward.
- Trend filterContext
The sign of slope_line is a clean trend filter for other signals: take longs only while it is positive, shorts only while it is negative.
- DivergenceContext
Price making new extremes while slope_line flattens toward zero shows the trend decelerating even as price stretches — a caution flag.
When to use it
The slope reads best on markets that develop sustained trends — indices, large-cap stocks, and trending crypto — on swing timeframes and above. It is a natural companion filter for crossover and breakout systems. In tight ranges the slope hovers around zero and crosses it constantly, so avoid trading zero crosses on their own in sideways conditions.
Works well with
Settings explained
period- How many bars the line is fitted through, default 14. Longer periods measure the slope of the larger trend and cross zero rarely; shorter periods react quickly but flip sign on minor pullbacks.
source- The price series the fit uses, default close. Averaged sources like hl2 or hlc3 make the slope slightly steadier by softening single-bar extremes.
Limitations and common mistakes
- Like any fitted-window measure it lags turns: the slope only goes negative after enough falling bars have entered the window.
- Zero crosses whipsaw badly in ranges — the fitted trend of a sideways market is near-flat, so tiny wobbles flip the sign.
- The value is in price units per bar, so its magnitude is not comparable between symbols or timeframes without normalizing.
References
- Origin: Method of least squares—Legendre, 1805; Gauss, 1809.
- Simple linear regression — Wikipedia (opens in a new tab)
This page explains how an indicator is calculated and read. It describes past data, not what price will do next, and it is not a recommendation to trade. Read the disclaimers.
Try it in Analess
Add Linear Regression Slope to any chart, adjust its settings, and open this explainer from the indicator itself.