















Indicators · Momentum & oscillators
MACD
The gap between a fast and slow average, with a signal line and histogram showing momentum.
Origin: Gerald Appel, 1970s; histogram by Thomas Aspray, 1986
- Best suited to
- Trending markets
- Responsiveness
- Lagging
- Family
- Momentum & oscillators
What it is
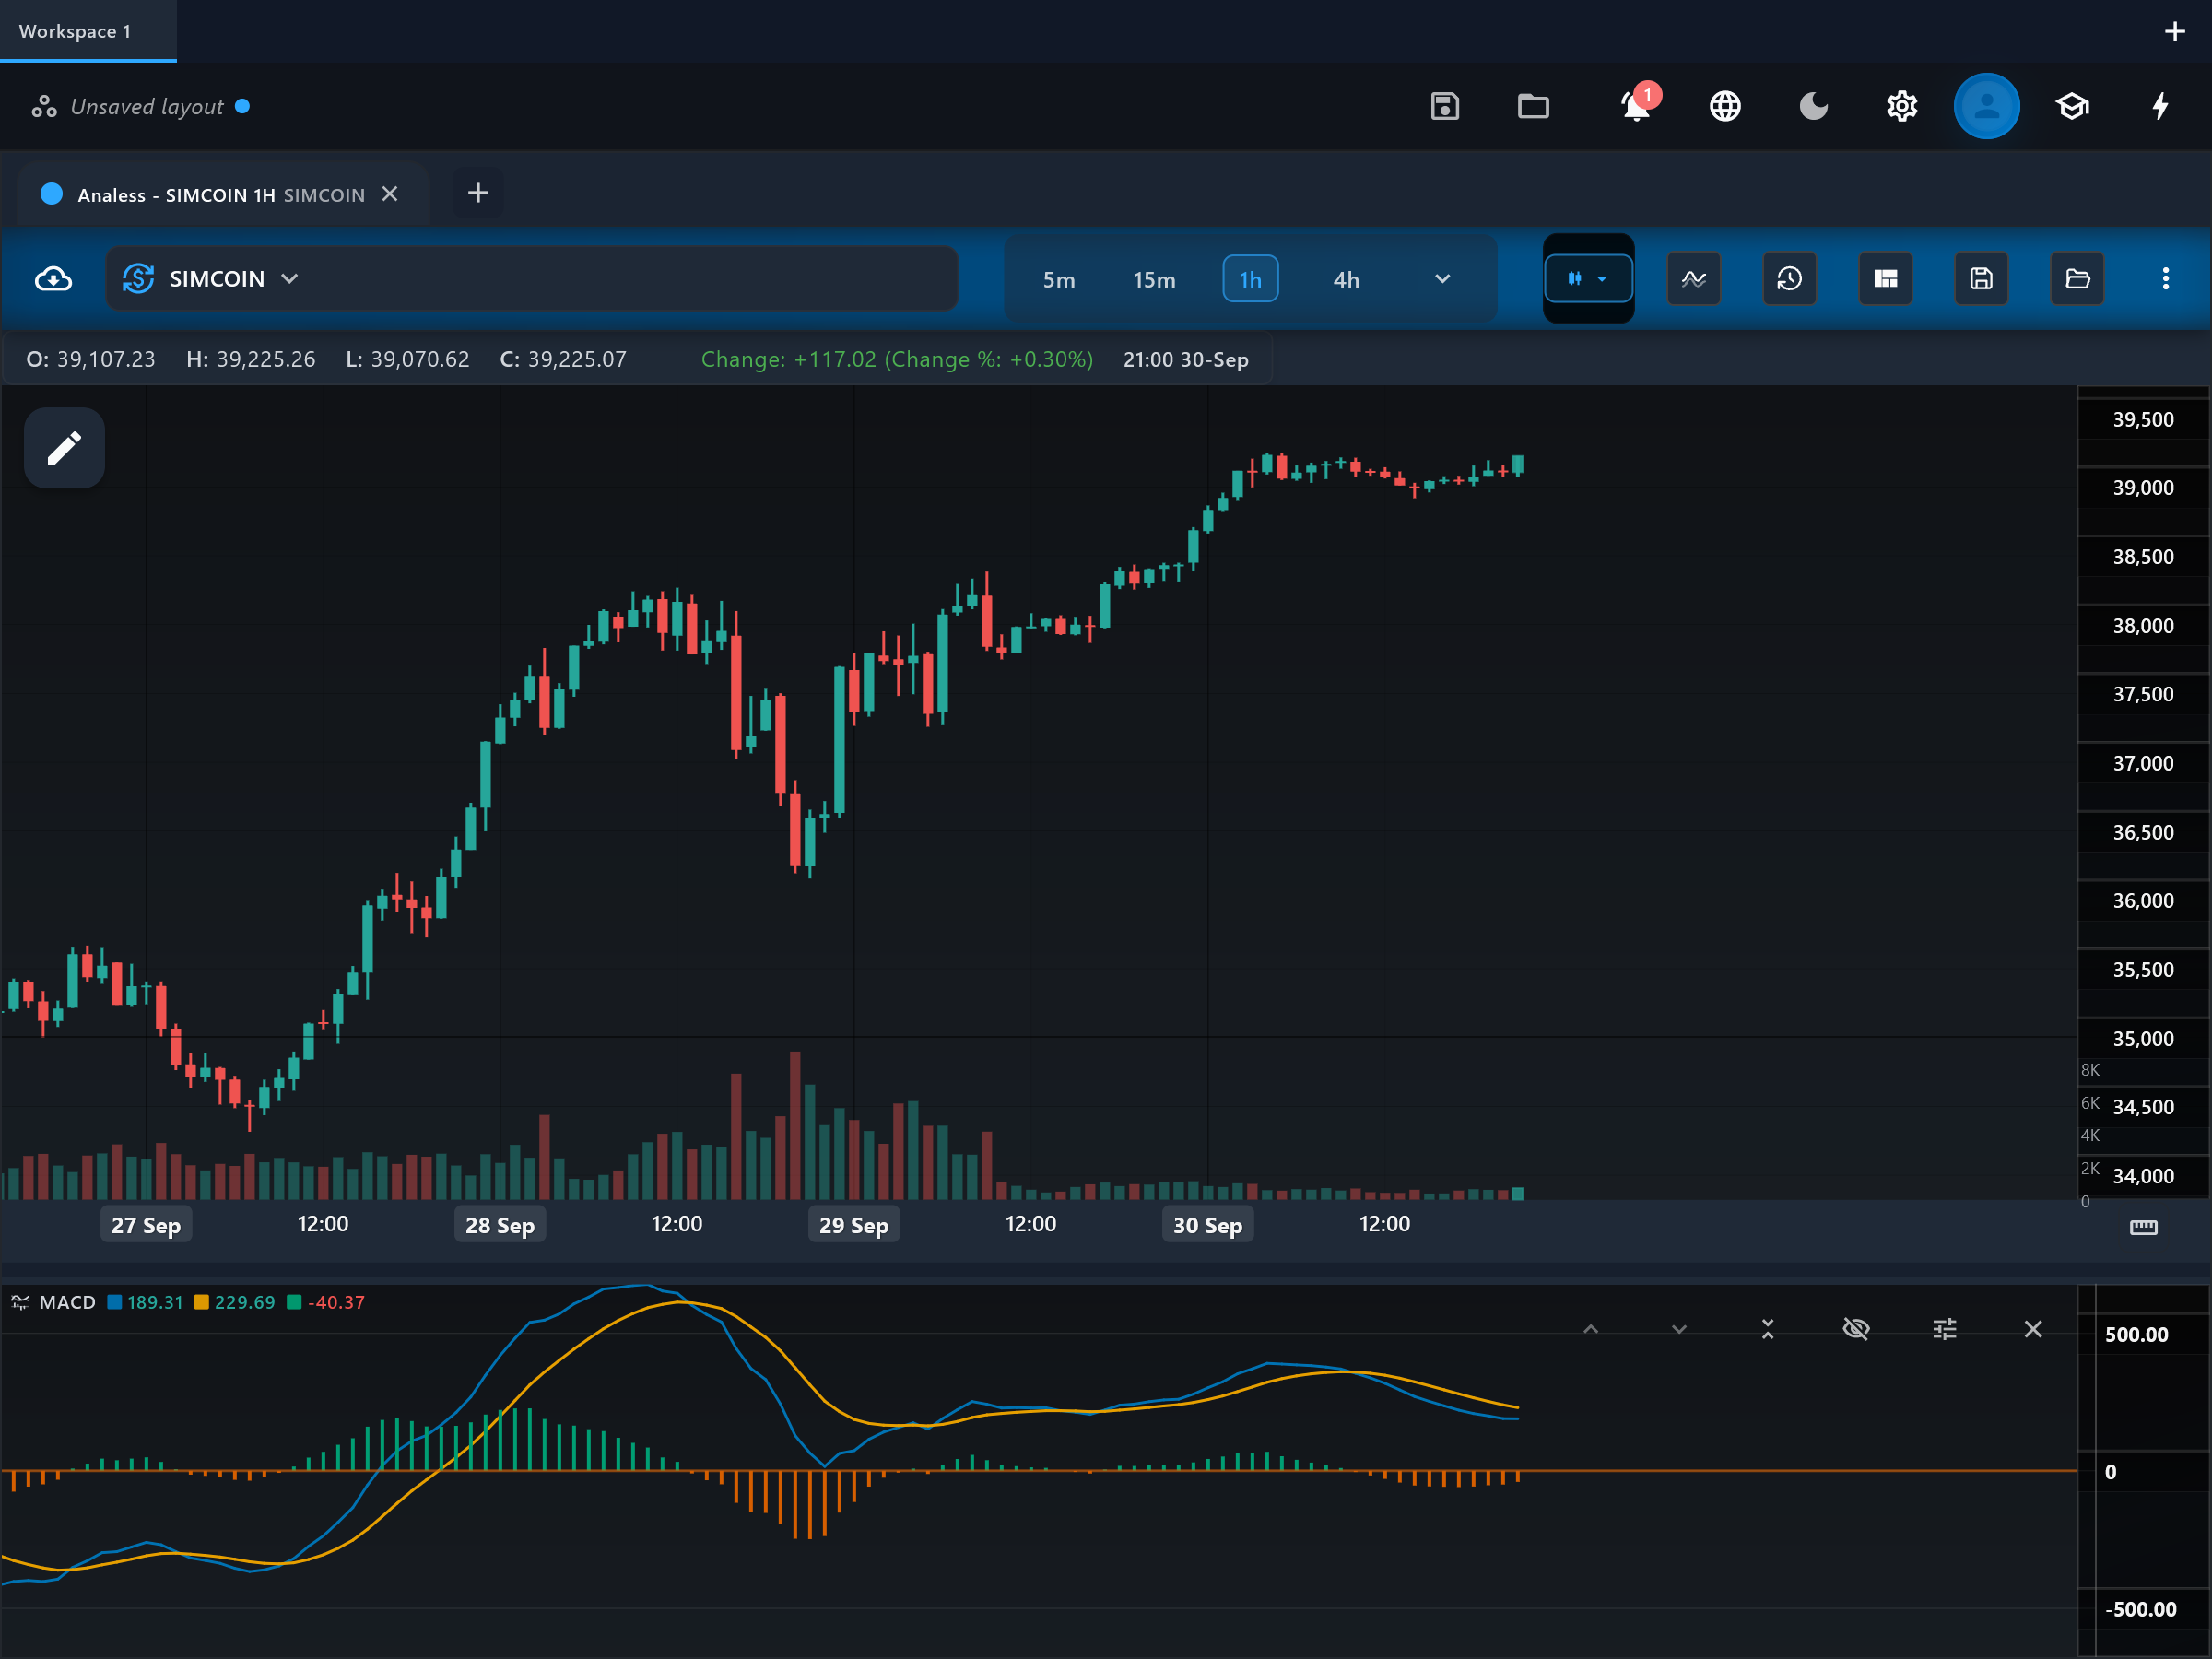
MACD (Moving Average Convergence Divergence) tracks the gap between a fast and a slow exponential moving average of price. It blends trend-following and momentum in one pane: the gap widens as a move accelerates and narrows as it fades. It is unbounded, so it has no fixed overbought or oversold levels.
How it is calculated
MACD line = EMA(fast) - EMA(slow) of the chosen source (defaults 12 and 26). The signal line is an EMA of the MACD line (default 9), and the histogram is MACD minus signal. When the fast EMA pulls away from the slow EMA the MACD line grows; when they converge it shrinks toward zero.
How to read it
The pane shows the "macd_line", the "signal" line, the "histogram" bars, and a "zero" reference line. The macd_line above zero means the fast EMA is above the slow EMA (bullish alignment); below zero the reverse. The histogram visualizes the distance between macd_line and signal — bars shrinking toward zero warn that a cross of the two lines is approaching. Rising histogram bars show momentum building; falling bars show it fading.
What to look for
- Signal-line crossUpside
macd_line crossing above the signal line (histogram flipping positive) indicates short-term momentum turning up.
- Signal-line crossDownside
macd_line crossing below the signal line (histogram flipping negative) indicates short-term momentum turning down.
- Centre-line crossContext
macd_line crossing the zero line marks the fast EMA crossing the slow EMA — a slower, trend-level shift in direction.
- DivergenceContext
Divergence between price extremes and macd_line extremes (e.g. higher price high with a lower MACD high) warns the trend is losing momentum.
When to use it
MACD is best in markets that actually trend — indices, large-cap stocks, major crypto and FX pairs — on swing and position timeframes, where its crosses catch the meat of a move. In sideways, choppy conditions the two EMAs hug each other and crosses whipsaw repeatedly around zero. Since it is unbounded, do not read its height as overbought or oversold; compare it only to its own recent history.
Works well with
Settings explained
fastPeriod- Default 12 — the fast EMA. Lowering it makes the macd_line react sooner but whipsaw more; raising it slows the whole indicator.
slowPeriod- Default 26 — the slow EMA baseline. A wider fast/slow gap emphasizes bigger trends; narrowing the gap makes MACD hover near zero and cross more often.
signalPeriod- Default 9 — the EMA of the macd_line. Lower values give earlier but noisier signal-line crosses; higher values delay them but filter chop.
source- Default close — the price series both EMAs are computed from.
Limitations and common mistakes
- It is built from moving averages, so every signal arrives after the turn has begun — expect lag.
- In ranging markets signal-line crosses whipsaw badly around the zero line.
- The value is unbounded and scale-dependent, so levels cannot be compared across symbols or timeframes.
References
- Origin: Gerald Appel, 1970s; histogram by Thomas Aspray, 1986.
- MACD — Wikipedia (opens in a new tab)
This page explains how an indicator is calculated and read. It describes past data, not what price will do next, and it is not a recommendation to trade. Read the disclaimers.
Try it in Analess
Add MACD to any chart, adjust its settings, and open this explainer from the indicator itself.