















Indicators · Statistical
Linear Regression
Fits a straight line of best fit through price over a period.
Origin: Method of least squares—Legendre, 1805; Gauss, 1809
- Best suited to
- Trending markets
- Responsiveness
- Lagging
- Family
- Statistical
What it is
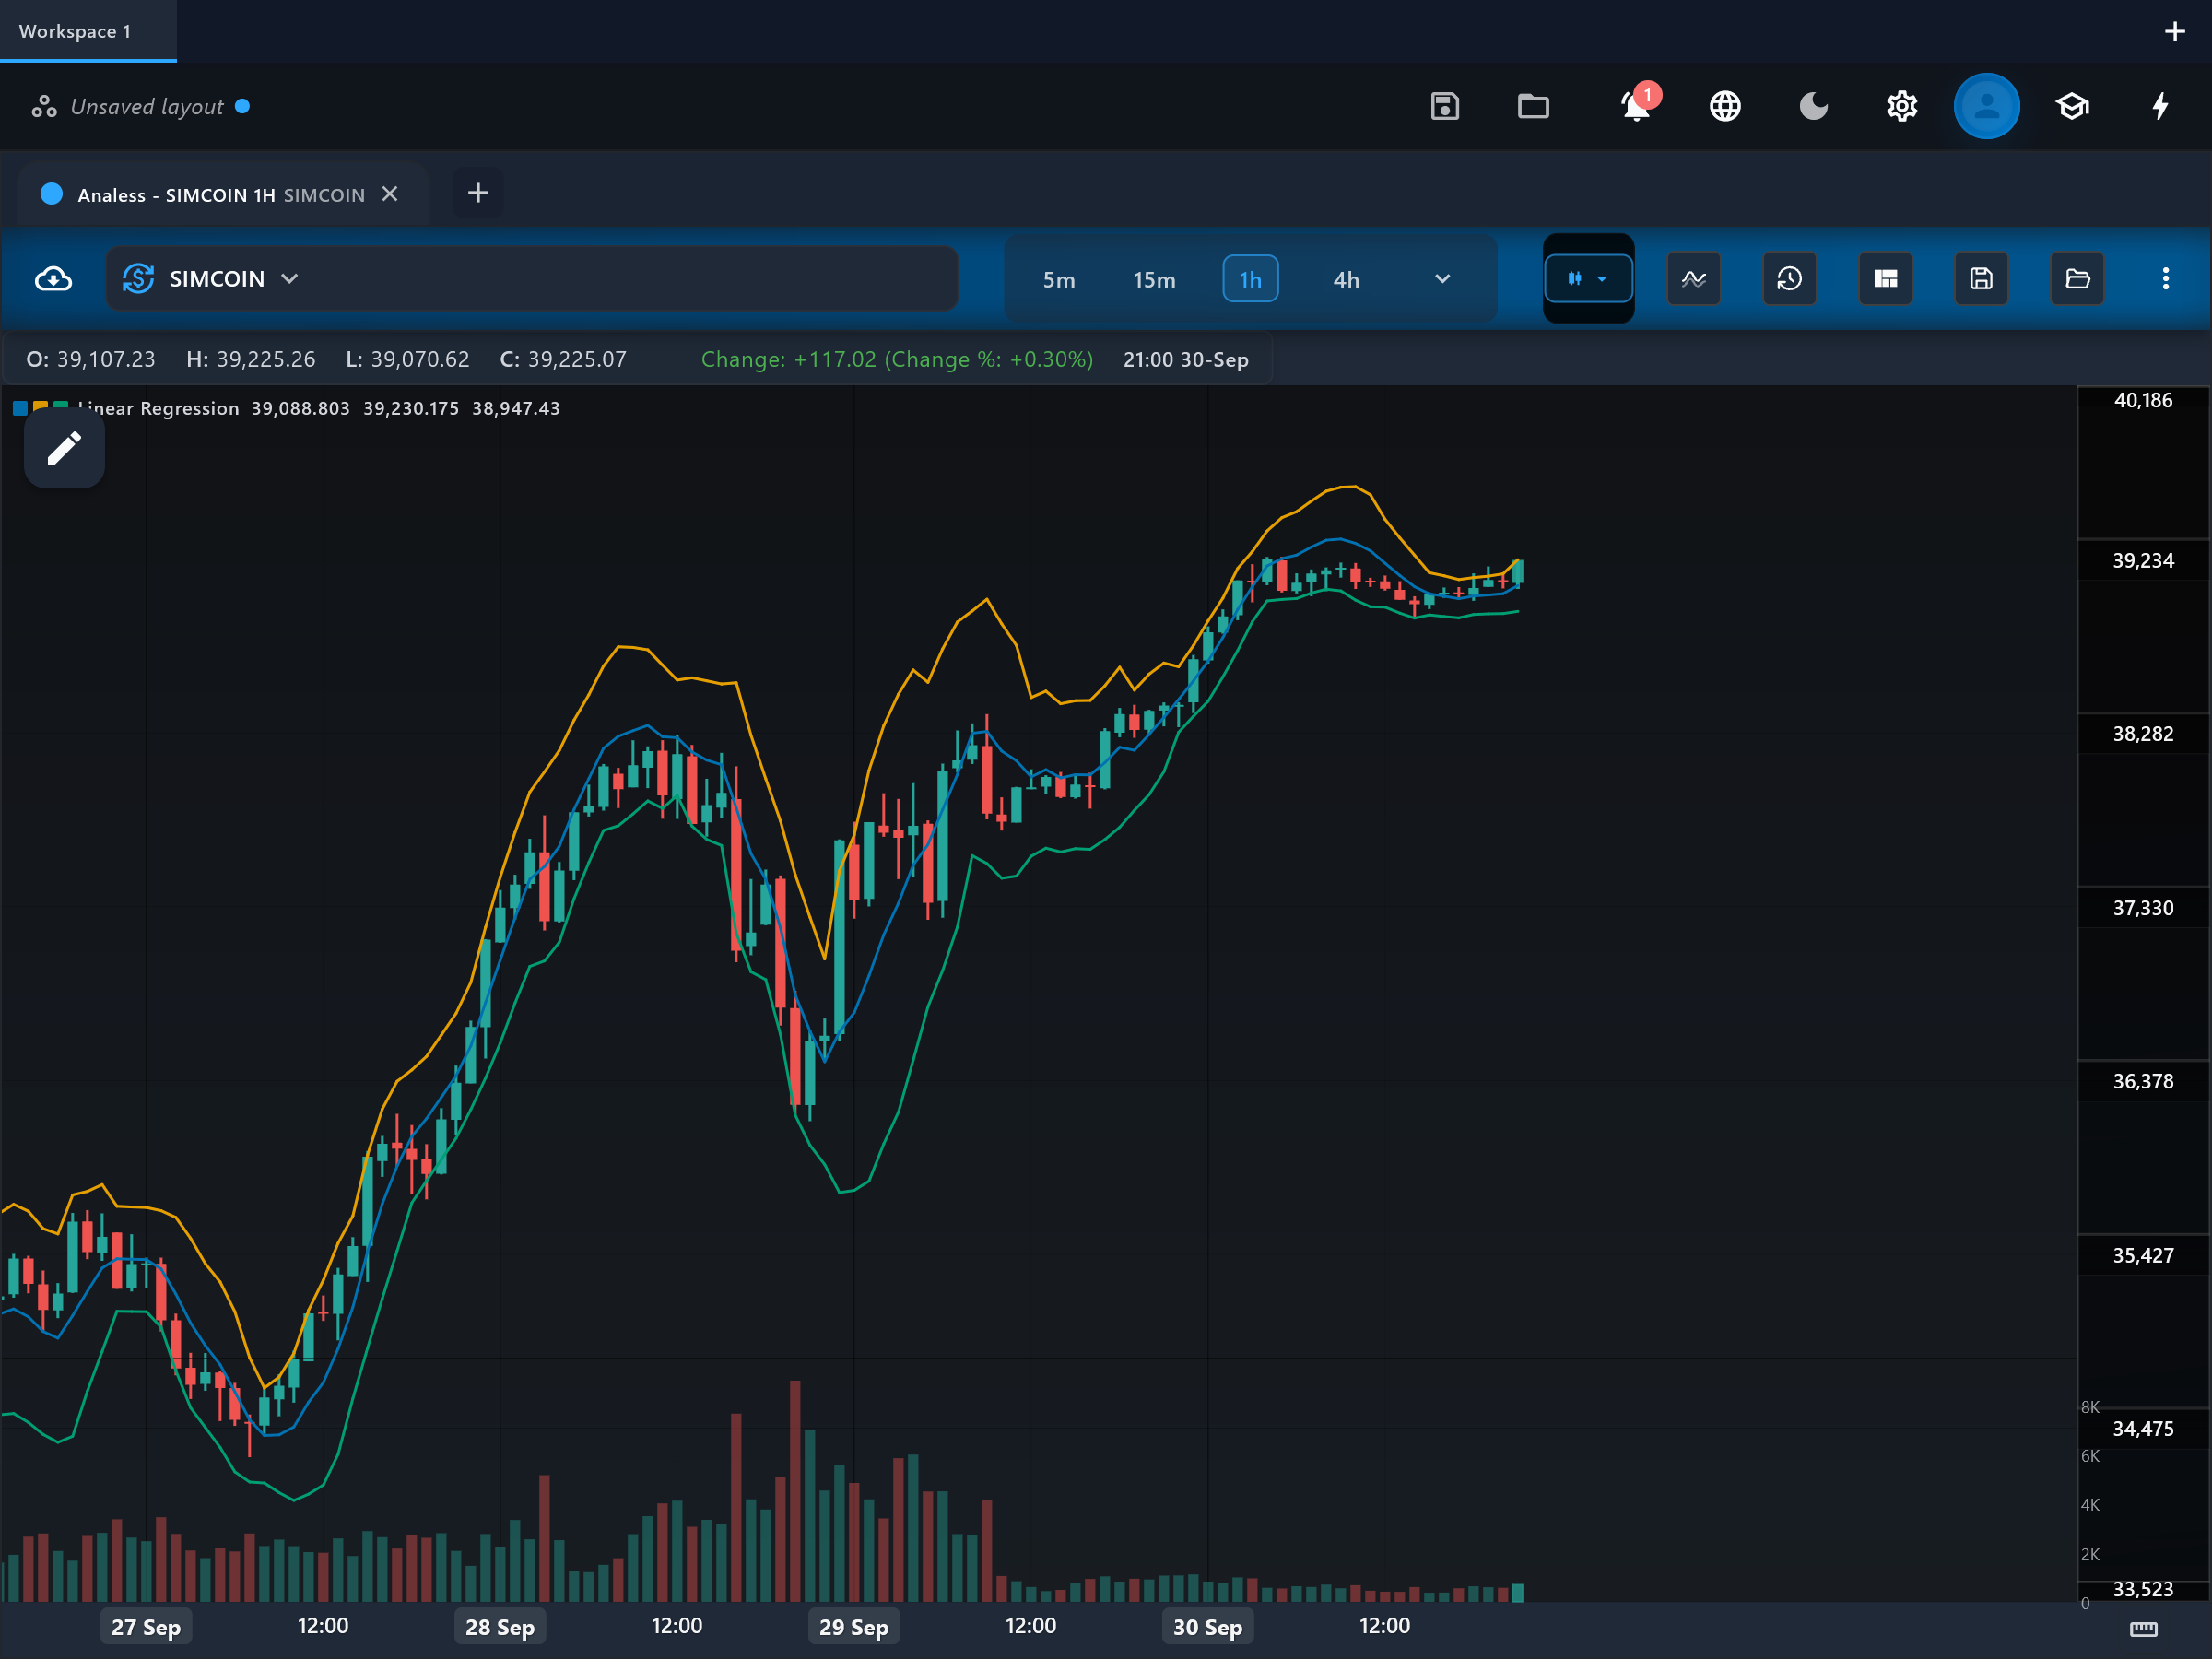
Linear Regression fits a least-squares straight line through the last N prices and plots where that line ends on each bar, together with a channel placed a multiple of the standard error above and below it. It shows the statistical "fair value" path of recent price and how far price has strayed from it.
How it is calculated
For every bar the app takes the last period values of the selected source (close by default), computes the ordinary least-squares best-fit line through them, and plots the line's endpoint value — so the regression_line series is the rolling end of the fit, sometimes called the Linear Regression Curve. The upper_channel and lower_channel bands sit channelMultiplier standard errors away from the line, widening when price scatters loosely around the fit and tightening when it tracks the fit closely.
How to read it
regression_line traces the center of the recent price path: price above it is running ahead of its own short-term trend, price below it is lagging. The upper_channel and lower_channel bands frame the statistically normal zone — touches of the outer bands mark stretched conditions that often revert toward the line while the trend is flat or mild. The slope of regression_line itself shows trend direction, and the channel width shows how orderly the move is. Sustained closes outside a band suggest the fitted trend is being overpowered rather than just stretched.
What to look for
- Price crossContext
Price crossing back through regression_line after tagging a band is a mean-reversion cue toward the fitted trend.
- Range expansionUpside
Repeated closes above upper_channel show buying pressure strong enough to bend the fitted trend upward.
- Range expansionDownside
Repeated closes below lower_channel show the downside equivalent — the recent trend is being broken downward.
- Trend filterContext
The slope of regression_line is a simple trend filter: rising favors longs, falling favors shorts, flat suggests a range.
When to use it
Linear Regression suits liquid markets with orderly swings — large-cap stocks, index futures, and major forex pairs — on any timeframe with enough bars for the fit. The channel reads best in gently trending or ranging conditions where reversion to the line is common. Avoid leaning on it around news events and in violent breakouts: a straight-line fit adapts slowly when the trend bends sharply.
Works well with
Settings explained
period- How many bars the line is fitted through, default 14. Longer periods produce a smoother, slower line that captures the larger trend; shorter periods hug price but whip around in noise.
channelMultiplier- How many standard errors the channel bands sit from the line, default 2.0 (covering most normal scatter). Lower values give tighter bands and more frequent touches; higher values flag only extreme deviations.
source- The price series the line is fitted to, default close. Alternatives like hl2 or hlc3 smooth single-print extremes slightly; high or low bias the fit toward one side of each bar.
Limitations and common mistakes
- A straight line is only a local approximation — when the trend accelerates or reverses, the fit lags and the channel points the wrong way for several bars.
- Band touches are not automatic reversal signals: in a strong trend price can walk along one band while the line catches up.
- The endpoint recalculates from a fresh window every bar, so the plotted history is a series of fit endpoints — it will not match a single straight trendline drawn across the chart.
References
- Origin: Method of least squares—Legendre, 1805; Gauss, 1809.
- Linear regression — Wikipedia (opens in a new tab)
This page explains how an indicator is calculated and read. It describes past data, not what price will do next, and it is not a recommendation to trade. Read the disclaimers.
Try it in Analess
Add Linear Regression to any chart, adjust its settings, and open this explainer from the indicator itself.