















Indicators · Trend
ADX
Average Directional Index — measures how strong a trend is, regardless of direction.
Origin: J. Welles Wilder, 1978
- Best suited to
- Any market condition
- Responsiveness
- Lagging
- Family
- Trend
What it is
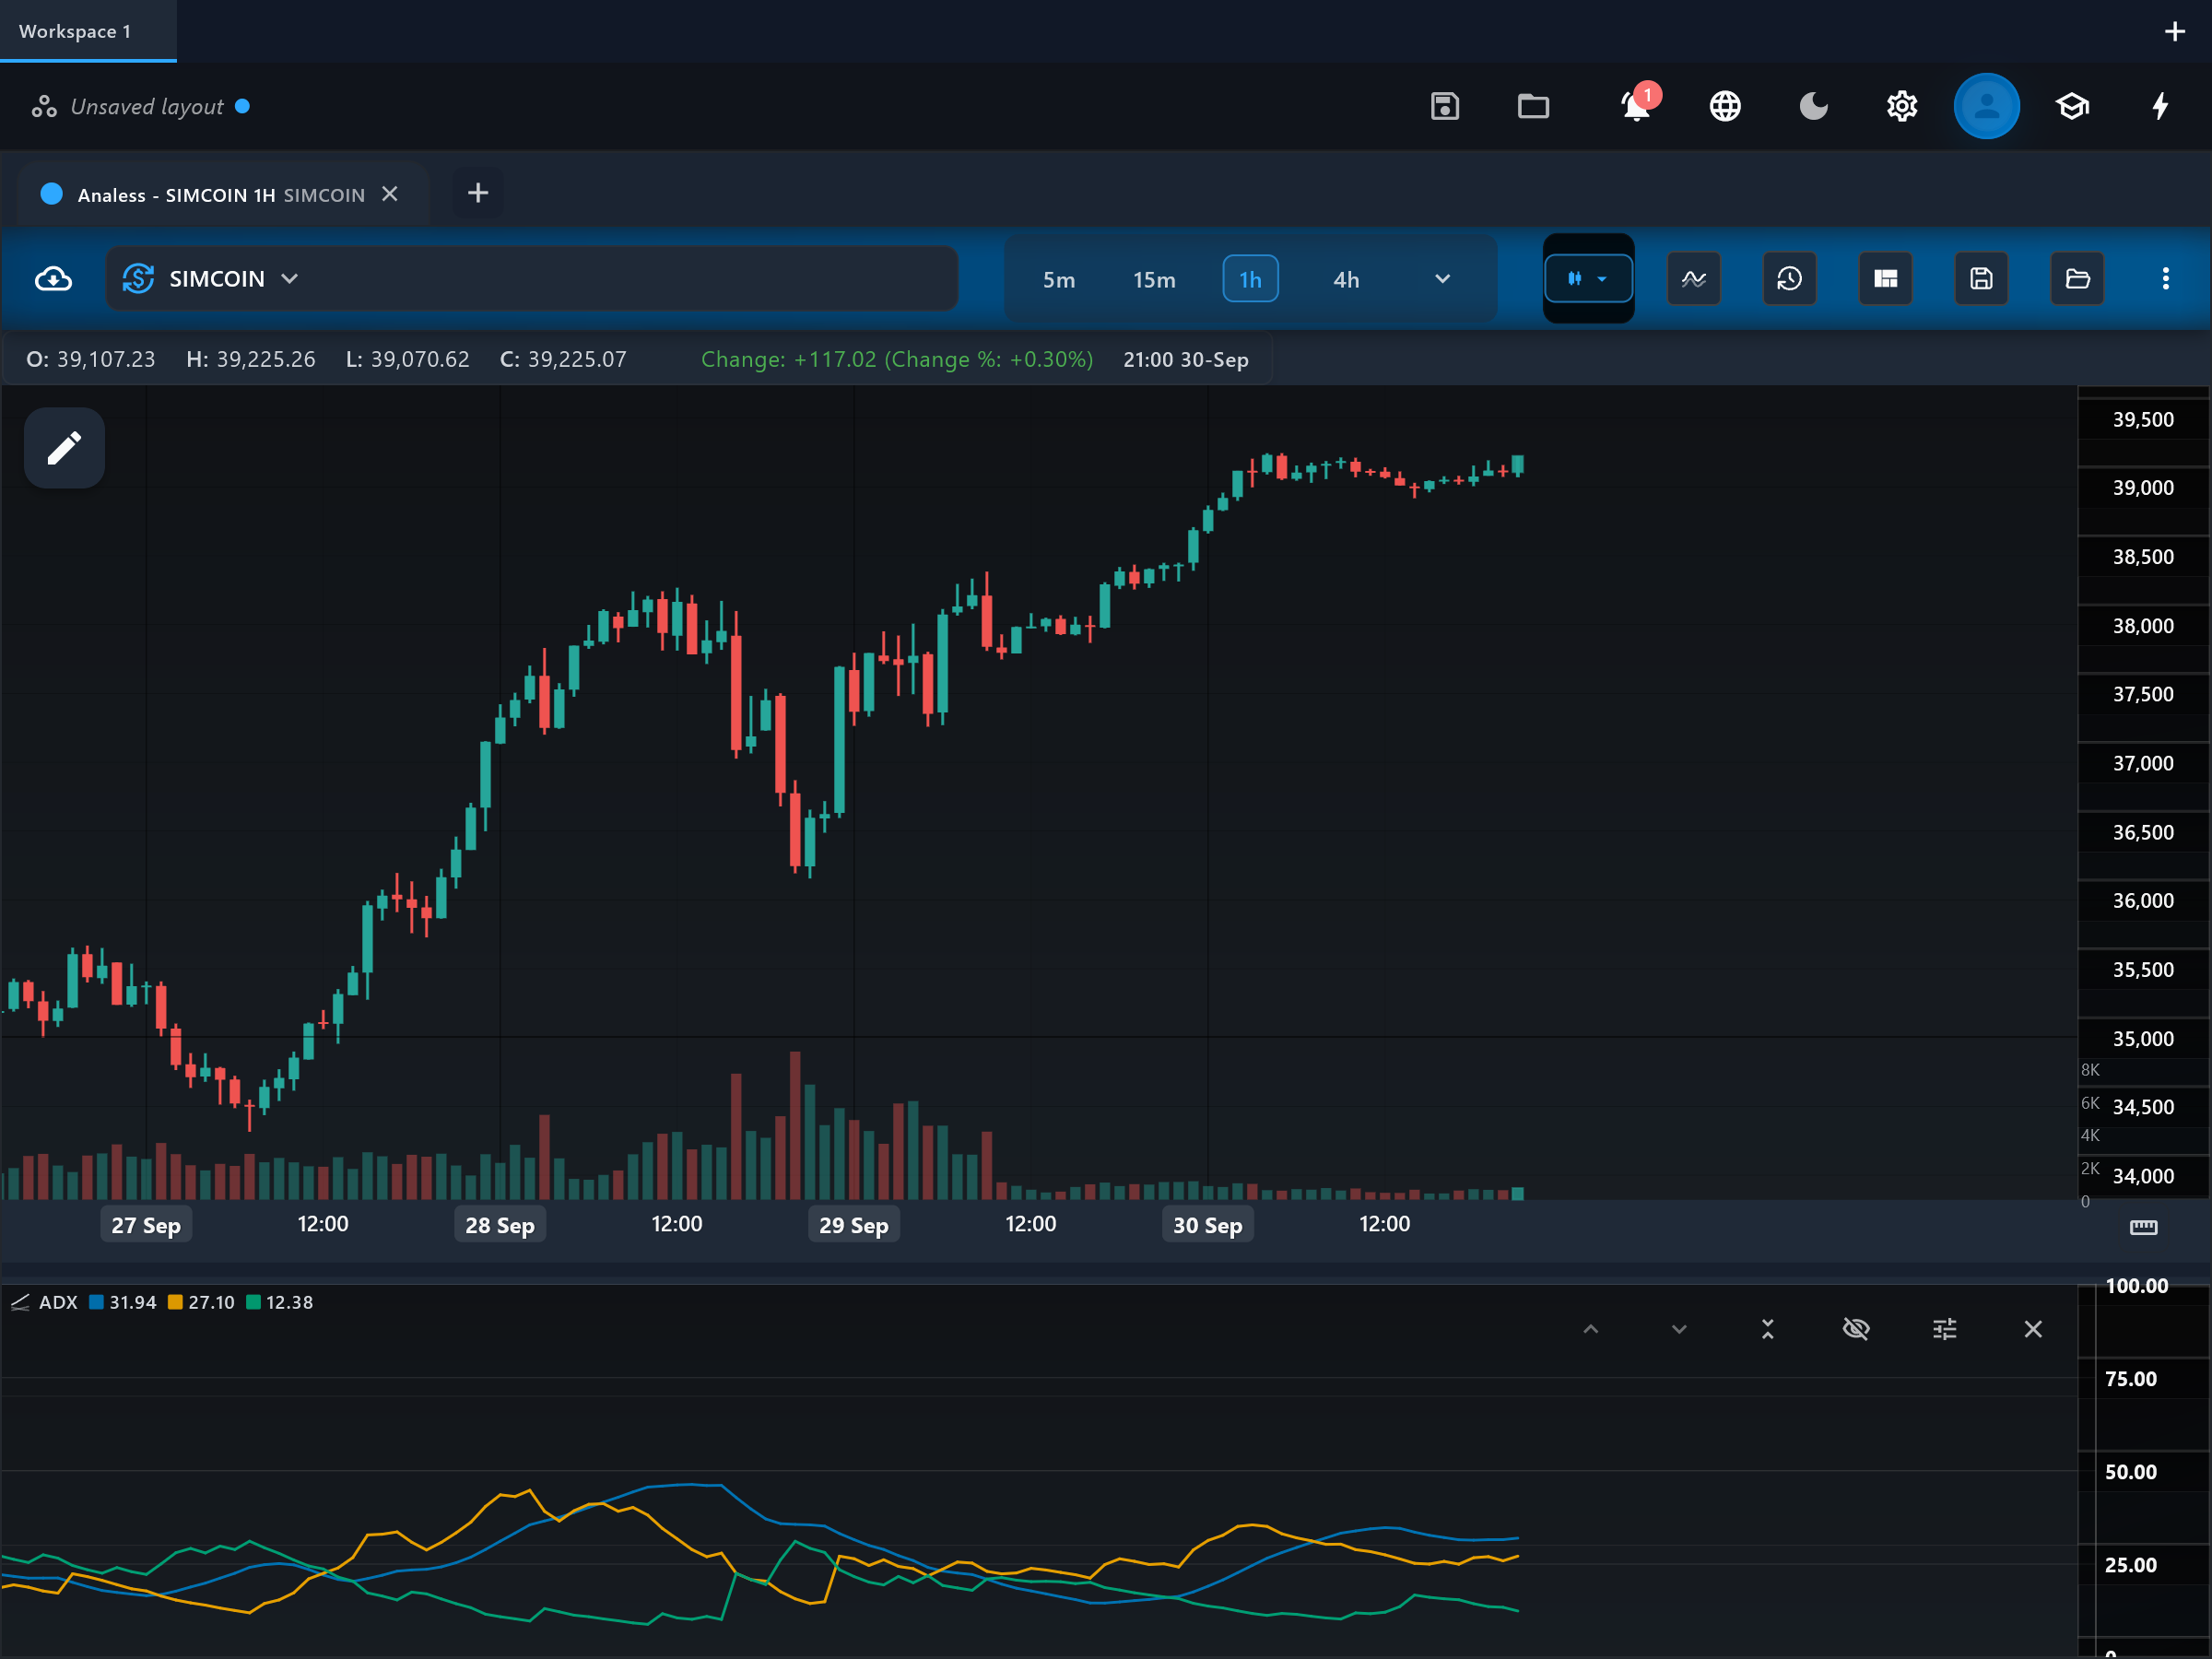
The Average Directional Index (ADX) measures how STRONG a trend is, not which way it points. It condenses directional movement into a single 0-100 line, plotted here together with the two directional lines it is built from.
How it is calculated
Each bar, the up-move and down-move are compared; only the larger one counts as directional movement (+DM or -DM). Both are Wilder-smoothed and divided by the Average True Range to give +DI and -DI on a 0-100 scale. The DX value is the spread between +DI and -DI relative to their sum, and ADX is a Wilder smoothing of DX - so ADX rises when one side dominates persistently, whichever side that is.
How to read it
The indicator draws three lines in its own pane: adx (trend strength), plus_di and minus_di (direction). Readings of adx below roughly 20 suggest a weak or absent trend; readings above 25 suggest a meaningful trend is in force. Whether that trend is up or down comes from the DI lines: plus_di on top means upward pressure dominates, minus_di on top means downward pressure dominates. A rising adx line means the trend is strengthening; a falling adx means it is fading, which is not the same thing as reversing.
What to look for
- Trend filterContext
adx rising above 25 indicates a strengthening trend - in either direction. Many traders only take trend-following setups when this filter is on.
- Trend filterContext
adx falling below 20 indicates a weak or range-bound market, where trend-following signals tend to produce whipsaws.
- Signal-line crossUpside
plus_di crossing above minus_di while adx is above 20-25 is the classic Wilder buy condition: upward movement has taken over inside a real trend.
- Signal-line crossDownside
minus_di crossing above plus_di while adx is elevated is the mirrored sell condition: downward movement dominates.
- ConfirmationContext
adx turning down from a high reading (40+) warns that the current trend is losing momentum, even though price may still be drifting in the old direction.
When to use it
ADX works on any liquid market - stocks, forex, crypto, indices - and on any timeframe, though daily and 4-hour charts give smoother readings than very short intraday ones. It shines as a regime filter that decides WHICH other tools to trust: trend-following tools when adx is high, range tools when it is low. Avoid using it as a standalone entry trigger, and avoid reading fresh values right after large gaps or on thin, gappy instruments where true range spikes distort the DI lines.
Works well with
Settings explained
period- Default 14 (Wilder's original). This is the smoothing window for the DI lines and their ATR denominator. Shorter periods make the DI lines react faster but cross more often; longer periods give calmer, later readings.
adxSmoothing- Default 14. The extra Wilder smoothing applied to DX to produce the adx line. Lowering it makes adx pick up new trends sooner; raising it filters out short bursts that never become sustained trends.
Limitations and common mistakes
- ADX says nothing about direction - a high reading can mean a strong UPtrend or a strong DOWNtrend. This is the single most common beginner misreading; always check plus_di versus minus_di for direction.
- Double smoothing makes ADX slow: it often confirms a trend well after the best entry, and stays elevated for a while after a trend has actually ended.
- The 20/25 thresholds are conventions, not laws - quiet instruments may trend hard without adx ever reaching 25.
- DI crossovers alone whipsaw badly in ranges; Wilder himself paired them with the extreme-point rule rather than trading every cross.
References
- Origin: J. Welles Wilder, 1978.
- Average directional movement index — Wikipedia (opens in a new tab)
This page explains how an indicator is calculated and read. It describes past data, not what price will do next, and it is not a recommendation to trade. Read the disclaimers.
Try it in Analess
Add ADX to any chart, adjust its settings, and open this explainer from the indicator itself.