















Indicators · Statistical
Log-Return Correlation
Measures how closely two instruments’ log returns move together, from -1 to +1.
Origin: Pearson product-moment correlation—Karl Pearson, 1895
- Best suited to
- Any market condition
- Responsiveness
- Lagging
- Family
- Statistical
What it is
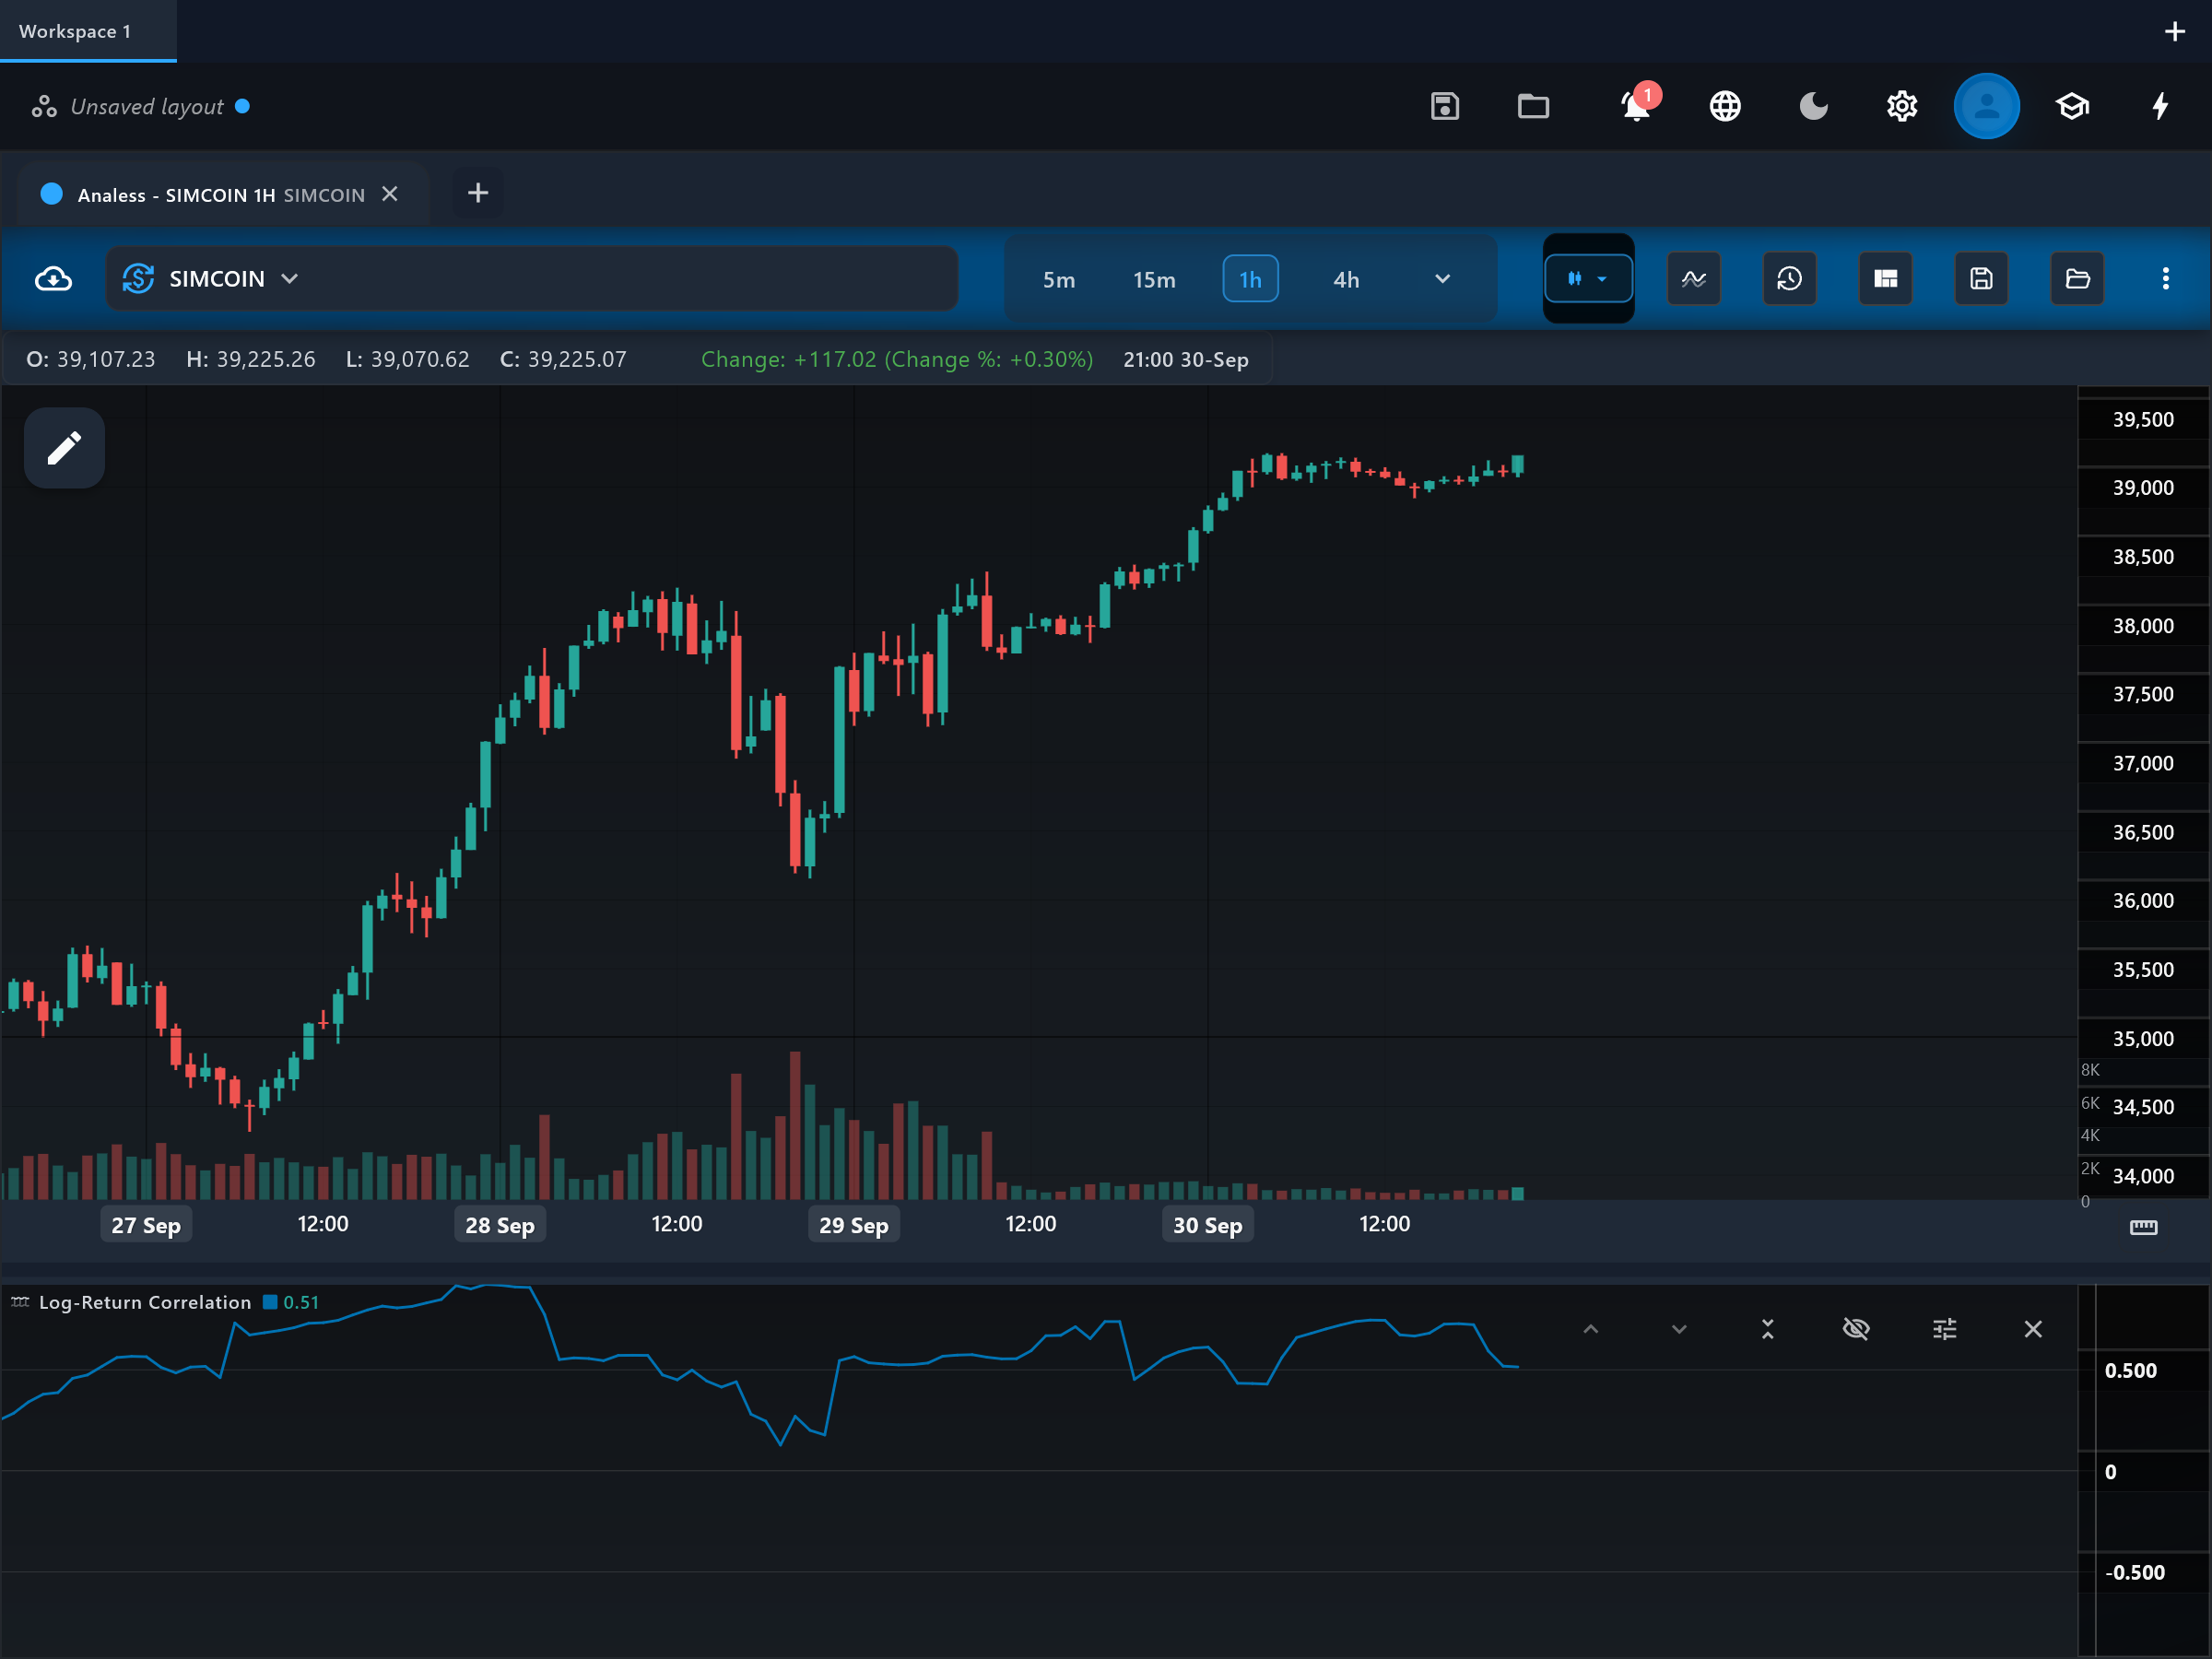
Log-Return Correlation measures how closely the bar-to-bar log returns of two price fields of the charted symbol move together, as a rolling Pearson correlation between -1 and +1. It is a statistical consistency gauge rather than a directional signal: readings near +1 mean the two fields are moving in lockstep, readings near zero mean they have decoupled.
How it is calculated
Each bar, the indicator takes the natural-log return of source A and of source B (for example close-to-close versus high-to-high), then computes the Pearson correlation coefficient of the two return series over the last N bars. Using log returns rather than raw prices removes the shared trend that would otherwise pin the correlation near +1 permanently.
How to read it
The single correlation_log line oscillates between -1 and +1 in its own pane. With the default close-versus-high pairing, readings near +1 describe orderly bars whose highs and closes advance together; a falling line means the two fields are diverging — often long upper wicks, i.e. highs that stopped being confirmed by closes. Zero means no linear relationship over the window.
What to look for
- DivergenceContext
A sustained drop from near +1 toward zero flags a change in bar character (e.g. closes no longer tracking highs) that often precedes a volatility regime shift.
- Trend filterContext
Stable high correlation is an orderly-market filter: signals from other indicators tend to be more reliable when bar internals agree than when they conflict.
- Centre-line crossContext
Crossing below zero means the two fields are moving in opposite directions over the window — rare for price fields of one symbol and worth investigating when it happens.
When to use it
A specialist tool for any market, most informative on intraday and daily charts of liquid symbols where bar structure is meaningful. It is not a buy/sell indicator; use it to characterize market state. It says nothing about cross-asset relationships — comparing two different symbols needs the strategy builder's multi-symbol inputs, not this single-symbol indicator.
Works well with
Settings explained
period- The rolling correlation window (default 20 bars). Shorter windows react faster but produce noisy, jumpy readings; longer windows give a smoother, slower gauge.
sourceA- The first price field (default close). Both legs are fields of the charted symbol.
sourceB- The second price field (default high). Pick two fields whose relationship you want to monitor — close vs high tracks upper-wick behavior, close vs low tracks lower-wick behavior.
Limitations and common mistakes
- Correlation between price fields of the SAME symbol is naturally high — the interesting information is in changes, not the absolute level.
- Pearson correlation only captures linear co-movement and is sensitive to outlier bars inside the window.
- It cannot compare two different symbols; despite the name, this is a single-symbol bar-structure gauge.
References
- Origin: Pearson product-moment correlation—Karl Pearson, 1895.
- Pearson correlation coefficient — Wikipedia (opens in a new tab)
This page explains how an indicator is calculated and read. It describes past data, not what price will do next, and it is not a recommendation to trade. Read the disclaimers.
Try it in Analess
Add Log-Return Correlation to any chart, adjust its settings, and open this explainer from the indicator itself.