















Indicators · Support & resistance
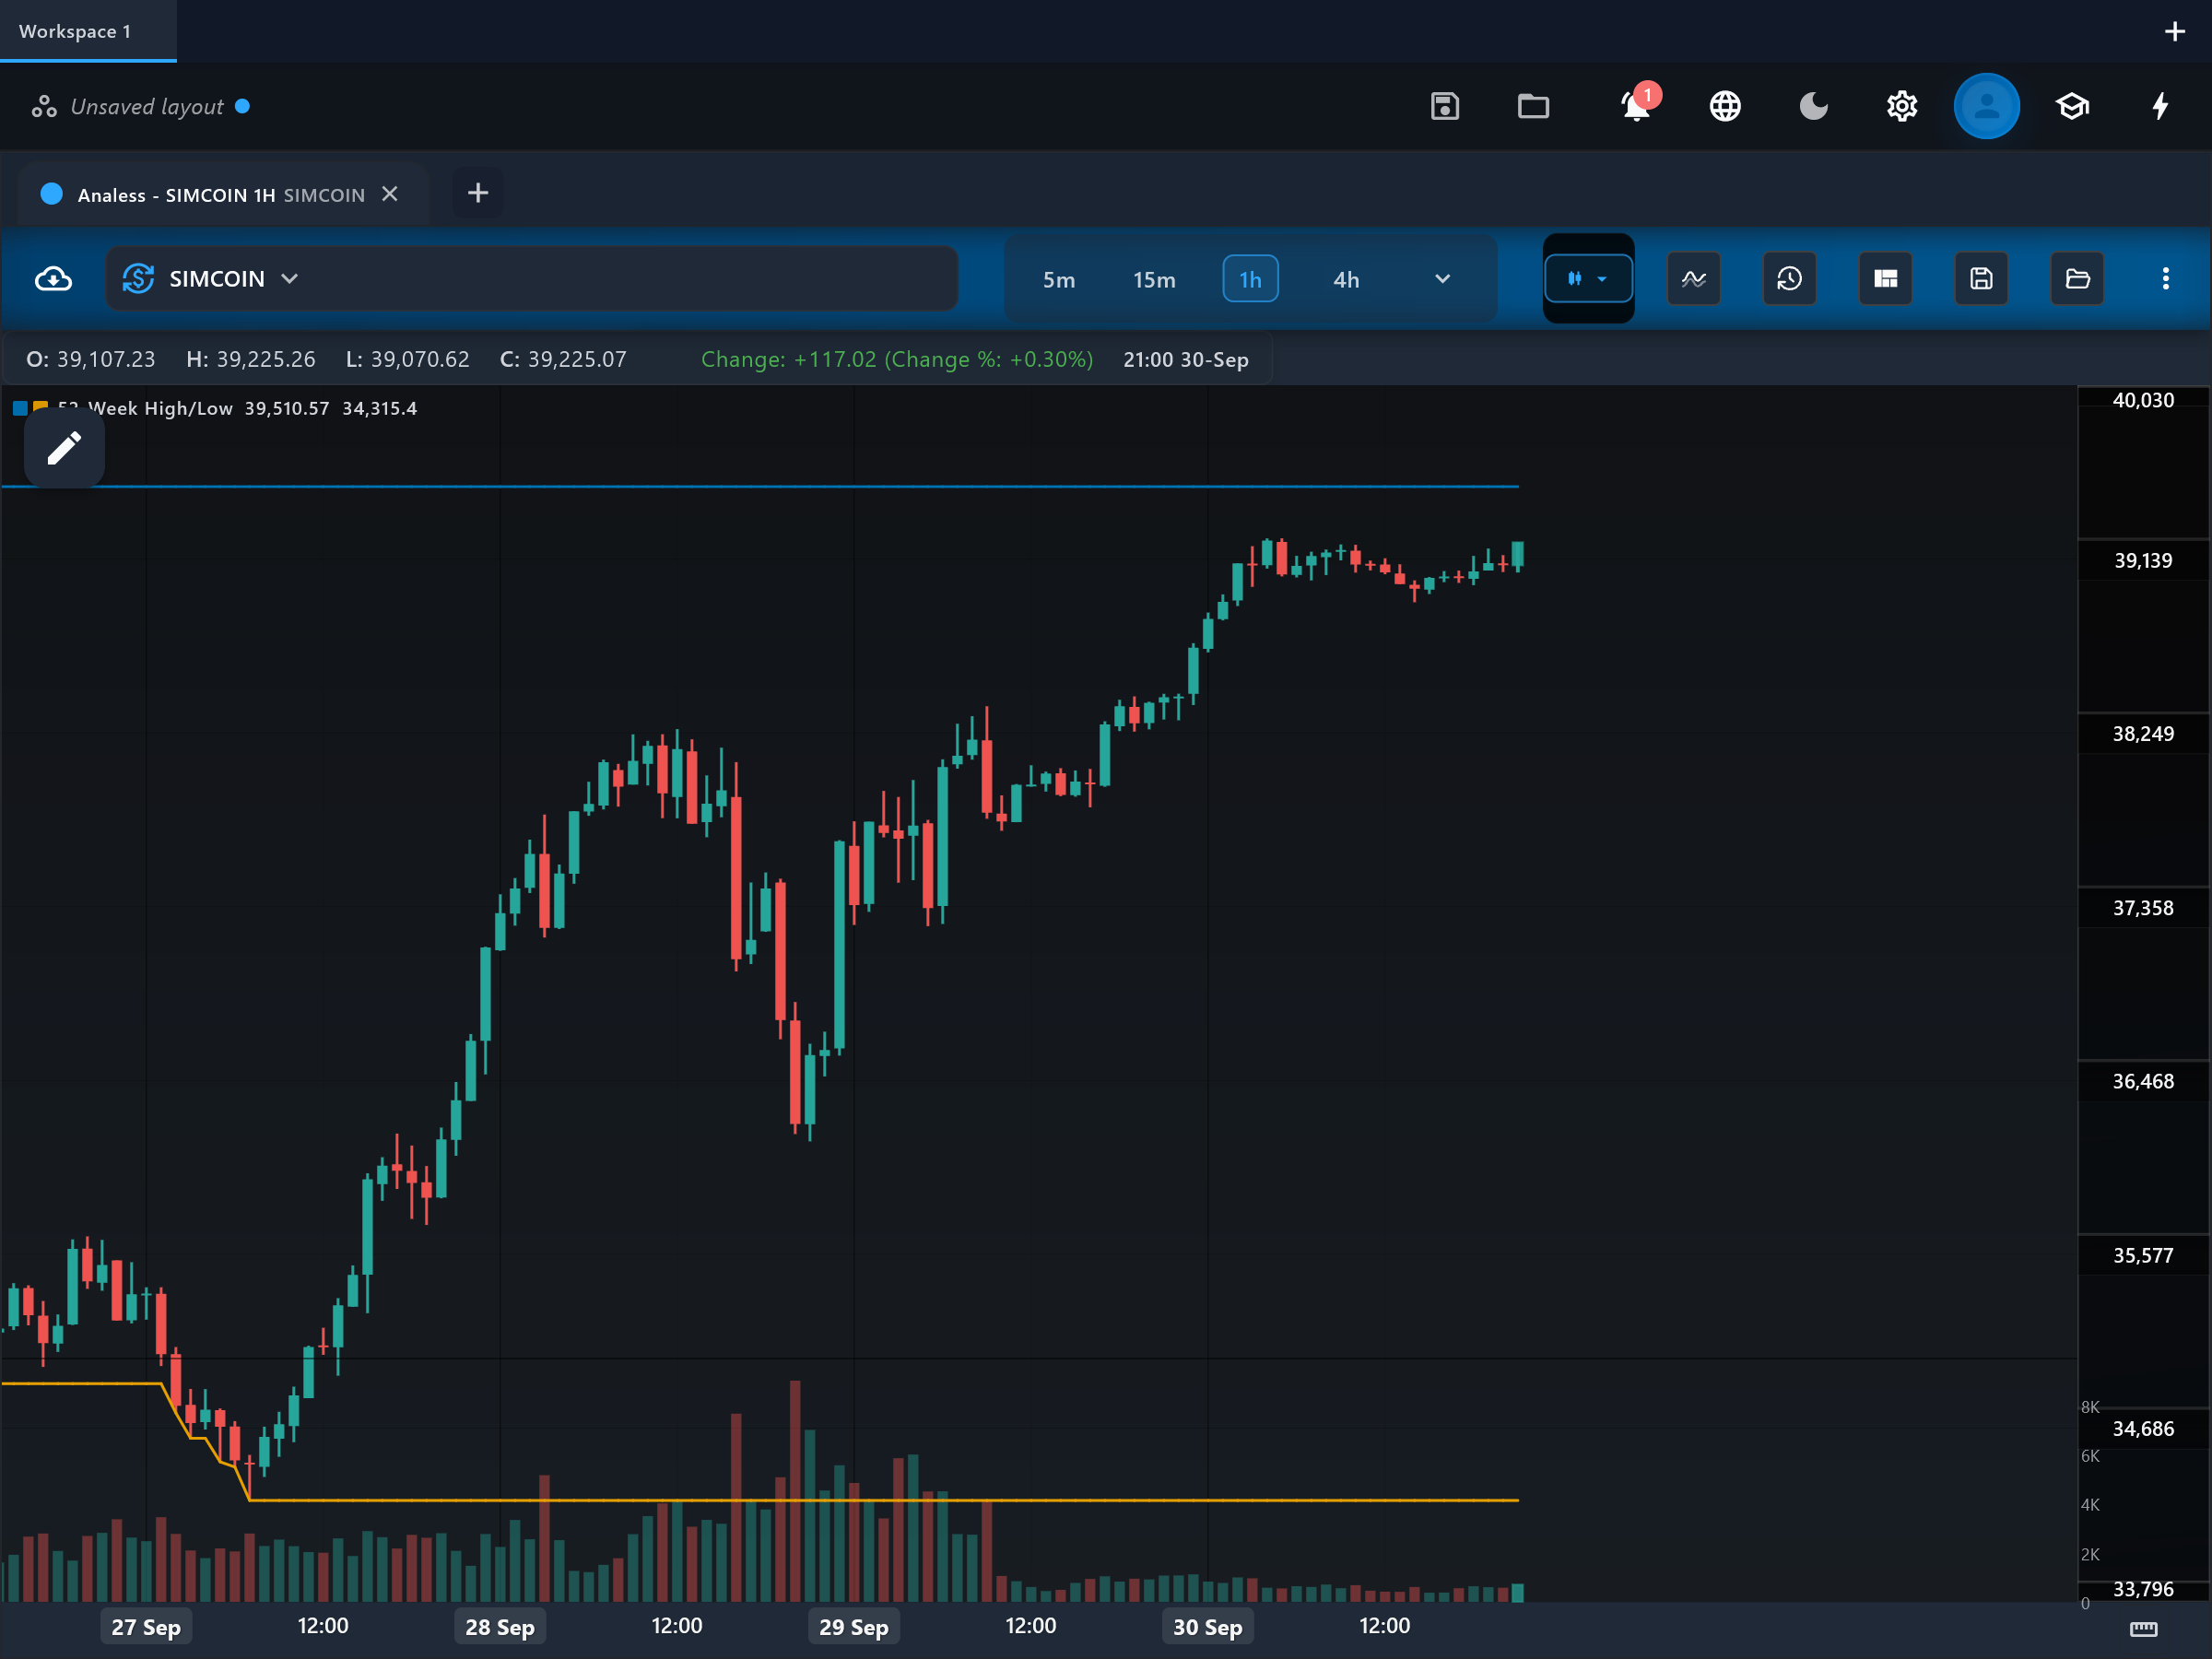
52-Week High/Low
Marks the year’s highest high and lowest low.
Origin: Market convention; the 52-week-high effect studied by George & Hwang, 2004
- Best suited to
- Trending markets
- Responsiveness
- Coincident
- Family
- Support & resistance
What it is
The 52-Week High/Low plots the highest high and lowest low of roughly the past year as two lines on the price chart. These are the same levels quoted in stock screeners and financial media, and institutional strategies famously buy strength near the 52-week high and avoid names languishing near the 52-week low.
How it is calculated
The app computes a rolling window of periodWeeks × 5 trading days (52 weeks × 5 = 260 daily bars by default). high_52w is the highest high over that window and low_52w is the lowest low. Both lines update every bar as the window rolls forward, so an old extreme eventually ages out even if price never revisits it.
How to read it
high_52w draws a flat-or-stepping line at the yearly high and low_52w at the yearly low; current price always sits between or on them. Price hugging high_52w signals persistent strength — new 52-week highs are a well-documented momentum condition. Price pinned to low_52w signals persistent weakness. The distance between the two lines is also a quick visual of the past year's total range, and price's position within it shows where the market sits in its yearly context.
What to look for
- Range expansionUpside
Price printing a new 52-week high (touching and pushing high_52w upward) is a classic institutional momentum-breakout condition.
- Range expansionDownside
Price printing a new 52-week low (pushing low_52w downward) signals persistent weakness and is often a screen-out condition for long strategies.
- Trend filterContext
Position within the yearly range acts as a regime filter: the upper portion favors long setups, the lower portion urges caution.
When to use it
This is primarily a stock and ETF tool on daily charts, matching how screeners and fund managers use the 52-week levels; it also gives useful yearly context on crypto and commodities. It is not meant for short-term timing — the lines move slowly and say nothing about entries. Be careful on intraday charts: the window is counted in bars, so it only approximates 52 calendar weeks on daily data and depends on how much history is loaded.
Works well with
Settings explained
periodWeeks- The lookback in weeks, default 52 (one trading year, converted to periodWeeks × 5 daily bars). Shorter values like 26 or 13 track the half-year or quarterly range instead; longer values demand more loaded history before the lines are meaningful.
barsPerWeek- Trading sessions per week for this instrument, default 5. That is right for stocks and forex; a crypto venue trades 7 days a week, and leaving this at 5 makes the window 29% shorter than the week count suggests. It exists because the lookback is counted in BARS, not calendar time.
Limitations and common mistakes
- The window is measured in bars (weeks × 5), so it is only a true "52-week" level on daily charts. On intraday timeframes the window covers far less than a year and depends on the history the chart has loaded.
- The lines identify context, not timing — price can ride the 52-week high for months (strong trends do exactly that) or sit near the low long before any recovery.
- Until a full window of history is loaded, the plotted extremes reflect only the available data and can differ from published 52-week figures.
References
- Origin: Market convention; the 52-week-high effect studied by George & Hwang, 2004.
This page explains how an indicator is calculated and read. It describes past data, not what price will do next, and it is not a recommendation to trade. Read the disclaimers.
Try it in Analess
Add 52-Week High/Low to any chart, adjust its settings, and open this explainer from the indicator itself.