















Indicators · Support & resistance
Williams Fractal
Marks local swing highs and lows that stand out from their neighbours.
Origin: Bill Williams, 1990s
- Best suited to
- Trending markets
- Responsiveness
- Lagging
- Family
- Support & resistance
What it is
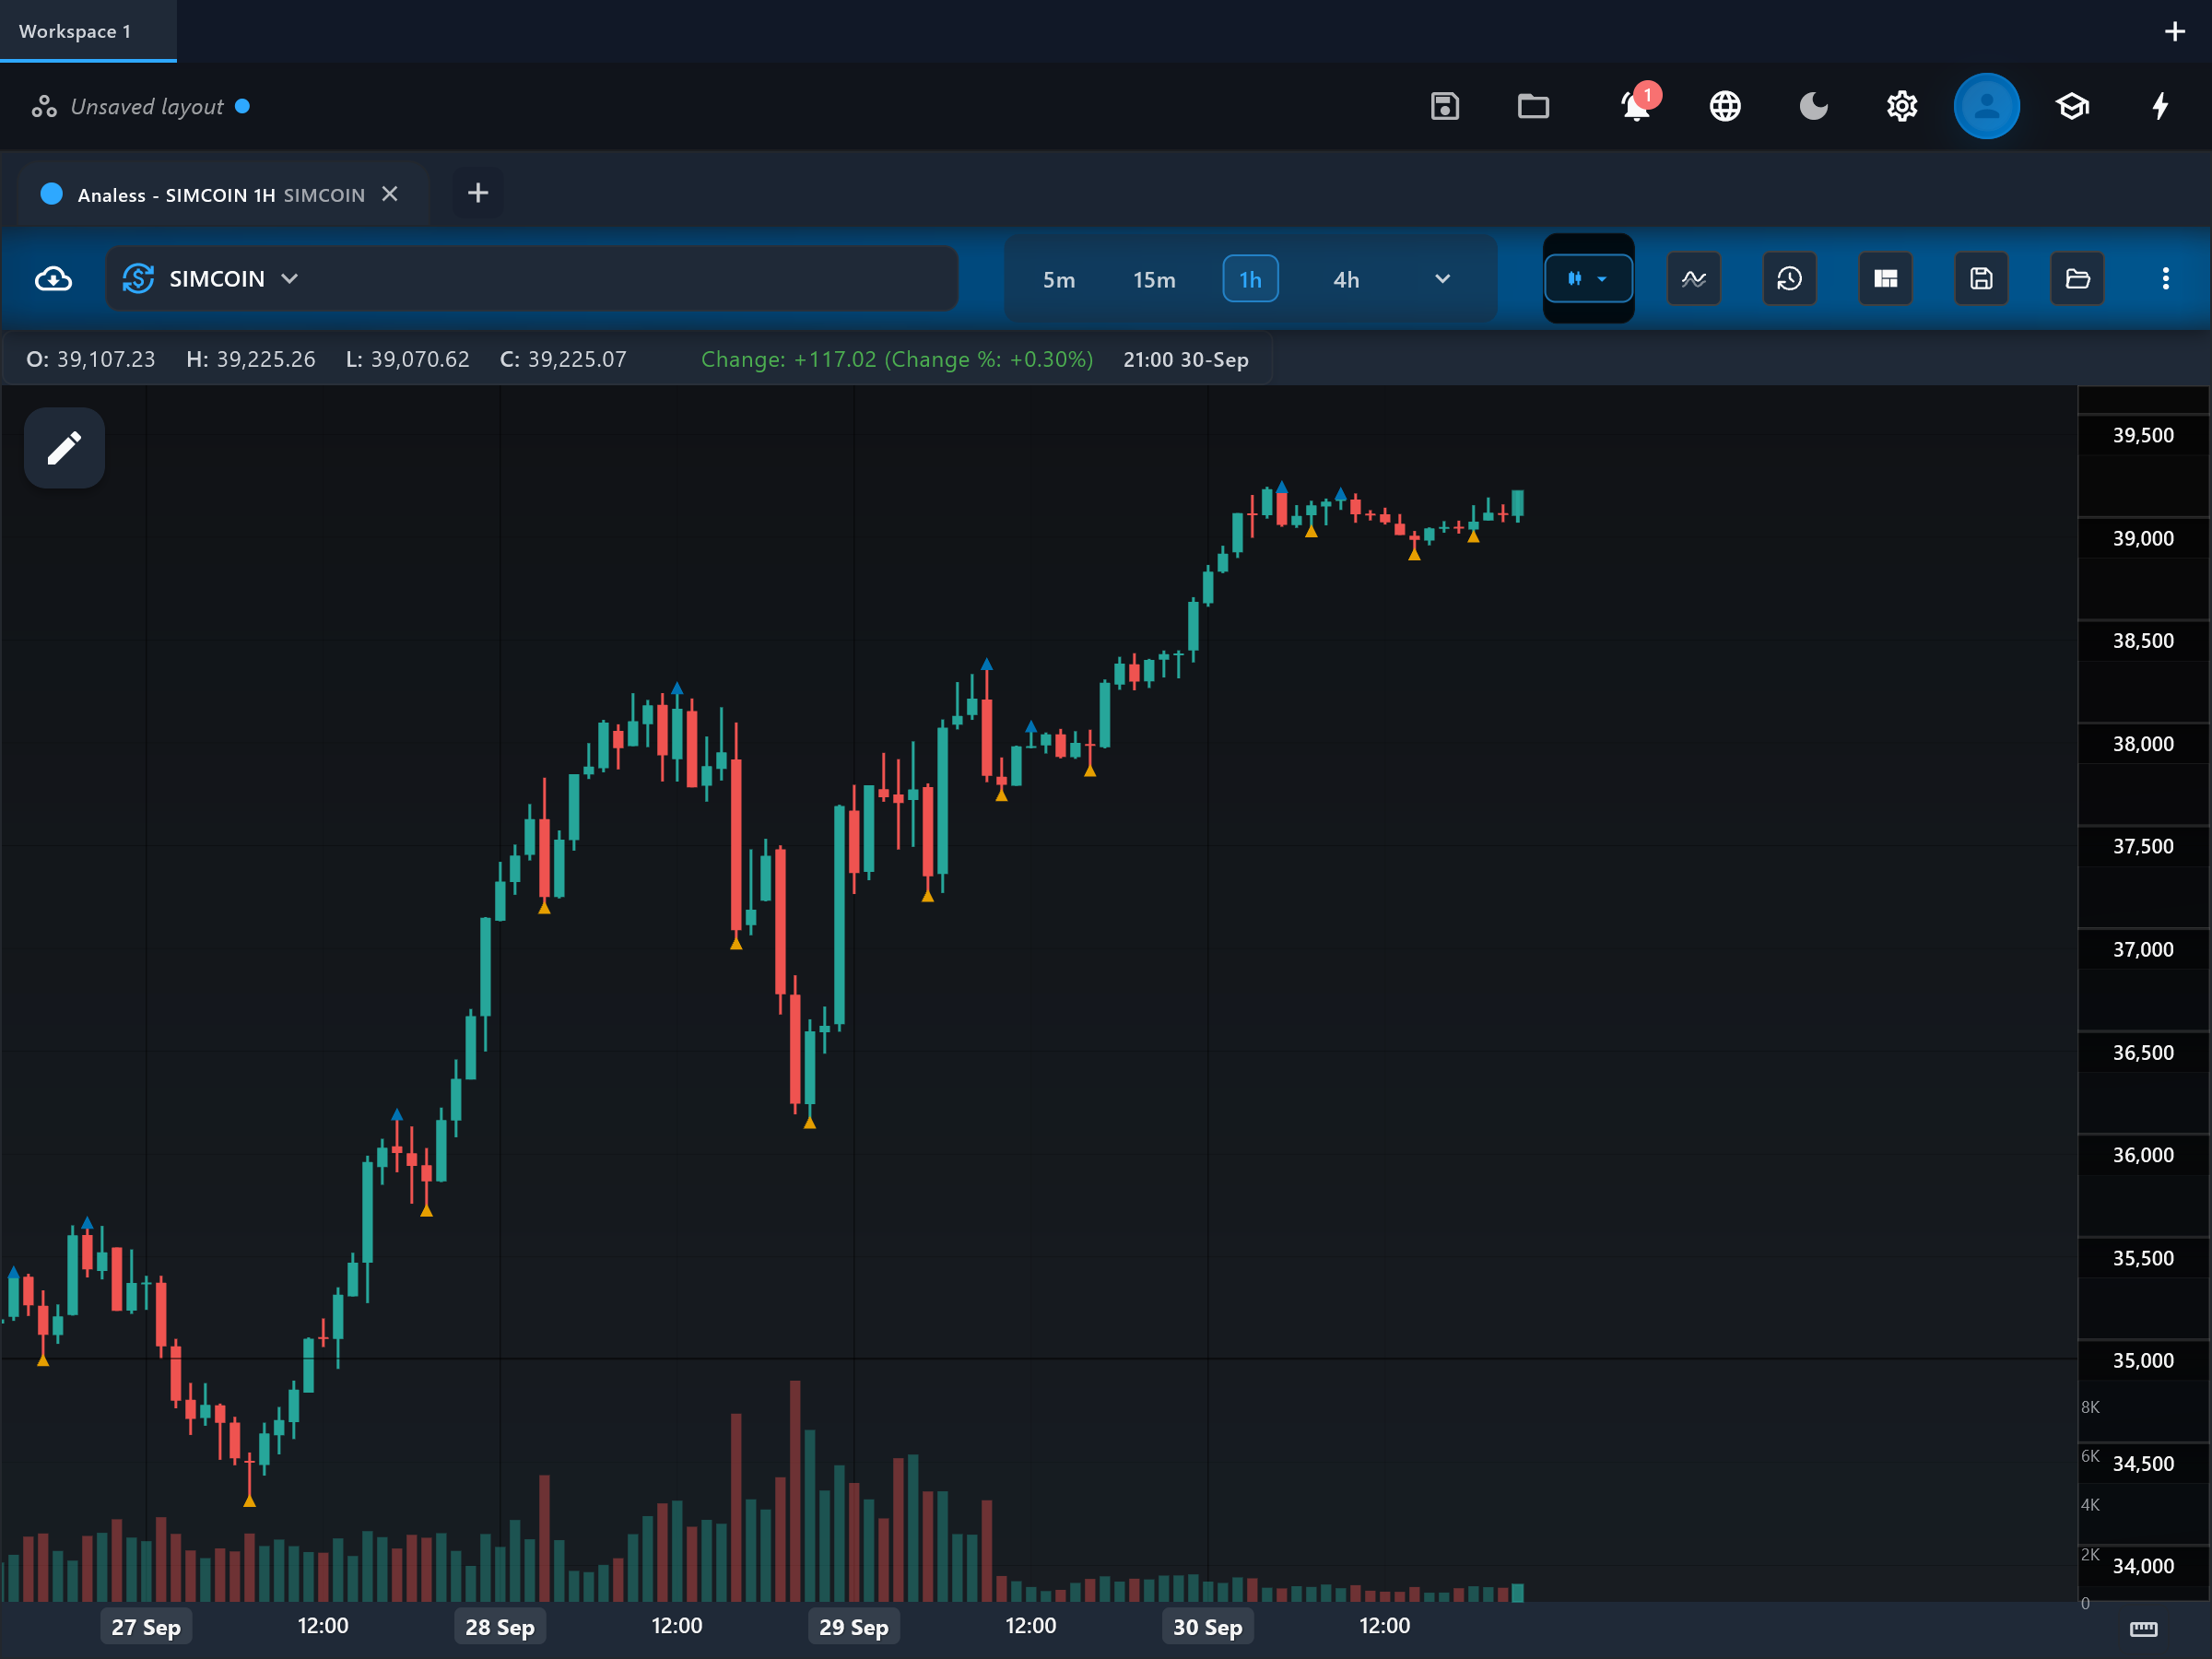
Williams Fractal marks local turning points on the price chart: an up fractal is a bar whose high is higher than the bars on both sides of it, and a down fractal is a bar whose low is lower than its neighbors. It gives you an objective, rule-based way to identify swing highs and swing lows.
How it is calculated
With the default lookback of 5 bars, the app checks each bar against half the lookback (2 bars) on each side. A bar becomes an up fractal when its high exceeds the highs of the 2 bars before it and the 2 bars after it; a down fractal mirrors that with lows. Because the pattern needs bars on BOTH sides, a fractal can only be confirmed after those later bars have closed — the marker appears half the lookback late.
How to read it
Confirmed fractals are drawn as markers on the price chart: up_fractal markers above swing-high bars and down_fractal markers below swing-low bars. A sequence of rising down fractals sketches an uptrend's higher lows; falling up fractals sketch a downtrend's lower highs. The most recent up and down fractals also act as natural breakout trigger levels — Bill Williams' original system buys a break above the last up fractal. Remember that each marker refers to a bar that closed several bars ago.
What to look for
- Turning patternDownside
An up_fractal marker confirms a local swing high — a potential short-term top and a resistance reference.
- Turning patternUpside
A down_fractal marker confirms a local swing low — a potential short-term bottom and a support reference.
- Range expansionUpside
Price breaking above the most recent up fractal is the classic Bill Williams buy trigger.
- Range expansionDownside
Price breaking below the most recent down fractal is the matching sell trigger.
When to use it
Fractals work on any liquid market and timeframe, and are traditionally combined with the Williams Alligator on trending markets. They shine as objective swing markers for drawing support, resistance, and trendlines. Avoid relying on them alone in choppy, low-timeframe conditions, where fractals appear constantly and most mark noise rather than meaningful turns.
Works well with
Settings explained
lookbackPeriod- The total window a bar must dominate, default 5 (2 bars each side). Larger values demand a wider local extreme, producing fewer but more significant fractals — at the cost of even later confirmation, since the wait equals half the lookback. Smaller values mark more swings but more noise.
Limitations and common mistakes
- Confirmation is inherently late: a fractal needs bars on both sides, so the marker only appears half the lookback after the actual swing bar. Until those bars close, no marker exists — a repaint-adjacent limitation to keep in mind when backtesting by eye.
- In ranging or noisy markets fractals fire constantly, and most mark insignificant wiggles rather than tradable turns.
- A fractal says nothing about the size or duration of the move that follows — it only labels a local extreme.
References
- Origin: Bill Williams, 1990s.
- Bill Williams (trader) — Wikipedia (opens in a new tab)
This page explains how an indicator is calculated and read. It describes past data, not what price will do next, and it is not a recommendation to trade. Read the disclaimers.
Try it in Analess
Add Williams Fractal to any chart, adjust its settings, and open this explainer from the indicator itself.