















Indicators · Volume
OBV
On-Balance Volume — a running total that adds volume on up bars and subtracts it on down bars.
Origin: Joseph Granville, 1963
- Best suited to
- Trending markets
- Responsiveness
- Leading
- Family
- Volume
What it is
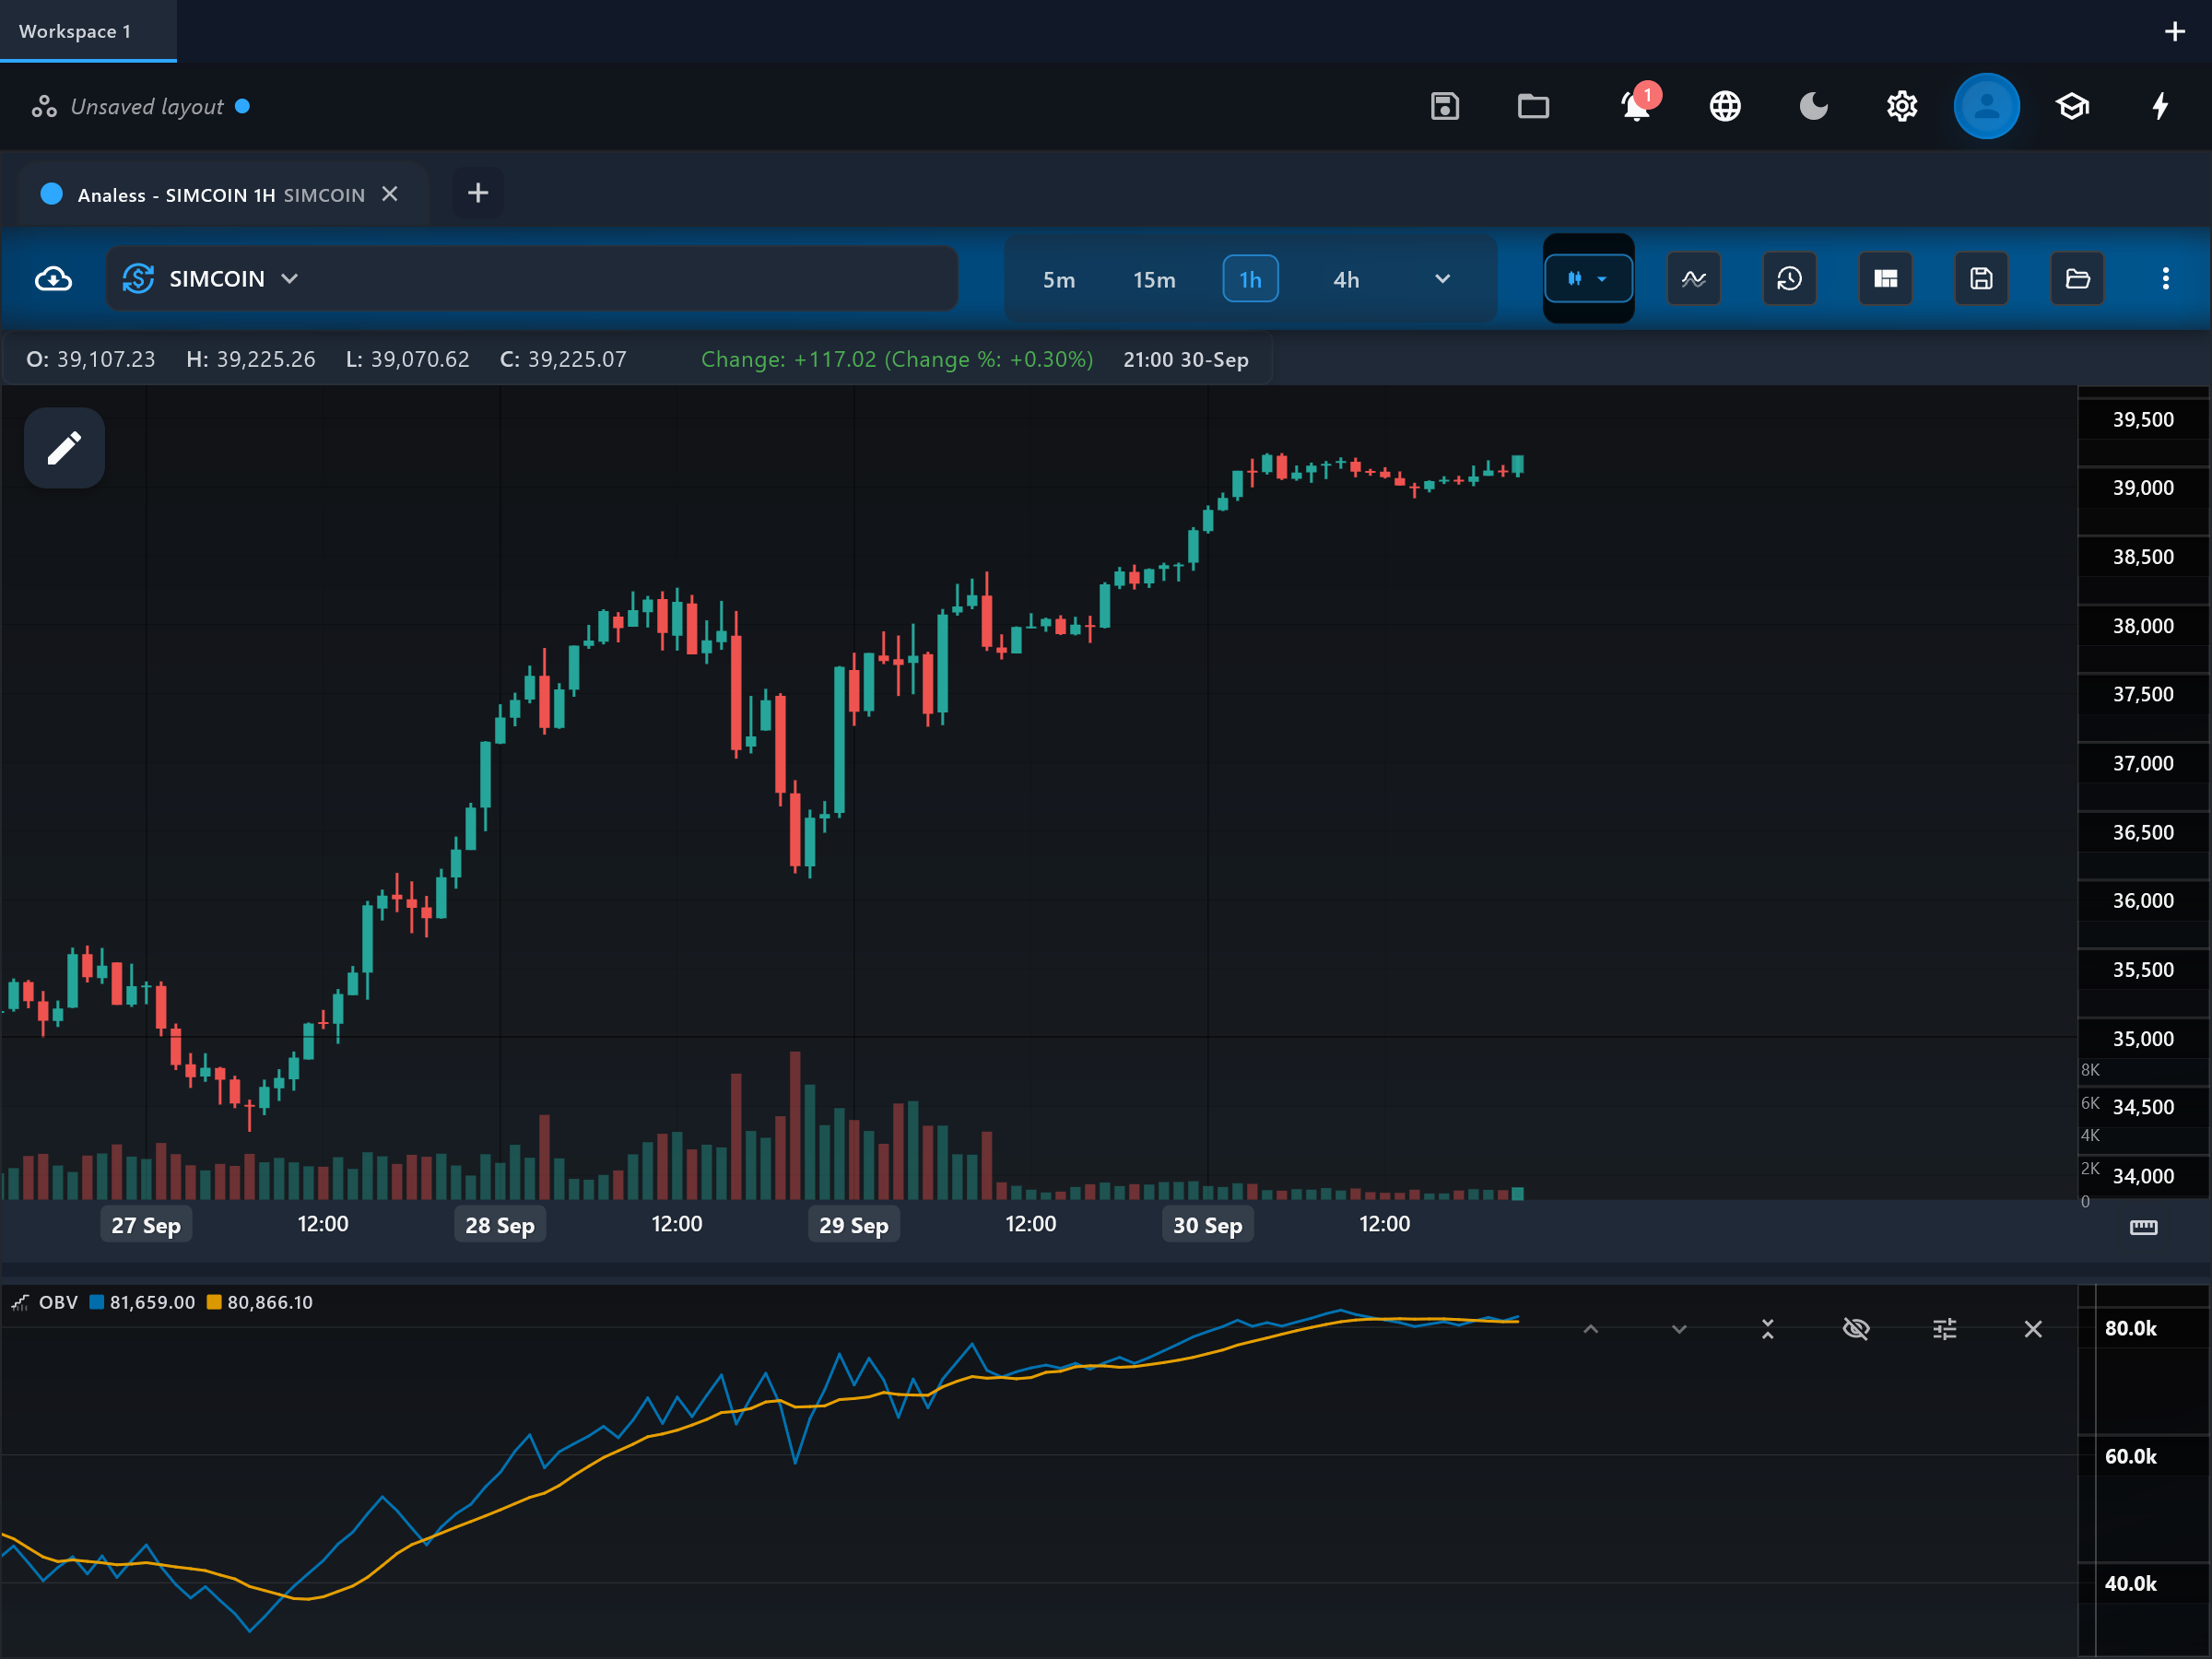
On-Balance Volume (OBV) is a running total that adds each bar's volume when price closes up and subtracts it when price closes down. The idea is that volume flows reveal accumulation or distribution before price fully reflects it.
How it is calculated
This app computes a cumulative sum of signed volume: the full bar volume is added on an up close and subtracted on a down close. A simple moving average of the OBV line is drawn as a signal line over a configurable period.
How to read it
The "obv" line matters for its direction and shape, not its absolute value — the number itself depends on where the loaded data begins. A rising obv line means up-close bars are carrying more volume than down-close bars. The "signal" line smooths obv; the obv line holding above its signal keeps the volume-flow picture positive. The classic use is comparing obv's highs and lows against price's highs and lows to spot agreement or divergence.
What to look for
- ConfirmationUpside
OBV breaking above its own prior high alongside (or before) a price breakout is conventionally read as volume confirming the move.
- DivergenceDownside
Price making a higher high while the obv line makes a lower high is a bearish divergence — the advance is happening on weaker volume flow.
- DivergenceUpside
Price making a lower low while obv holds a higher low suggests selling pressure is drying up.
- Signal-line crossContext
The obv line crossing its signal moving average marks a change in the short-term balance of volume flow.
When to use it
Works on stocks, futures, and liquid crypto pairs across swing and position timeframes. Avoid it on thin or illiquid symbols, where a few large prints dominate the cumulative line, and treat it cautiously on spot forex, where volume is tick-based rather than real traded size.
Works well with
Settings explained
signalPeriod- Length of the simple moving average drawn over the OBV line (default 10). Shorter values make signal-line crosses more frequent and noisier; longer values slow the signal down and emphasize the larger volume-flow trend.
Limitations and common mistakes
- OBV is all-or-nothing: a bar that closes up by one tick adds its entire volume, the same as a huge rally bar.
- The absolute level is meaningless and depends on where the data series starts — only slopes and relative highs/lows matter.
- A single enormous volume bar (an index rebalance, a listing event) can permanently shift the line and distort later comparisons.
- Divergences can persist for a long time before price responds, so they are context, not timing.
References
- Origin: Joseph Granville, 1963.
- On-balance volume — Wikipedia (opens in a new tab)
This page explains how an indicator is calculated and read. It describes past data, not what price will do next, and it is not a recommendation to trade. Read the disclaimers.
Try it in Analess
Add OBV to any chart, adjust its settings, and open this explainer from the indicator itself.