















Indicators · Bands & channels
Donchian Channels
Lines at the highest high and lowest low over a period, framing breakouts and range.
Origin: Richard Donchian, mid-20th century
- Best suited to
- Trending markets
- Responsiveness
- Lagging
- Family
- Bands & channels
What it is
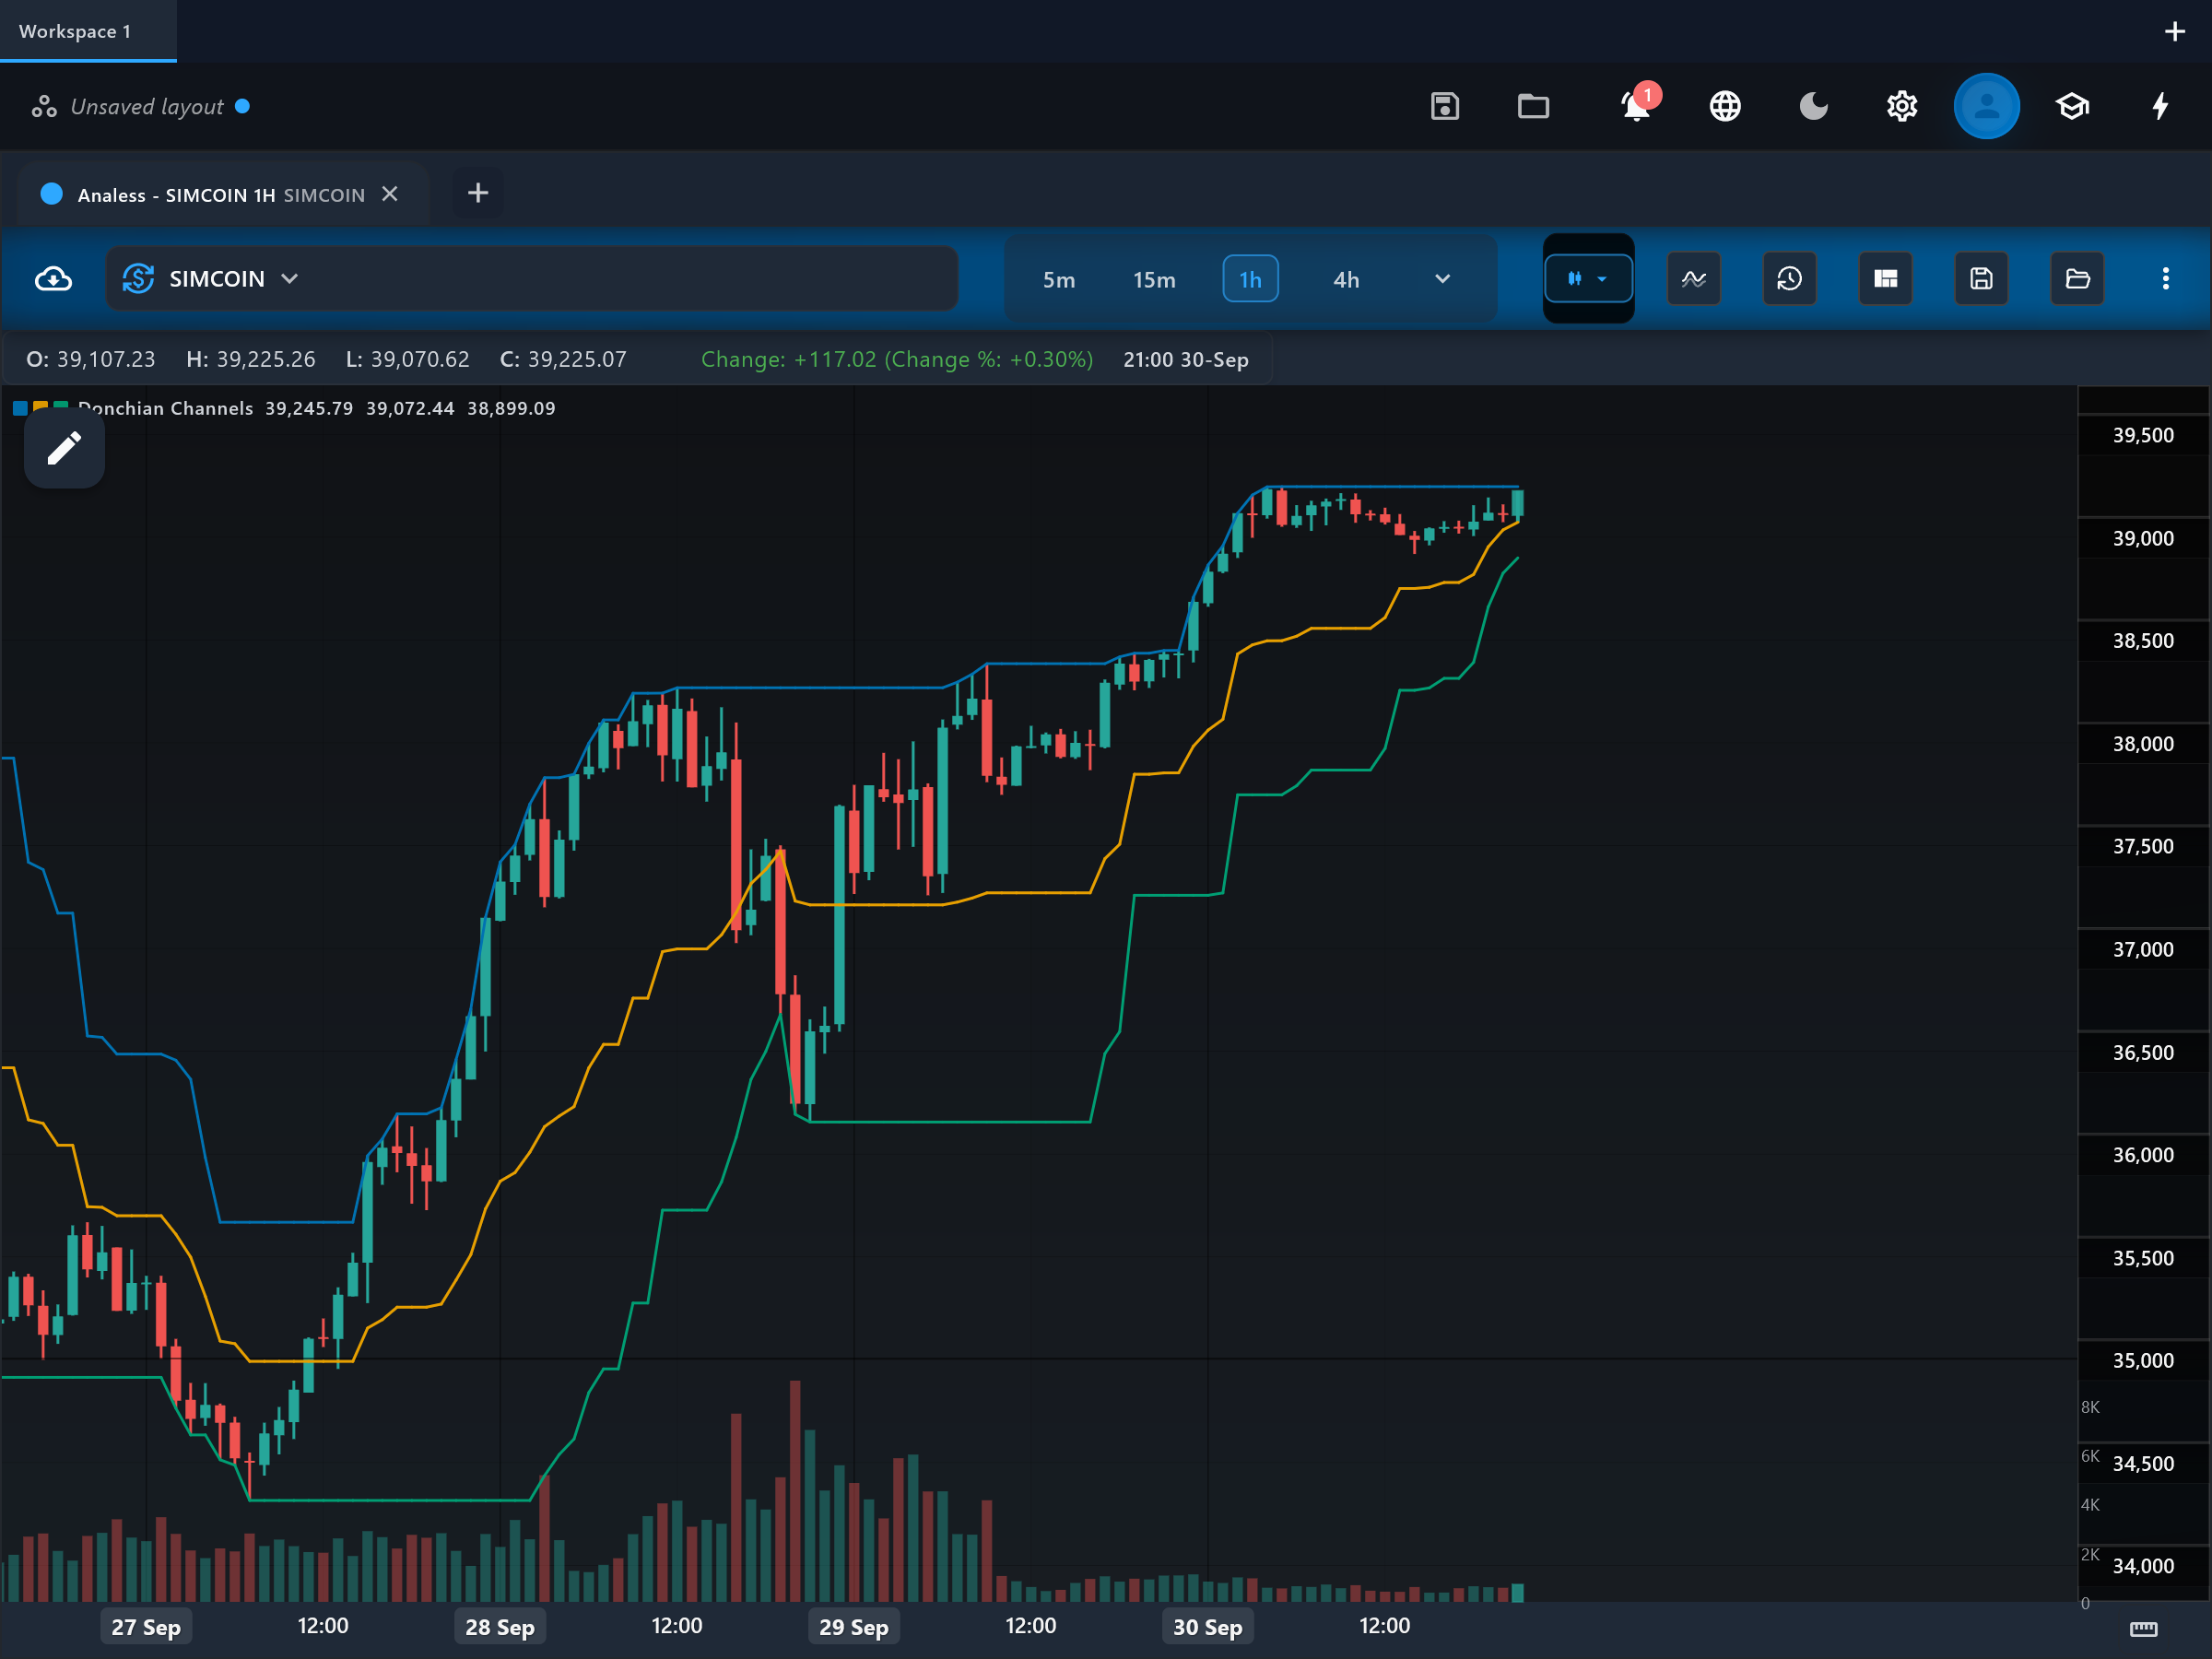
Donchian Channels draw the highest high and lowest low of the last N bars directly on the chart, framing price in its recent extreme range. They are the foundation of classical breakout trading — famously the basis of the Turtle Traders' system.
How it is calculated
The upper line is the highest high over period bars (default 20), the lower line is the lowest low over the same window, and middle is their average. The optional shift parameter displaces the whole channel forward by N bars; at the default 0 the channel is the standard Donchian construction. Unlike Bollinger or Keltner channels there is no averaging at all — the lines move only when a new extreme is set or an old one drops out of the window.
How to read it
Three overlay lines frame price: upper, middle, and lower. Price touching upper means it has matched its highest point of the lookback — by construction price can never close outside the channel by more than the current bar's excursion. A rising staircase in upper with a flat lower shows accumulation of new highs; the reverse shows distribution. The middle line is a simple trend reference, and the channel's width is a direct, unsmoothed read of the recent range.
What to look for
- Range expansionUpside
Price breaking above the prior upper — a new N-bar high — is the classic Donchian buy trigger; the Turtle system used exactly this with 20- and 55-bar channels.
- Range expansionDownside
Price breaking below the prior lower — a new N-bar low — is the mirror sell/short trigger.
- Trend filterContext
Price spending most bars in the upper half of the channel (above middle) indicates upward pressure; the lower half, downward pressure.
- ConfirmationContext
Breakout systems commonly exit on the opposite, shorter channel — for example enter on a 20-bar high, exit on a 10-bar low — using the channel for both legs of the trade.
When to use it
Built for trend-following on markets capable of sustained directional runs — commodities, crypto, and index futures historically. Breakout entries lose money in extended ranges, where every new extreme snaps back; that whipsaw cost is the known price of the strategy. Longer lookbacks (55+) suit position trading; 20 is the classic swing setting.
Works well with
Settings explained
period- The extreme-lookback window (default 20, the classic Turtle entry). Shorter periods trigger more, earlier breakouts with more false starts; longer periods trade rarely but catch only the bigger moves.
shift- Displaces the channel forward N bars (default 0 = standard Donchian). A small positive shift compares price against slightly older extremes, which some MT-style setups use.
Limitations and common mistakes
- Whipsaw-prone in ranges: repeated N-bar highs and lows that immediately reverse are the strategy's main cost.
- The lines are driven by single extreme prints, so one anomalous wick redefines the channel for a full window.
- Entries are inherently late by design — you buy strength after a new high, never at the low.
References
- Origin: Richard Donchian, mid-20th century.
- Donchian channel — Wikipedia (opens in a new tab)
This page explains how an indicator is calculated and read. It describes past data, not what price will do next, and it is not a recommendation to trade. Read the disclaimers.
Try it in Analess
Add Donchian Channels to any chart, adjust its settings, and open this explainer from the indicator itself.