















Indicators · Support & resistance
Pivot Points
Derives support and resistance levels from the prior period’s high, low, and close.
Origin: Floor traders, early 20th century
- Best suited to
- Ranging markets
- Responsiveness
- Leading
- Family
- Support & resistance
What it is
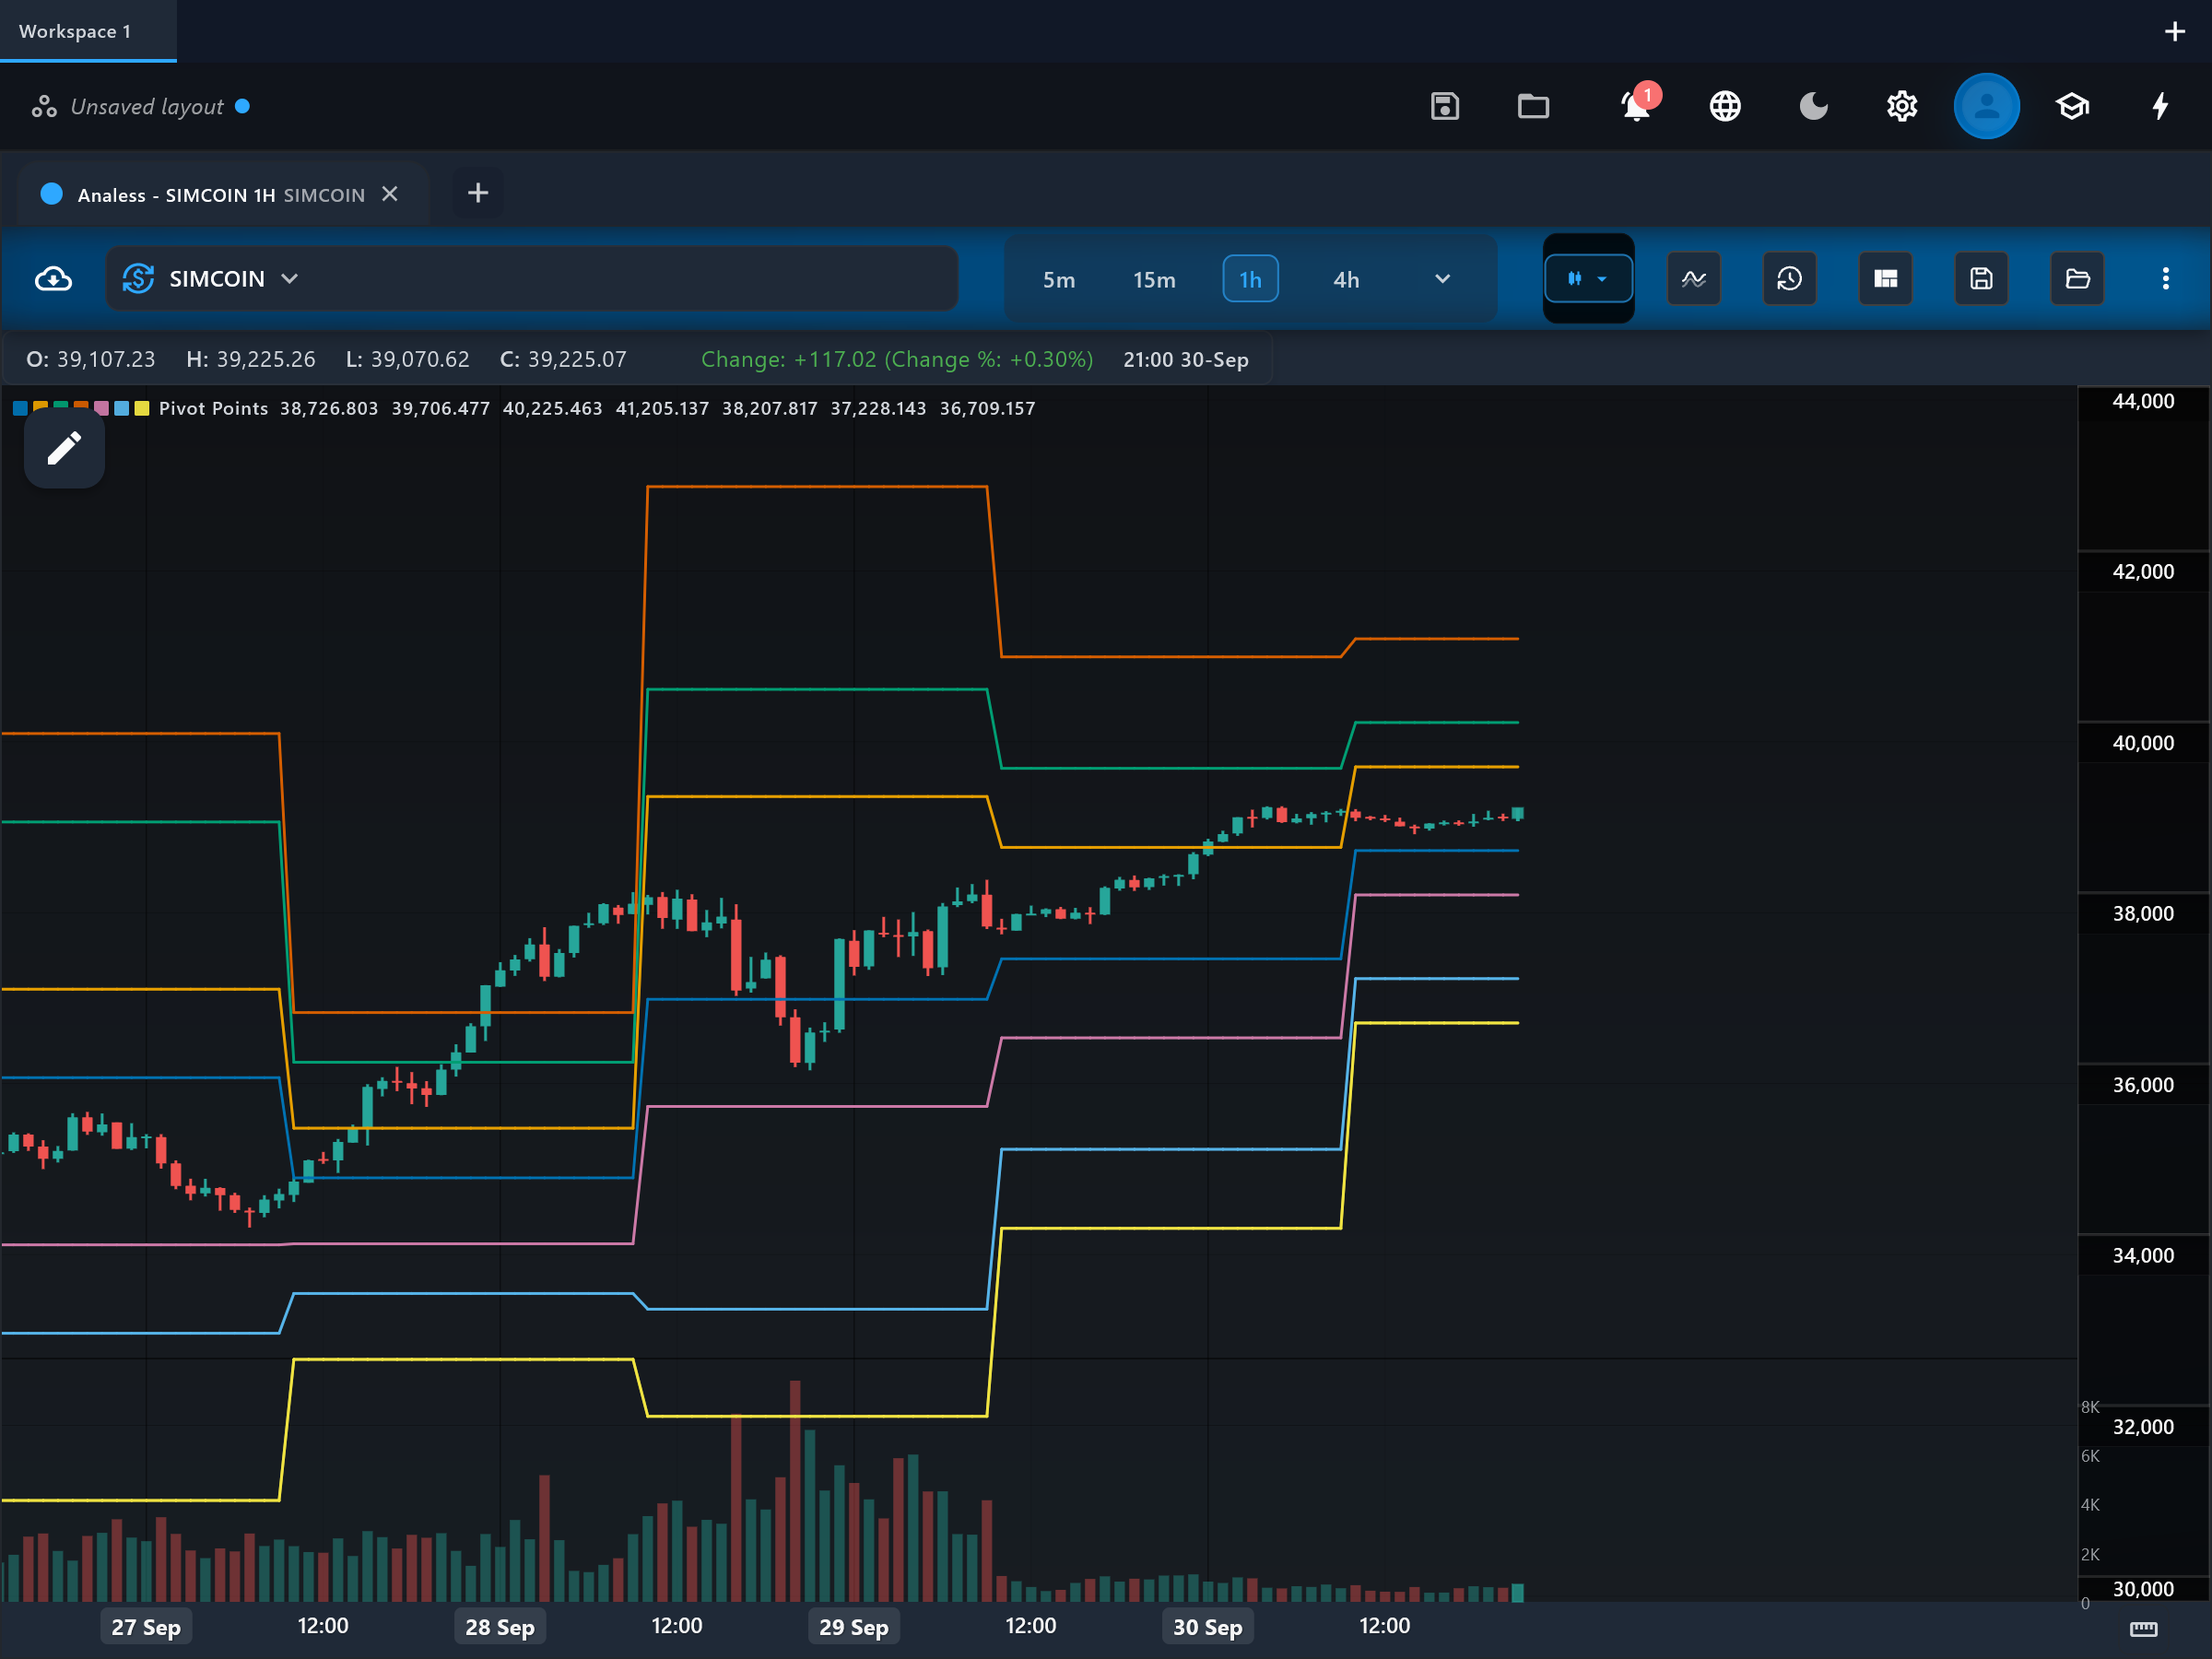
Pivot Points draw a set of horizontal support and resistance levels computed from the previous period's high, low, and close. They are the classic "floor trader" levels: fixed reference prices that many intraday traders watch simultaneously, which is part of why price often reacts around them.
How it is calculated
At the start of each new period the app reads the prior period's high (H), low (L), and close (C) and computes the central pivot PP = (H + L + C) / 3. Resistance and support levels are then derived from PP and the prior range: R1 = 2×PP − L, S1 = 2×PP − H, R2 = PP + (H − L), S2 = PP − (H − L), and a wider R3/S3 pair. The levels stay flat for the whole period and step to new values when the next period begins.
How to read it
The indicator plots seven flat lines on the price chart: the central pivot PP, resistances R1, R2, and R3 above it, and supports S1, S2, and S3 below it. Price trading above PP is conventionally read as a bullish bias for the period; below PP as bearish. R1/S1 are the first levels where a move often pauses or reverses, while R2/S2 and R3/S3 mark progressively stronger extensions that price reaches less often. Because the lines come from completed prior-period data, they never move during the current period.
What to look for
- Price crossUpside
Price holds above the central pivot PP, or dips to S1 and bounces — a bullish bias for the period.
- Price crossDownside
Price stays below PP, or rallies to R1 and stalls — a bearish bias for the period.
- Range expansionUpside
A decisive close above R1 that holds often continues toward R2, then R3.
- Range expansionDownside
A decisive close below S1 that holds often extends toward S2, then S3.
When to use it
Pivot Points are most popular for intraday trading of liquid instruments — index futures, major forex pairs, and large-cap stocks — where daily pivots frame the session. Weekly and monthly anchors suit swing trading. They are least useful on illiquid symbols where prior-period extremes are noisy, and after large overnight gaps, which can leave the whole level set far from where price is actually trading.
Works well with
Settings explained
method- The level formula family. Traditional (the default) is the classic floor-trader set described above. Fibonacci places R and S levels at 38.2% and 61.8% of the prior range around PP. Camarilla produces tighter levels clustered near the prior close, aimed at intraday fading. Woodie weights the close twice in the pivot formula, and Classic is the plain arithmetic variant. All families use the same prior-period inputs — only the spacing of the levels changes.
anchor- The period each pivot set is computed from: daily (the default, the classic intraday setup), weekly, monthly, or yearly. Longer anchors produce fewer, more widely watched levels — weekly and monthly pivots suit swing charts, yearly pivots mark institutional reference levels.
Limitations and common mistakes
- The levels are purely mechanical — nothing guarantees price will react at them. They matter mostly because many participants watch the same numbers.
- After a large gap the entire level set can sit far above or below the current price, making PP and the near levels irrelevant for that period.
- Different platforms use slightly different session boundaries (exchange close vs. midnight UTC), so pivot values can differ between apps for the same symbol.
- In a strong trend, price can slice through R1/R2 or S1/S2 without pausing — pivots work best when the period trades a range.
References
- Origin: Floor traders, early 20th century.
- Pivot point (technical analysis) — Wikipedia (opens in a new tab)
This page explains how an indicator is calculated and read. It describes past data, not what price will do next, and it is not a recommendation to trade. Read the disclaimers.
Try it in Analess
Add Pivot Points to any chart, adjust its settings, and open this explainer from the indicator itself.