















Indicators · Bands & channels
Bollinger Bands
A moving average with bands set a number of standard deviations away — a volatility envelope around price.
Origin: John Bollinger, 1980s
- Best suited to
- Any market condition
- Responsiveness
- Lagging
- Family
- Bands & channels
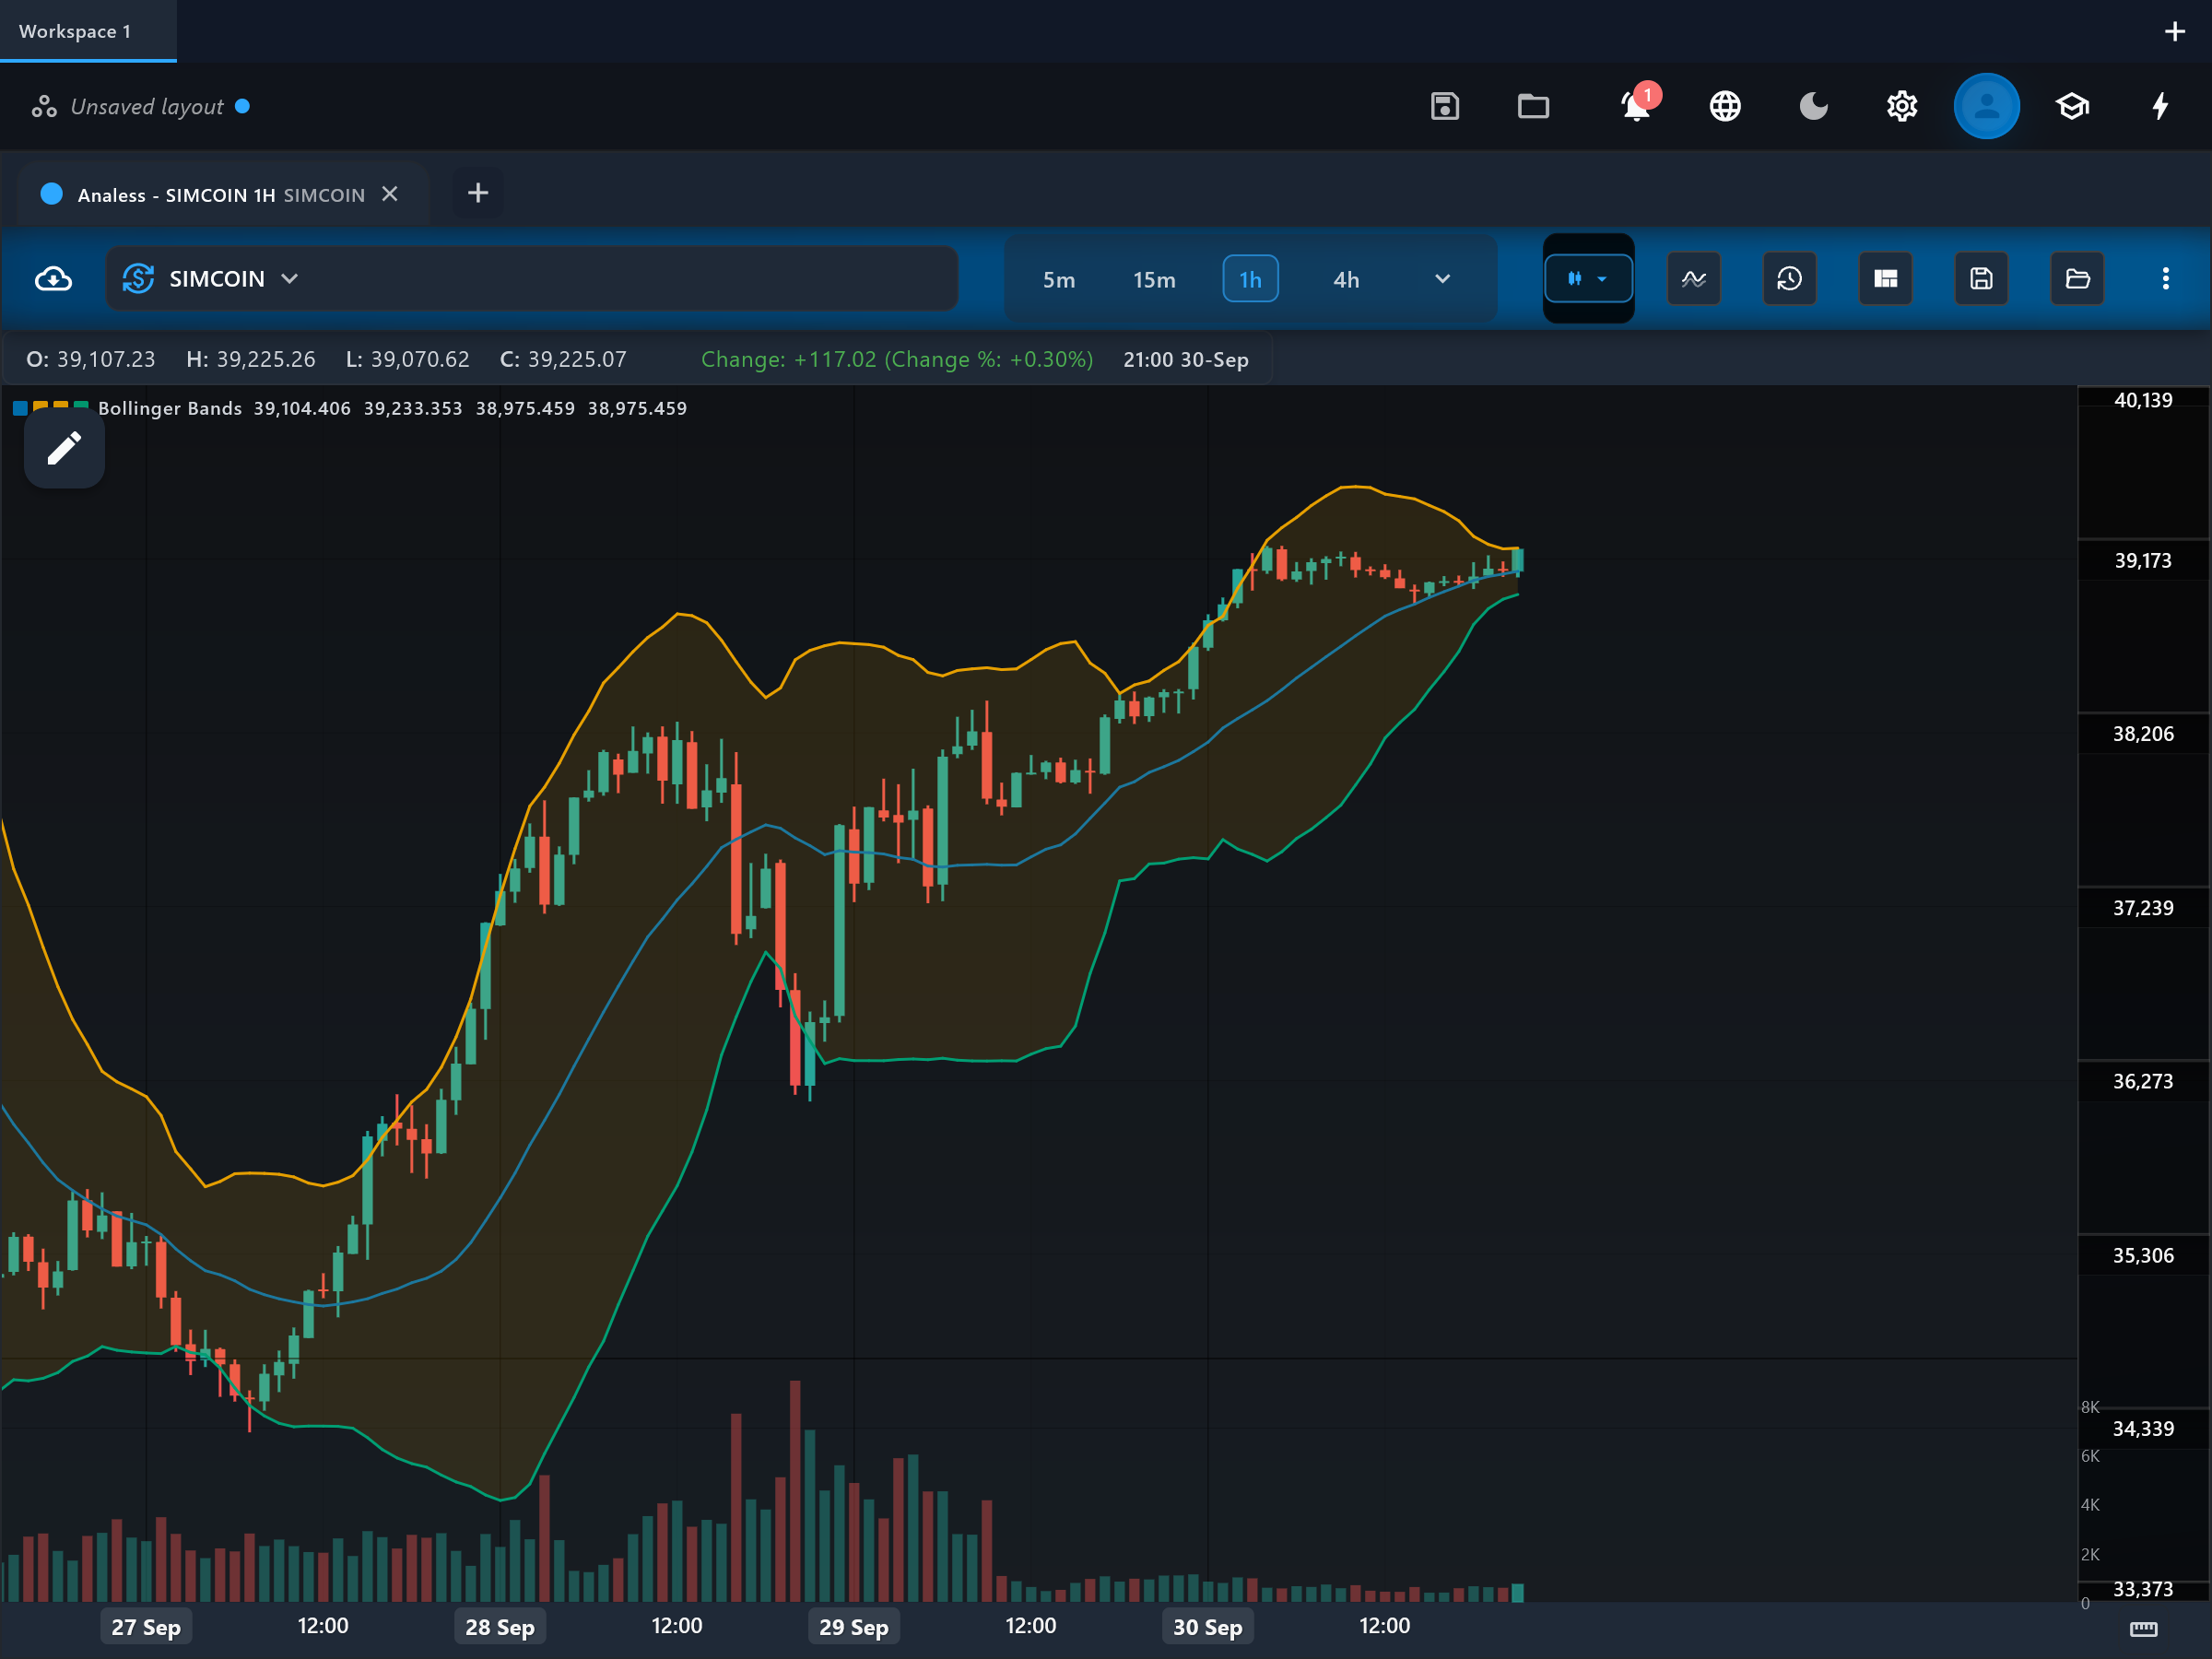
What it is
Bollinger Bands wrap price in a statistically-scaled envelope: a moving-average middle line with bands above and below it that widen when the market is volatile and tighten when it is quiet. They give an at-a-glance answer to "is price high or low relative to its recent, volatility-adjusted range?"
How it is calculated
The middle line is a simple moving average of the source over period (default 20). The rolling standard deviation of the same source (population form, as Bollinger specifies) is multiplied by multiplier (default 2.0) and added to and subtracted from the middle to form the upper and lower bands. With the default settings, roughly 85-90 percent of closes fall inside the bands in practice, so touches of the edges are notable events.
How to read it
Three overlay lines are drawn on the price chart: middle, upper, and lower, with the region between the bands shaded. In a sideways market, price tends to oscillate between upper and lower, and the middle SMA acts as the equilibrium. In a trend, price can hug one band for extended stretches — a "band walk" — and the middle band often serves as the pullback support or resistance. The distance between the bands is the volatility gauge: pinched bands (a squeeze) mean energy is building, flaring bands mean it is being released.
What to look for
- SqueezeContext
The squeeze: upper and lower pinching to their tightest in months marks a volatility contraction: the market is unusually quiet relative to its own recent range. The squeeze itself says nothing about direction.
- Trend filterUpside
A band walk up the upper band — repeated closes at or above it with shallow pullbacks that hold the middle line — is a hallmark of a strong uptrend, not by itself evidence that the advance has stretched too far.
- Trend filterDownside
The mirror-image walk down the lower band marks a strong downtrend; buying just because price touched the lower band fights the trend.
- Overbought / oversoldContext
In a confirmed range, tags of upper or lower mark statistically stretched prices that often revert toward middle — the mean-reversion read, valid only outside strong trends.
- Turning patternContext
Bollinger's W-bottom and M-top: price makes a second low/high that stays INSIDE the band while the first pierced it — a volatility-adjusted divergence that flags weakening momentum.
When to use it
One of the most versatile overlays — useful on stocks, crypto, and forex across all timeframes, for both mean-reversion (in ranges) and trend-strength reading (band walks). The critical skill is diagnosing the regime first, because the two readings of a band touch are opposites. Band touches alone are not signals; John Bollinger himself stresses they require confirmation from other evidence.
Works well with
Settings explained
period- The SMA and standard-deviation lookback (default 20, Bollinger's recommendation). Shorter periods hug price and produce more band touches; longer periods describe a slower equilibrium.
multiplier- How many standard deviations the bands sit from the middle (default 2.0). Bollinger suggested nudging it with period — about 1.9 at period 10 and 2.1 at period 50 — so the share of closes inside the bands stays roughly constant.
source- The price the average and deviation are computed on (default close).
Limitations and common mistakes
- A band touch is not a signal by itself — in trends the "wrong" band gets ridden for weeks.
- The bands react to volatility after it happens; they are built from a lagging average and a lagging deviation.
- Price is not statistically normal, so the textbook "95 percent within two standard deviations" intuition overstates how rare band breaks are.
References
- Origin: John Bollinger, 1980s.
- Bollinger Bands — Wikipedia (opens in a new tab)
This page explains how an indicator is calculated and read. It describes past data, not what price will do next, and it is not a recommendation to trade. Read the disclaimers.
Try it in Analess
Add Bollinger Bands to any chart, adjust its settings, and open this explainer from the indicator itself.