















Indicators · Bands & channels
Keltner Channels
A moving average with ATR-based bands — an alternative to Bollinger Bands.
Origin: Chester Keltner, 1960; ATR version by Linda Bradford Raschke, 1990s
- Best suited to
- Trending markets
- Responsiveness
- Lagging
- Family
- Bands & channels
What it is
Keltner Channels are a volatility envelope like Bollinger Bands, but scaled by Average True Range instead of standard deviation. Because ATR changes more smoothly than standard deviation, the channels breathe more gently and give steadier trend-following reads.
How it is calculated
This app implements the modern Raschke-style version. The center of the channel follows an exponential moving average (EMA) of the source over emaPeriod (default 20), and the upper and lower channel lines sit multiplier (default 2.0) times the ATR above and below it, where ATR is Wilder's smoothed true range over atrPeriod (default 10). Keltner's 1960 original used a simple average of typical price and the raw high-low range; the ATR/EMA form is the one in universal use today.
How to read it
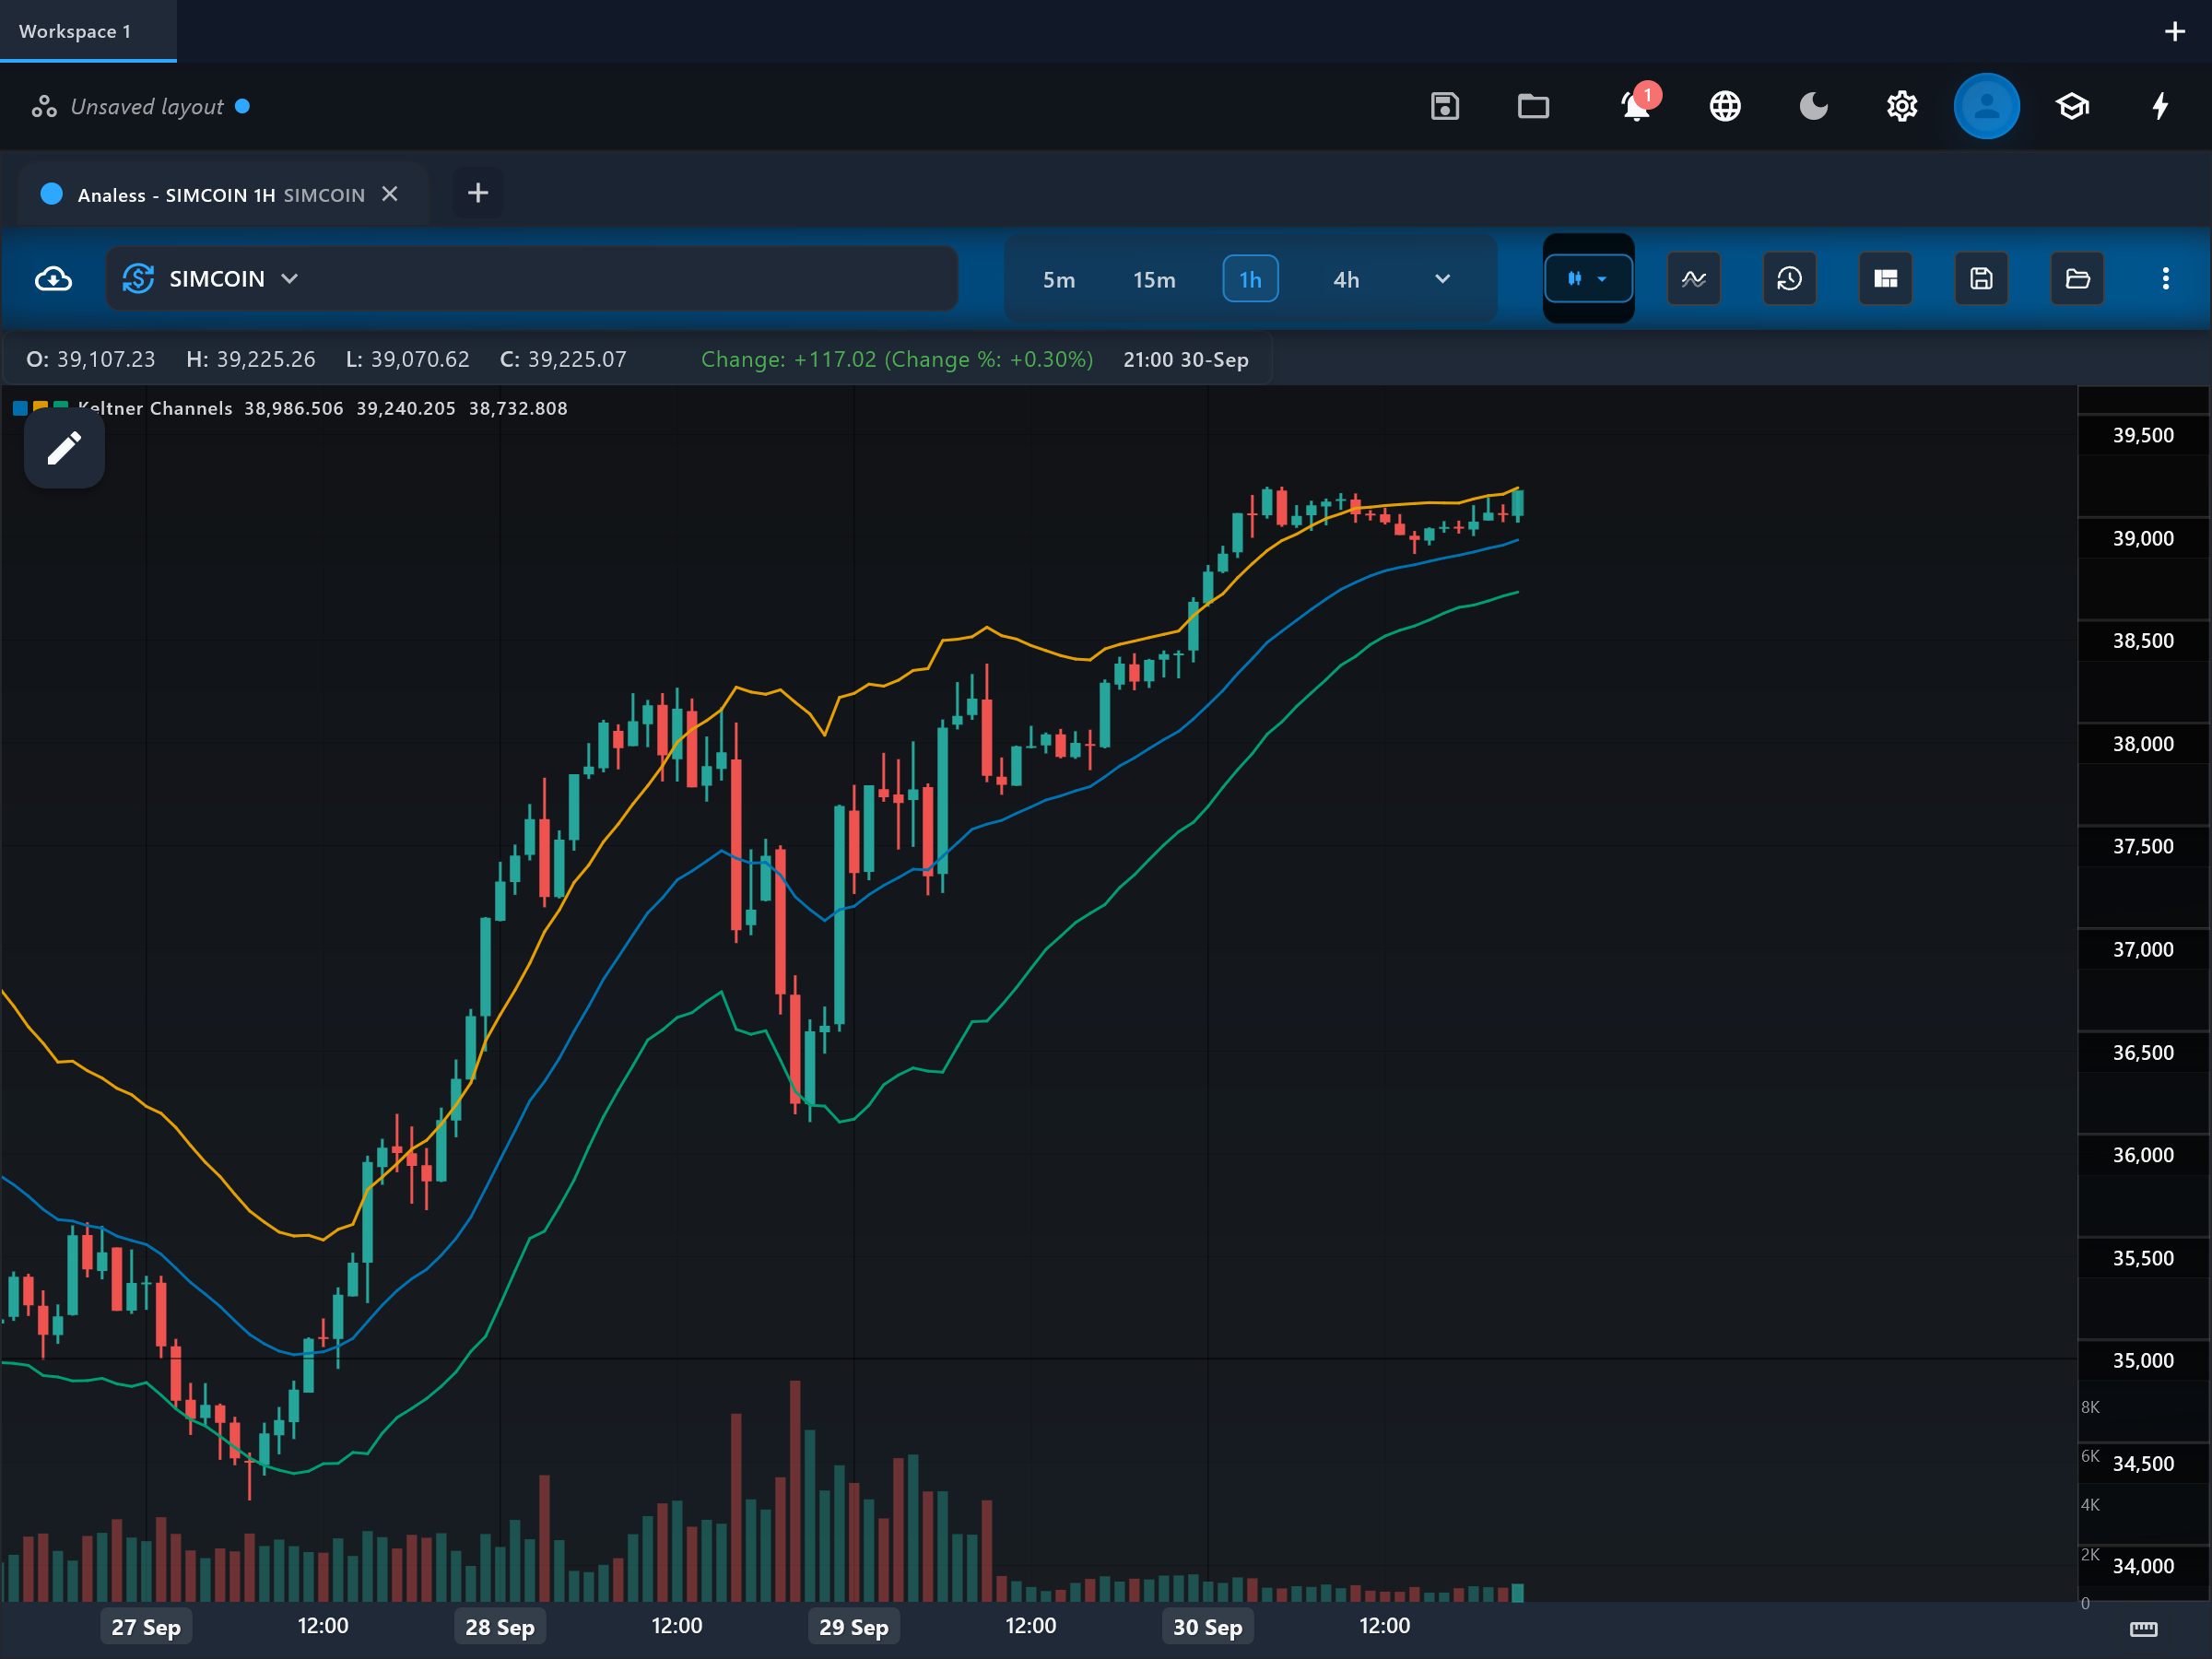
Three overlay lines are drawn on the price chart: middle, upper, and lower. The middle EMA is the trend reference — price holding above it leans bullish, below it bearish. Closes beyond upper or lower are stronger statements than with Bollinger Bands, because ATR-based channels expand less explosively; a close outside the channel often marks genuine trend strength rather than an automatic reversion setup. Riding along a channel edge with pullbacks that hold the middle line is the classic trend-continuation picture.
What to look for
- Trend filterUpside
Consecutive closes above upper with the middle EMA rising signal a strong uptrend in progress — a continuation read, not an overbought warning.
- Trend filterDownside
Consecutive closes below lower with the middle EMA falling mark strong downside momentum.
- Price crossContext
Pullbacks to the middle line that hold and turn are the standard trend-entry location inside an established channel ride.
- SqueezeContext
The TTM-style squeeze: when Bollinger Bands contract to fit entirely INSIDE the Keltner Channel, volatility is unusually compressed and a directional expansion often follows.
When to use it
Best on markets that trend cleanly — index futures, large-cap stocks, major forex pairs — on intraday through daily timeframes. Traders often prefer Keltner over Bollinger for trend-following because the smoother ATR scaling produces fewer head-fake band breaks. In violent chop the channel edges get crossed repeatedly and the trend reads degrade; the channel direction itself carries the only directional information.
Works well with
Settings explained
emaPeriod- The middle EMA length (default 20). It sets the trend reference — shorter values track price tightly, longer values define a slower baseline.
atrPeriod- The ATR lookback that scales the channel (default 10). Longer values steady the channel width; shorter values let it adapt to volatility shifts faster.
multiplier- How many ATRs the channel sits from the middle (default 2.0). Larger multipliers make outside-the-channel closes rarer and more significant.
source- The price the middle EMA is computed on (default close).
Limitations and common mistakes
- All three lines are built from smoothed inputs, so the channel lags fast reversals.
- The same channel touch means opposite things in trends (strength) and ranges (stretch) — the indicator does not label the regime for you.
- Because ATR ignores nothing (it includes gaps), a single huge bar widens the channel for many bars afterward.
References
- Origin: Chester Keltner, 1960; ATR version by Linda Bradford Raschke, 1990s.
- Keltner channel — Wikipedia (opens in a new tab)
This page explains how an indicator is calculated and read. It describes past data, not what price will do next, and it is not a recommendation to trade. Read the disclaimers.
Try it in Analess
Add Keltner Channels to any chart, adjust its settings, and open this explainer from the indicator itself.