















Indicators · Momentum & oscillators
RSI
Relative Strength Index — measures the speed and size of recent moves on a 0–100 scale.
Origin: J. Welles Wilder, 1978
- Best suited to
- Ranging markets
- Responsiveness
- Leading
- Family
- Momentum & oscillators
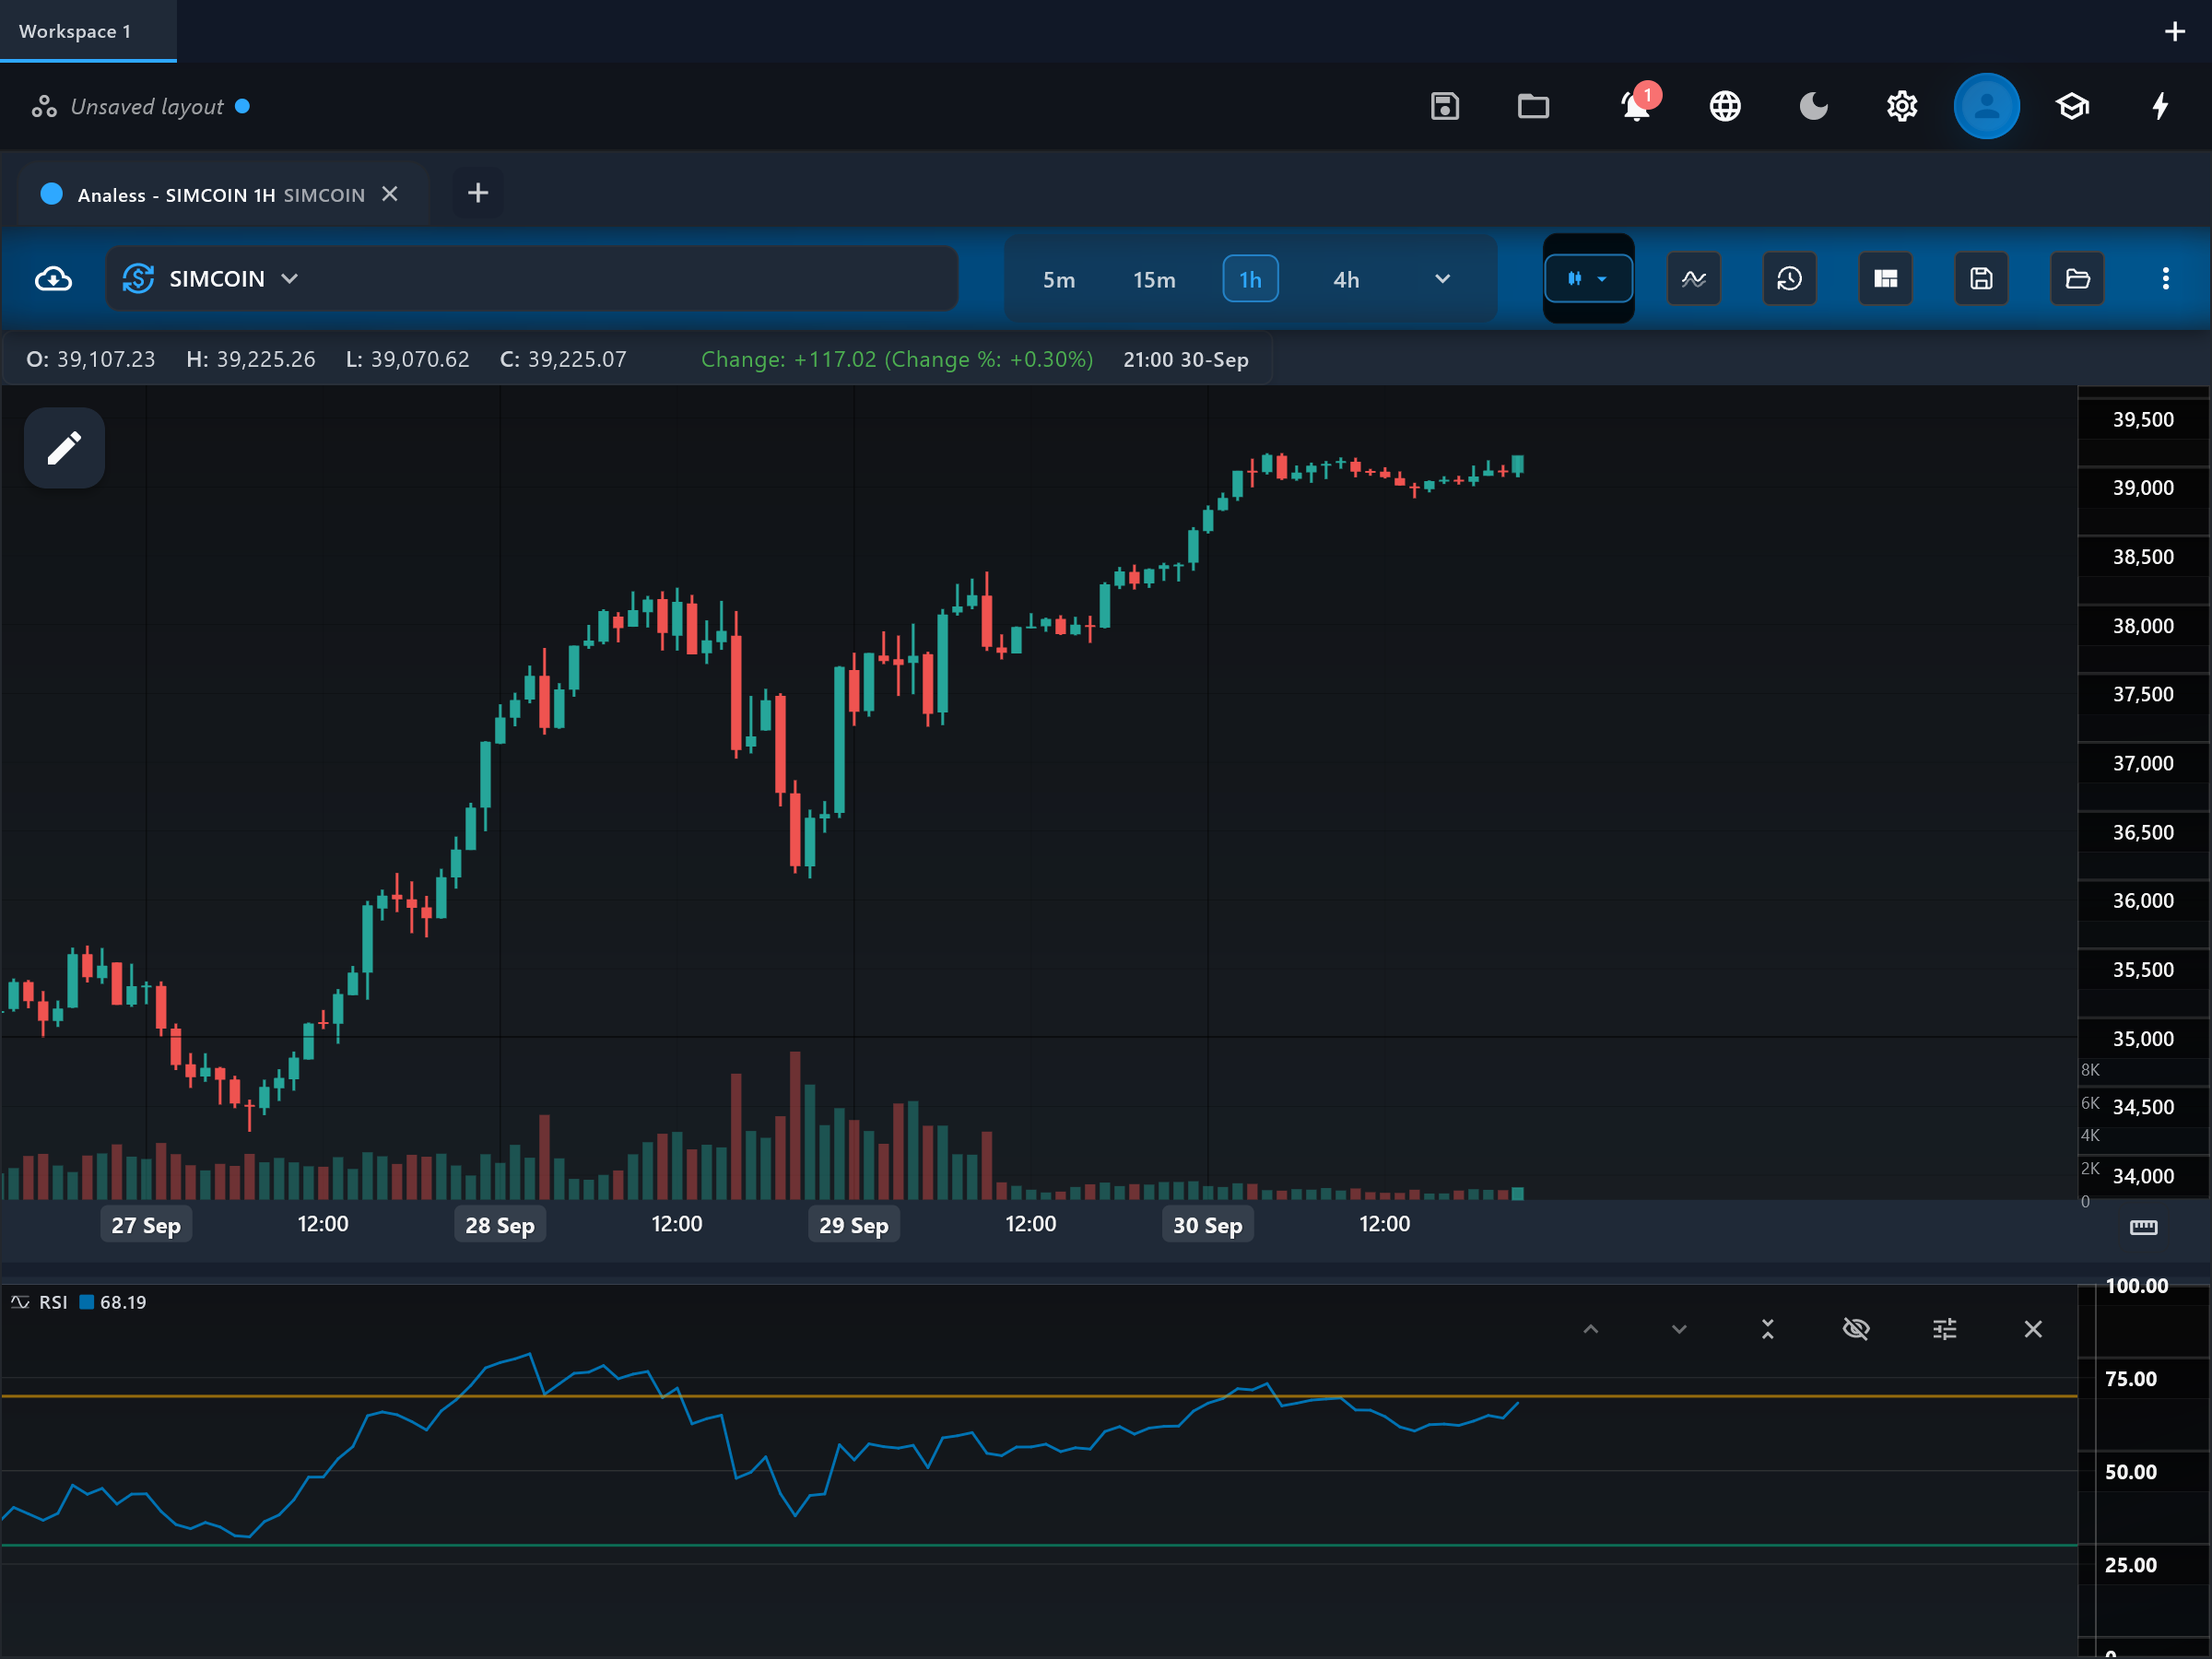
What it is
The Relative Strength Index (RSI) measures how quickly and how far price has moved recently, on a fixed 0-100 scale. It compares the size of recent gains to recent losses to show whether buying or selling pressure is dominating. It is one of the most widely used momentum oscillators.
How it is calculated
RSI takes the average gain and average loss of the chosen source price over the lookback period (Wilder smoothing), forms their ratio, and rescales it to 0-100: RSI = 100 - 100 / (1 + average gain / average loss). When gains dominate, RSI rises toward 100; when losses dominate, it falls toward 0.
How to read it
The pane shows one main line, "rsi", between two horizontal guide lines: "overbought" (default 70) and "oversold" (default 30). Readings above the overbought line suggest the recent advance has been unusually fast; readings below the oversold line suggest the recent decline has been unusually fast. The 50 midline acts as an informal trend gauge: RSI holding above 50 accompanies rising markets, below 50 falling ones. Watch how the line behaves at the guide levels rather than treating a single touch as a signal.
What to look for
- Overbought / oversoldContext
RSI above the overbought line (70) flags a stretched advance; below the oversold line (30) flags a stretched decline. In a strong trend RSI can stay pinned in these zones for a long time, so the exit from the zone is often watched more than the entry.
- DivergenceUpside
Bullish divergence: price makes a lower low while RSI makes a higher low, showing downside momentum is fading.
- DivergenceDownside
Bearish divergence: price makes a higher high while RSI makes a lower high, showing upside momentum is fading.
- Centre-line crossContext
Crosses of the 50 midline are a rough momentum-direction gauge: above 50 gains dominate, below 50 losses dominate.
When to use it
RSI works on any liquid market and timeframe and is most informative in ranging or gently trending conditions, where the overbought and oversold zones mark realistic turning areas. In a strong trend a bounded oscillator misleads: RSI can sit above 70 through an entire rally, and selling every overbought reading fights the trend. In those conditions treat RSI zones as trend strength, not reversal signals.
Works well with
Settings explained
period- Default 14 (Wilder's original). Lower values (7-10) make RSI faster and more sensitive, reaching the zones more often; higher values (21-25) smooth it and produce fewer, slower signals.
source- Default close. Choosing another price source (open, high, low, hl2, hlc3, ohlc4) changes which price the gains and losses are measured from; close is the standard choice.
overboughtLevel- Default 70 — the upper guide level drawn on the pane. Tighten it (lower, e.g. 65) for choppier markets, or loosen it (raise, e.g. 80) for strong trends so fewer readings count as overbought.
oversoldLevel- Default 30 — the lower guide level drawn on the pane. Tighten it (raise, e.g. 35) for choppier markets, or loosen it (lower, e.g. 20) for strong downtrends so fewer readings count as oversold.
Limitations and common mistakes
- In strong trends RSI stays overbought or oversold for extended periods, so zone touches alone are not reversal signals.
- Divergences can persist or fail; momentum fading does not guarantee price will turn.
- Short lookback periods produce many whipsaw readings in quiet, low-volatility markets.
References
- Origin: J. Welles Wilder, 1978.
- Relative strength index — Wikipedia (opens in a new tab)
This page explains how an indicator is calculated and read. It describes past data, not what price will do next, and it is not a recommendation to trade. Read the disclaimers.
Try it in Analess
Add RSI to any chart, adjust its settings, and open this explainer from the indicator itself.