















Indicators · Bands & channels
Envelopes
Two bands offset from a moving average by a fixed percentage, one on each side.
Origin: Classical construct, predating the volatility bands—no single originator
- Best suited to
- Ranging markets
- Responsiveness
- Lagging
- Family
- Bands & channels
What it is
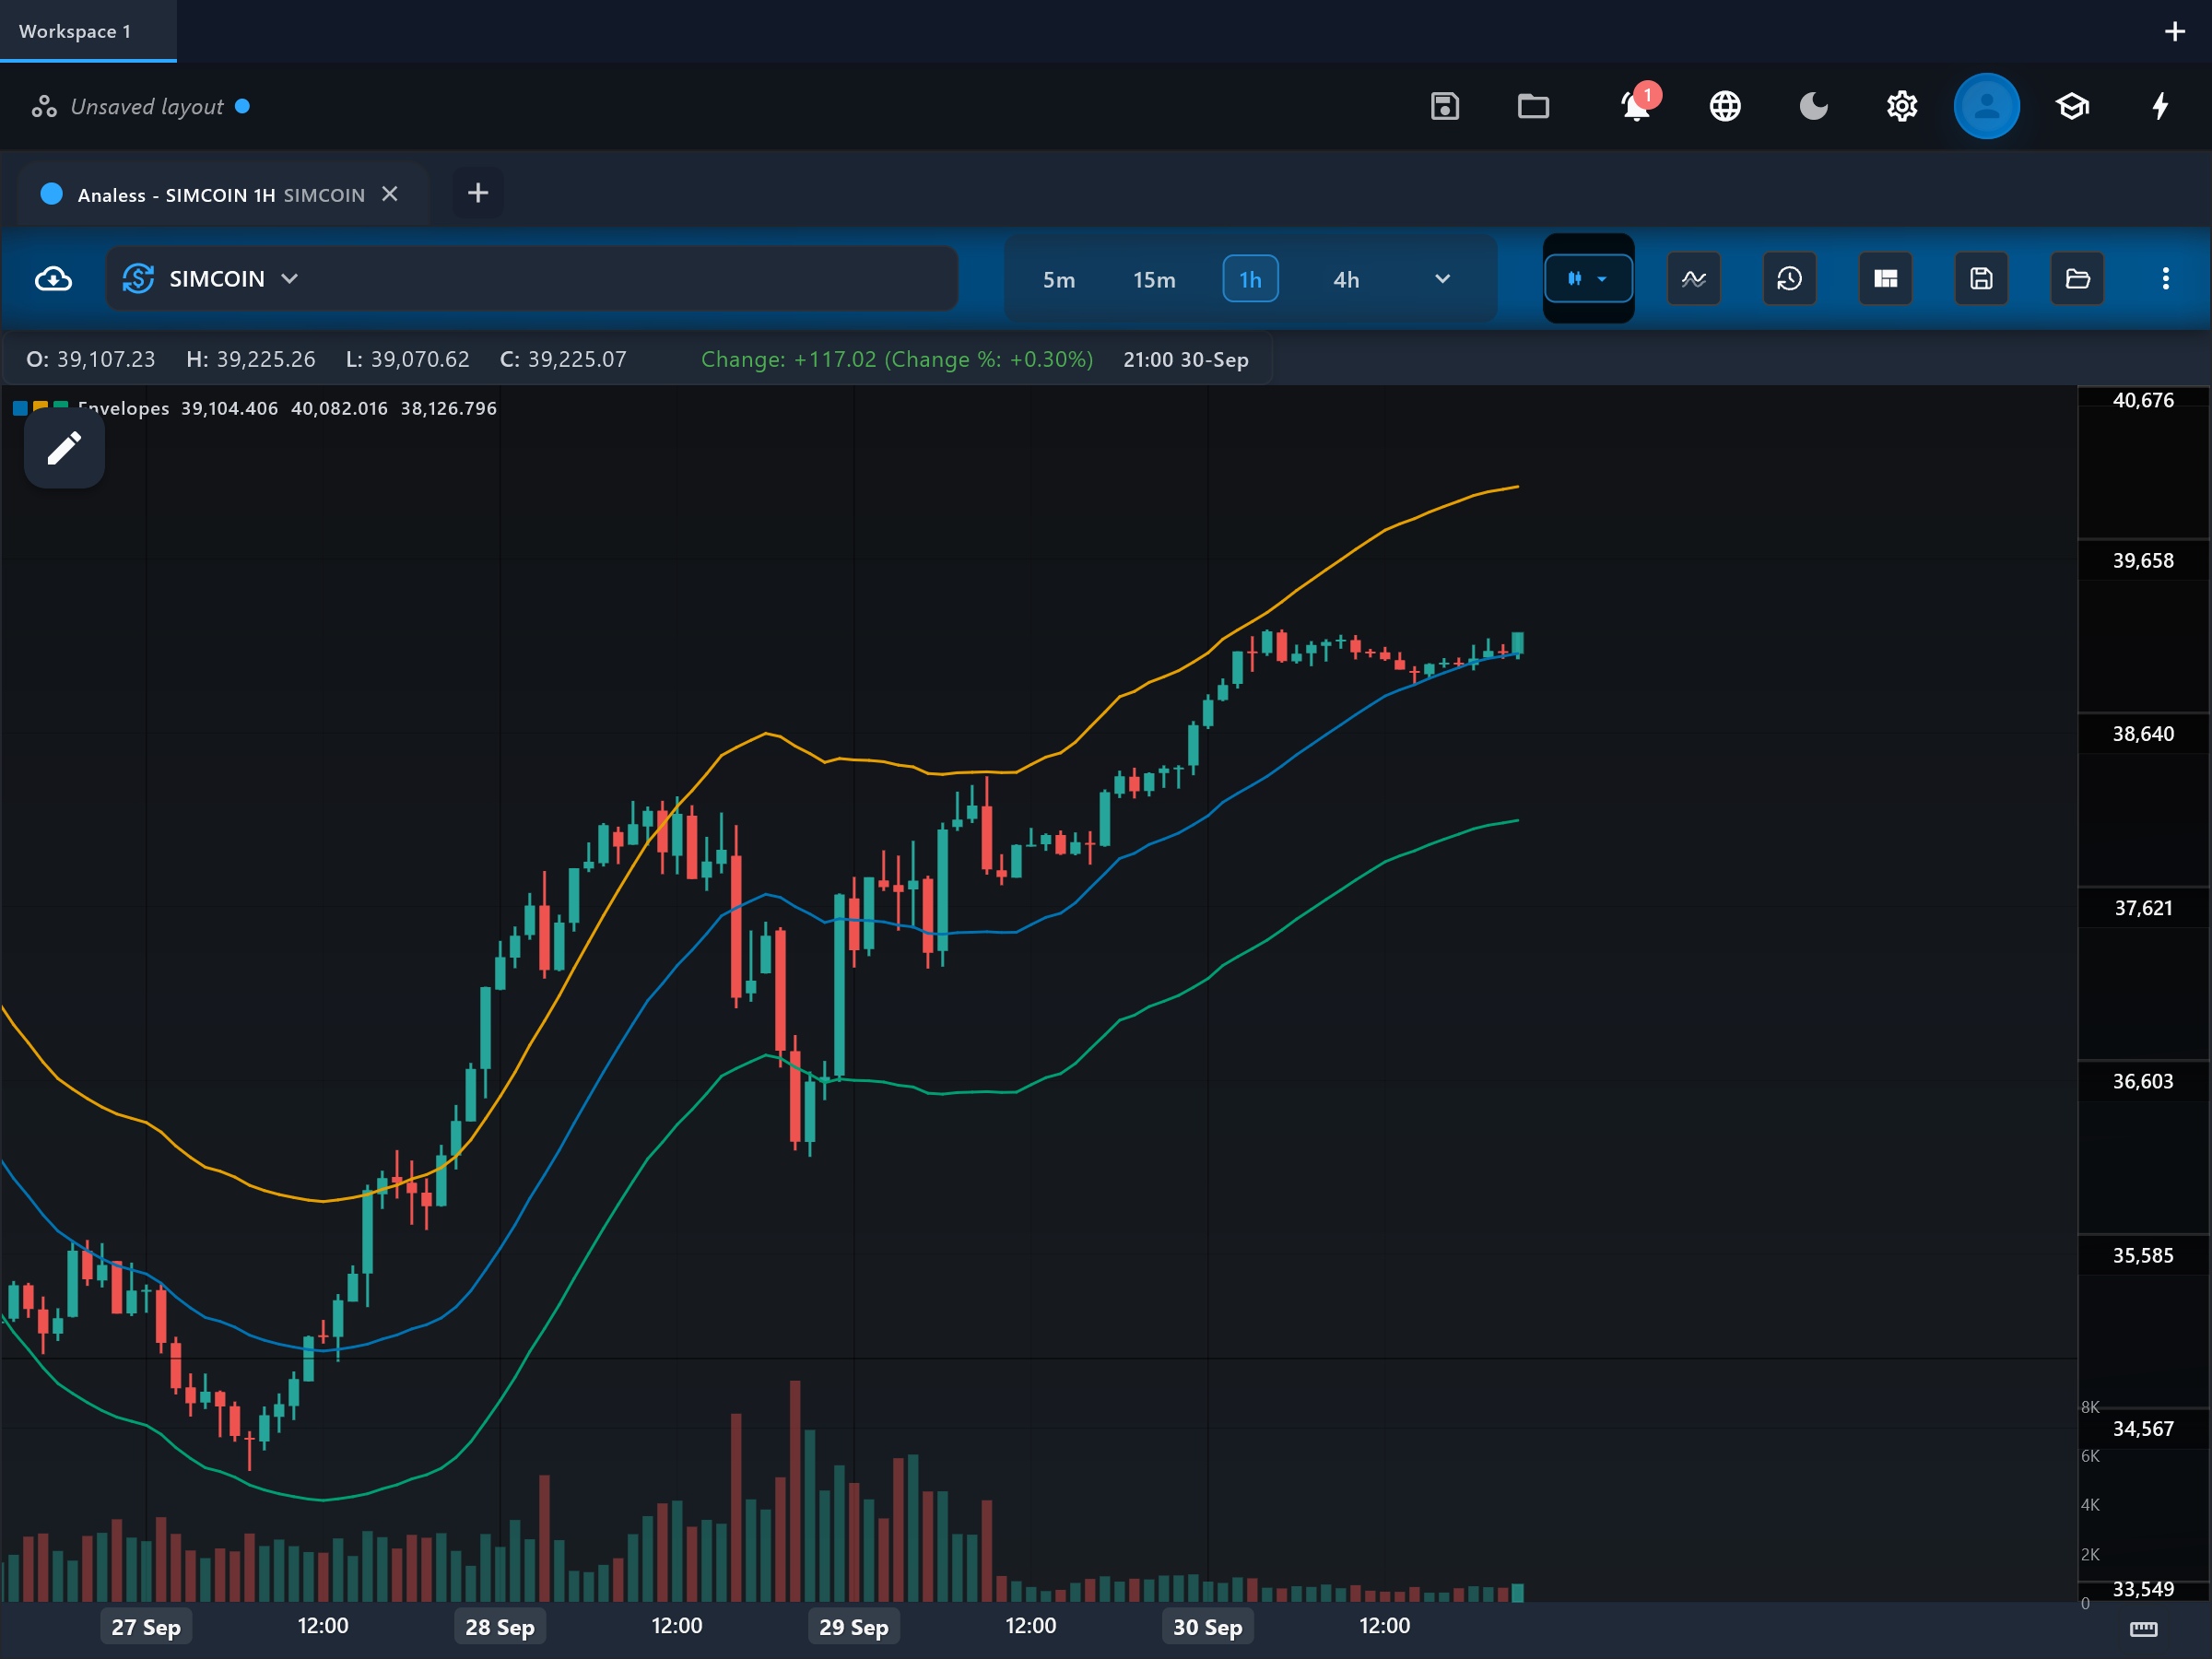
Envelopes (Moving Average Envelopes) plot two lines offset from a moving average by a fixed percentage, one above and one below, which forms a simple corridor around the trend. They are the oldest and simplest of the band overlays — no volatility math, just "how far from average is price?"
How it is calculated
A moving average of the source is computed over period (default 20) using the selected maType (simple by default; exponential, weighted, or linear-regression smoothing are available). The upper line is that average multiplied by (1 + upperPercent/100) and the lower line by (1 − lowerPercent/100), with both percentages defaulting to 2.5. Unlike Bollinger or Keltner bands, the offset is constant — the envelope does NOT widen or narrow with volatility.
How to read it
Three overlay lines are drawn on the price chart: middle (the moving average), upper, and lower. In a range, price tagging upper suggests it is stretched above its average and prone to reverting, while tags of lower suggest the opposite. In a trend, price can ride outside one envelope line for long stretches, so a breakout beyond the envelope can equally be read as trend strength. Because the width is fixed, the right percentage is the one that contains "normal" price action for this specific symbol and timeframe — expect to tune it.
What to look for
- Overbought / oversoldDownside
In a sideways market, price reaching upper marks a stretched condition that often reverts toward middle.
- Overbought / oversoldUpside
In the same conditions, price reaching lower marks a stretched decline prone to snapping back.
- Range expansionContext
A decisive close beyond the envelope after a quiet spell can mark the start of a trend leg strong enough to escape the fixed corridor.
- Price crossContext
Crosses of the middle average carry the same meaning as any moving-average cross: a basic shift in short-term bias.
When to use it
Best on instruments whose volatility is fairly stable — mature large-cap stocks, major forex pairs — where a fixed percentage stays meaningful for months. On symbols whose volatility swings widely (crypto especially), a fixed envelope is alternately too tight and too loose; Bollinger Bands or Keltner Channels adapt automatically and are usually the better choice there. The band-touch reads assume a ranging market.
Works well with
Settings explained
period- The moving-average length (default 20). It sets the centerline's responsiveness, exactly as for a standalone moving average.
maType- The smoothing method of the centerline (default simple; exponential, weighted, and linear are available). Exponential reacts faster to recent price.
upperPercent- How far above the average the upper line sits, in percent (default 2.5). Tune it so normal fluctuations stay inside — volatile symbols need a larger value.
lowerPercent- How far below the average the lower line sits, in percent (default 2.5). It can be set differently from upperPercent to make the corridor asymmetric.
source- The price the centerline averages (default close).
Limitations and common mistakes
- The fixed-percentage width ignores volatility — the same 2.5 percent is far too wide in quiet markets and far too narrow in wild ones.
- The right percentage differs per symbol and timeframe, so the defaults almost always need tuning.
- In trends, envelope touches are strength, not reversal — the same regime trap as every band overlay.
References
- Origin: Classical construct, predating the volatility bands—no single originator.
- Moving average envelope — Wikipedia (opens in a new tab)
This page explains how an indicator is calculated and read. It describes past data, not what price will do next, and it is not a recommendation to trade. Read the disclaimers.
Try it in Analess
Add Envelopes to any chart, adjust its settings, and open this explainer from the indicator itself.