















Indicators · Volatility
Bollinger Bands Width
Measures how wide the Bollinger Bands are, tracking expansion and contraction of volatility.
Origin: John Bollinger, 1980s
- Best suited to
- Any market condition
- Responsiveness
- Lagging
- Family
- Volatility
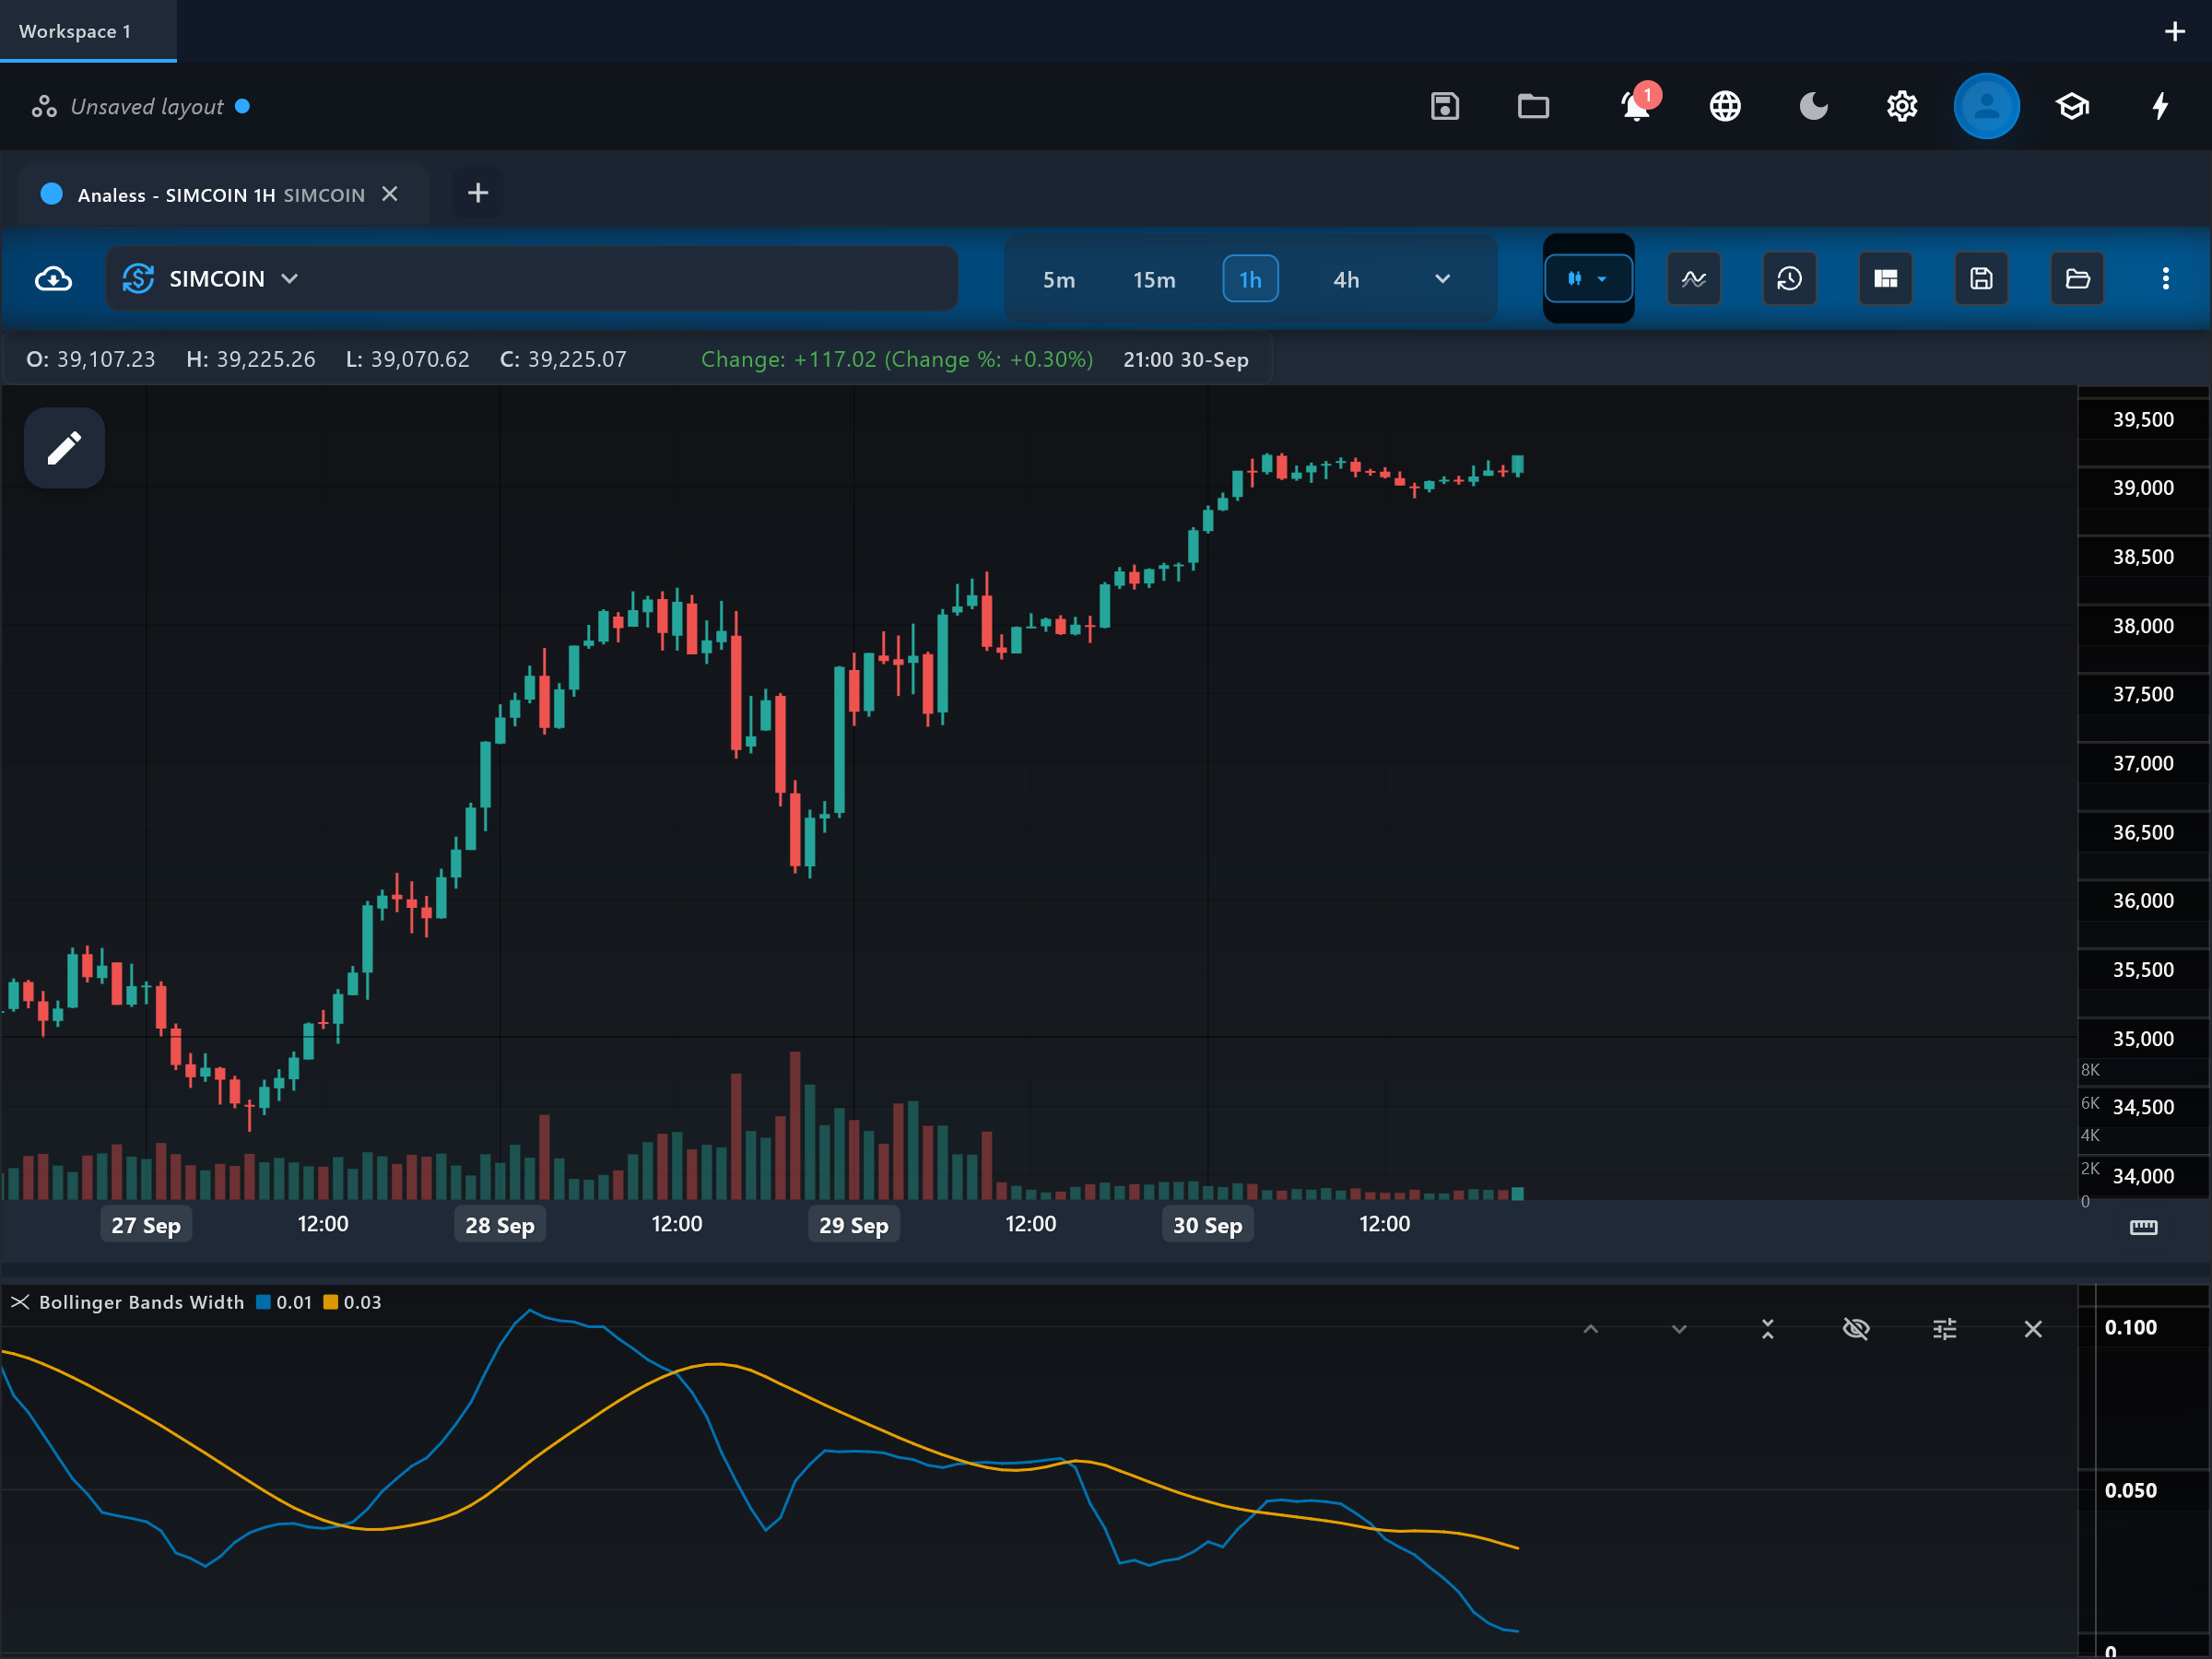
What it is
Bollinger Bands Width (BBW) distills the distance between the upper and lower Bollinger Bands into a single line, so you can see the volatility cycle — contraction, squeeze, expansion — at a glance. It is the standard tool for spotting the "Bollinger squeeze".
How it is calculated
The indicator builds standard Bollinger Bands (an SMA of the source over period, plus and minus multiplier standard deviations) and computes the normalized width: (upper − lower) divided by the middle band. Dividing by the middle band makes the value comparable across price levels. A simple moving average of the width over averagePeriod is plotted alongside as a reference line.
How to read it
Two lines are drawn in their own pane: bbw, the normalized band width, and average, its rolling mean. When bbw falls to the bottom of its recent range — especially well below average — the bands have contracted into a squeeze, with volatility unusually low relative to its own history. When bbw spikes, a volatile move is in progress; extreme peaks frequently mark exhaustion. The crossover of bbw back above or below average helps time the transition between regimes.
What to look for
- SqueezeContext
bbw at a multi-month low is the classic Bollinger squeeze: volatility has contracted and a breakout in either direction often follows. The squeeze itself does not pick the direction.
- Range expansionContext
A sharp rise in bbw out of a squeeze confirms the breakout is real — width expanding means the bands are opening to let the trend run.
- Signal-line crossContext
bbw crossing above its average line marks the shift from contraction to expansion; crossing back below it suggests the volatile phase is fading.
When to use it
Most valuable on markets that alternate clearly between quiet accumulation and explosive moves — crypto and growth stocks are classic examples — on any timeframe from hourly upward. BBW is non-directional: it flags THAT a move is likely or under way, never WHICH way, so pair it with a directional tool. It is least useful on instruments that grind with steady volatility.
Works well with
Settings explained
period- The Bollinger lookback (default 20, matching standard bands). Shorter periods make width react faster; longer periods emphasize bigger volatility cycles.
multiplier- The standard-deviation multiple (default 2.0). It scales the width uniformly, so changing it mostly rescales the line rather than changing its shape.
averagePeriod- The lookback of the average reference line (default 20). Lengthen it for a slower baseline that makes squeezes stand out more; shorten it for quicker regime-change crossings.
source- The price the underlying bands are computed on (default close).
Limitations and common mistakes
- A squeeze tells you a move may be coming, not when it starts or in which direction — false starts (head fakes) are common.
- What counts as "narrow" is relative to each symbol's own history; there is no universal squeeze threshold.
- Width stays elevated after a big move ends, lagging the return to calm.
References
- Origin: John Bollinger, 1980s.
- Bollinger Bands — Wikipedia (opens in a new tab)
This page explains how an indicator is calculated and read. It describes past data, not what price will do next, and it is not a recommendation to trade. Read the disclaimers.
Try it in Analess
Add Bollinger Bands Width to any chart, adjust its settings, and open this explainer from the indicator itself.