















Indicators · Volatility
Choppiness Index
Rates how trending or sideways the market is, without direction.
Origin: E.W. Dreiss, 1990s
- Best suited to
- Any market condition
- Responsiveness
- Coincident
- Family
- Volatility
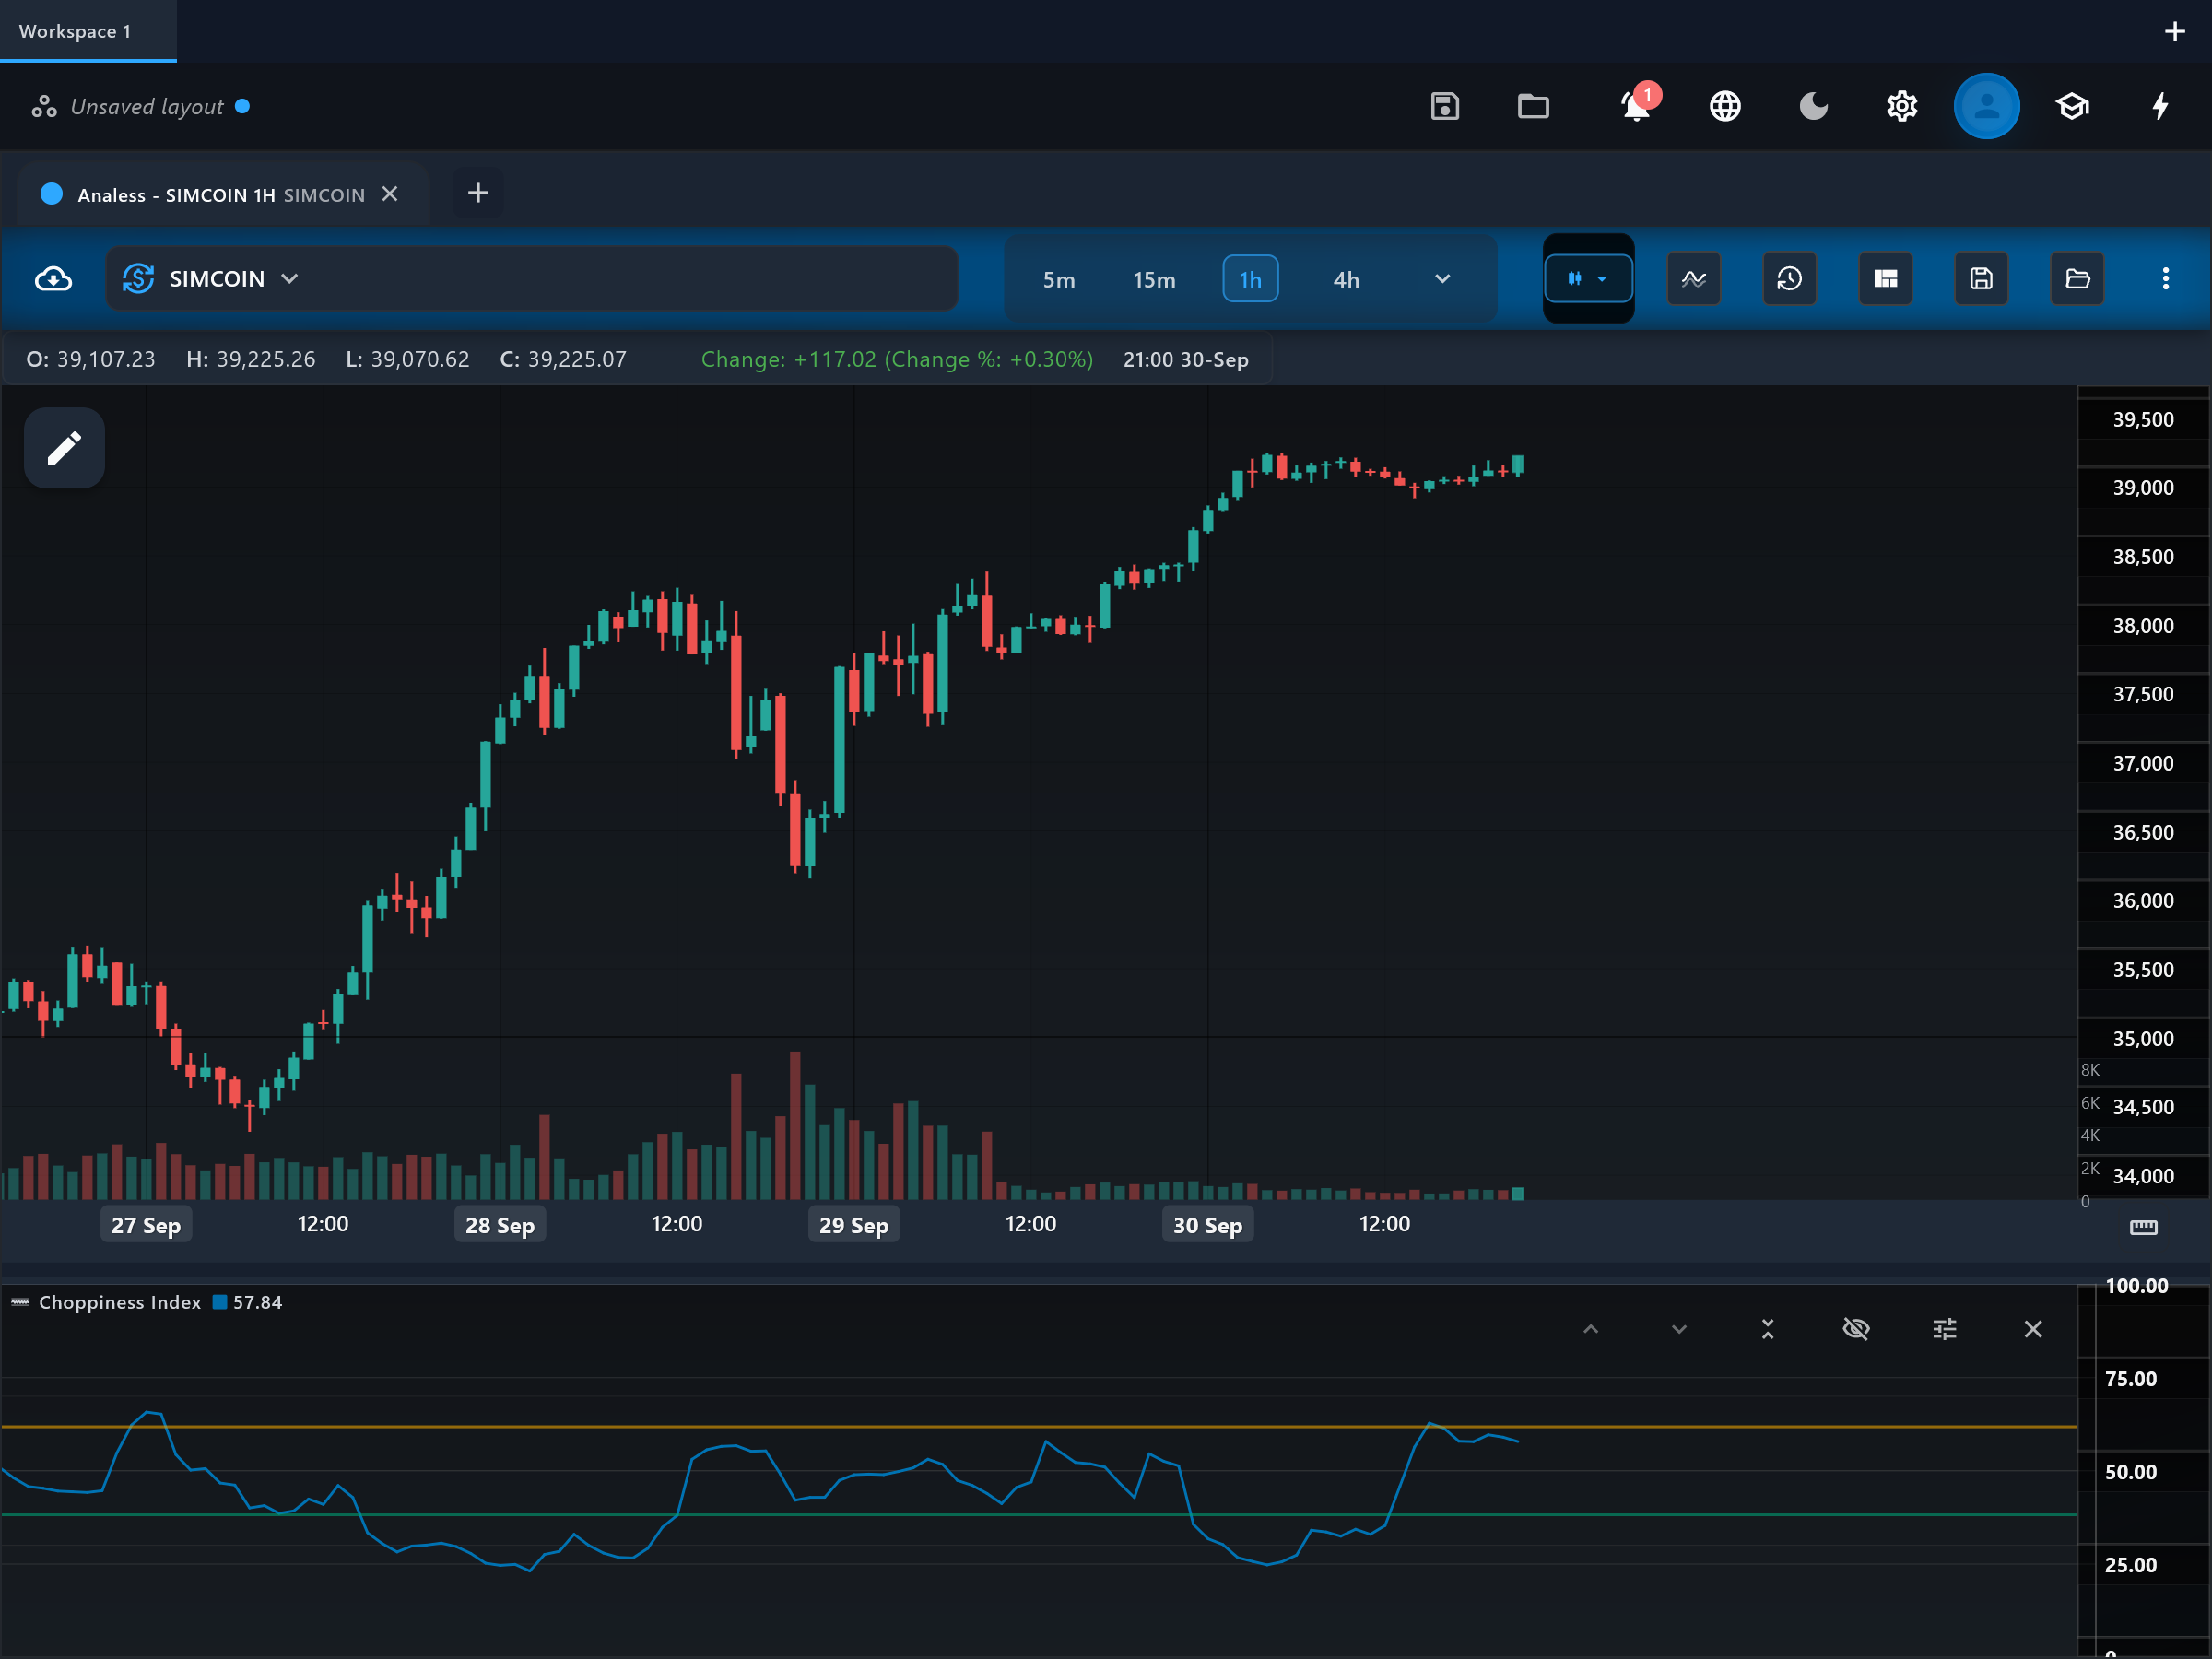
What it is
The Choppiness Index answers one question: is the market trending or chopping sideways? It compresses recent price action into a 0-100 score where HIGH readings mean choppy, directionless trade and LOW readings mean a strong trend is in progress — in either direction.
How it is calculated
Over the chosen period (default 14) it compares the total distance price actually traveled (the sum of true ranges) with the straight-line span of the window (highest high minus lowest low): 100 × log10(sum of TR / (highest high − lowest low)) / log10(period). If price wandered back and forth, the traveled distance dwarfs the net span and the score is high; if price went somewhere efficiently, the two are similar and the score is low.
How to read it
The pane shows the chop line with guides at the Fibonacci-derived levels 61.8 (upper) and 38.2 (lower). Readings above 61.8 mark a consolidating, range-bound market where trend-following signals tend to whipsaw. Readings below 38.2 mark strong directional movement where trend tools shine. The middle zone is transitional. Crucially, a falling chop line says a trend is strengthening but never says whether it is up or down — read the direction from price.
What to look for
- Trend filterContext
chop below 38.2 confirms a trending regime — conditions favor breakout and trend-following approaches over mean-reversion.
- Trend filterContext
chop above 61.8 flags a choppy, range-bound regime where oscillator and fade strategies typically work better than trend entries.
- SqueezeContext
An extended stay at very high chop values marks a tightening consolidation — energy building for the next directional leg.
When to use it
A regime filter for any liquid market and timeframe: run it underneath your directional system and let it tell you which playbook applies. It is explicitly NOT directional — it grades trendiness, never bullishness — so it should never be the reason you buy or sell on its own. It is least informative on very short windows where a single bar can dominate the reading.
Works well with
Settings explained
period- The evaluation window (default 14). Shorter windows switch regime labels quickly but noisily; longer windows give a stabler regime call that lags transitions.
Limitations and common mistakes
- Completely non-directional — a reading of 25 could be a powerful rally or a waterfall decline.
- It describes the window just ended; regimes can flip right after an extreme reading.
- The 61.8/38.2 thresholds are conventions, not statistically derived boundaries.
References
- Origin: E.W. Dreiss, 1990s.
This page explains how an indicator is calculated and read. It describes past data, not what price will do next, and it is not a recommendation to trade. Read the disclaimers.
Try it in Analess
Add Choppiness Index to any chart, adjust its settings, and open this explainer from the indicator itself.