















Indicators · Volatility
Historical Volatility
The standard deviation of past returns, annualized — how much price has varied.
Origin: Classical realized-volatility measure—no single originator
- Best suited to
- Any market condition
- Responsiveness
- Lagging
- Family
- Volatility
What it is
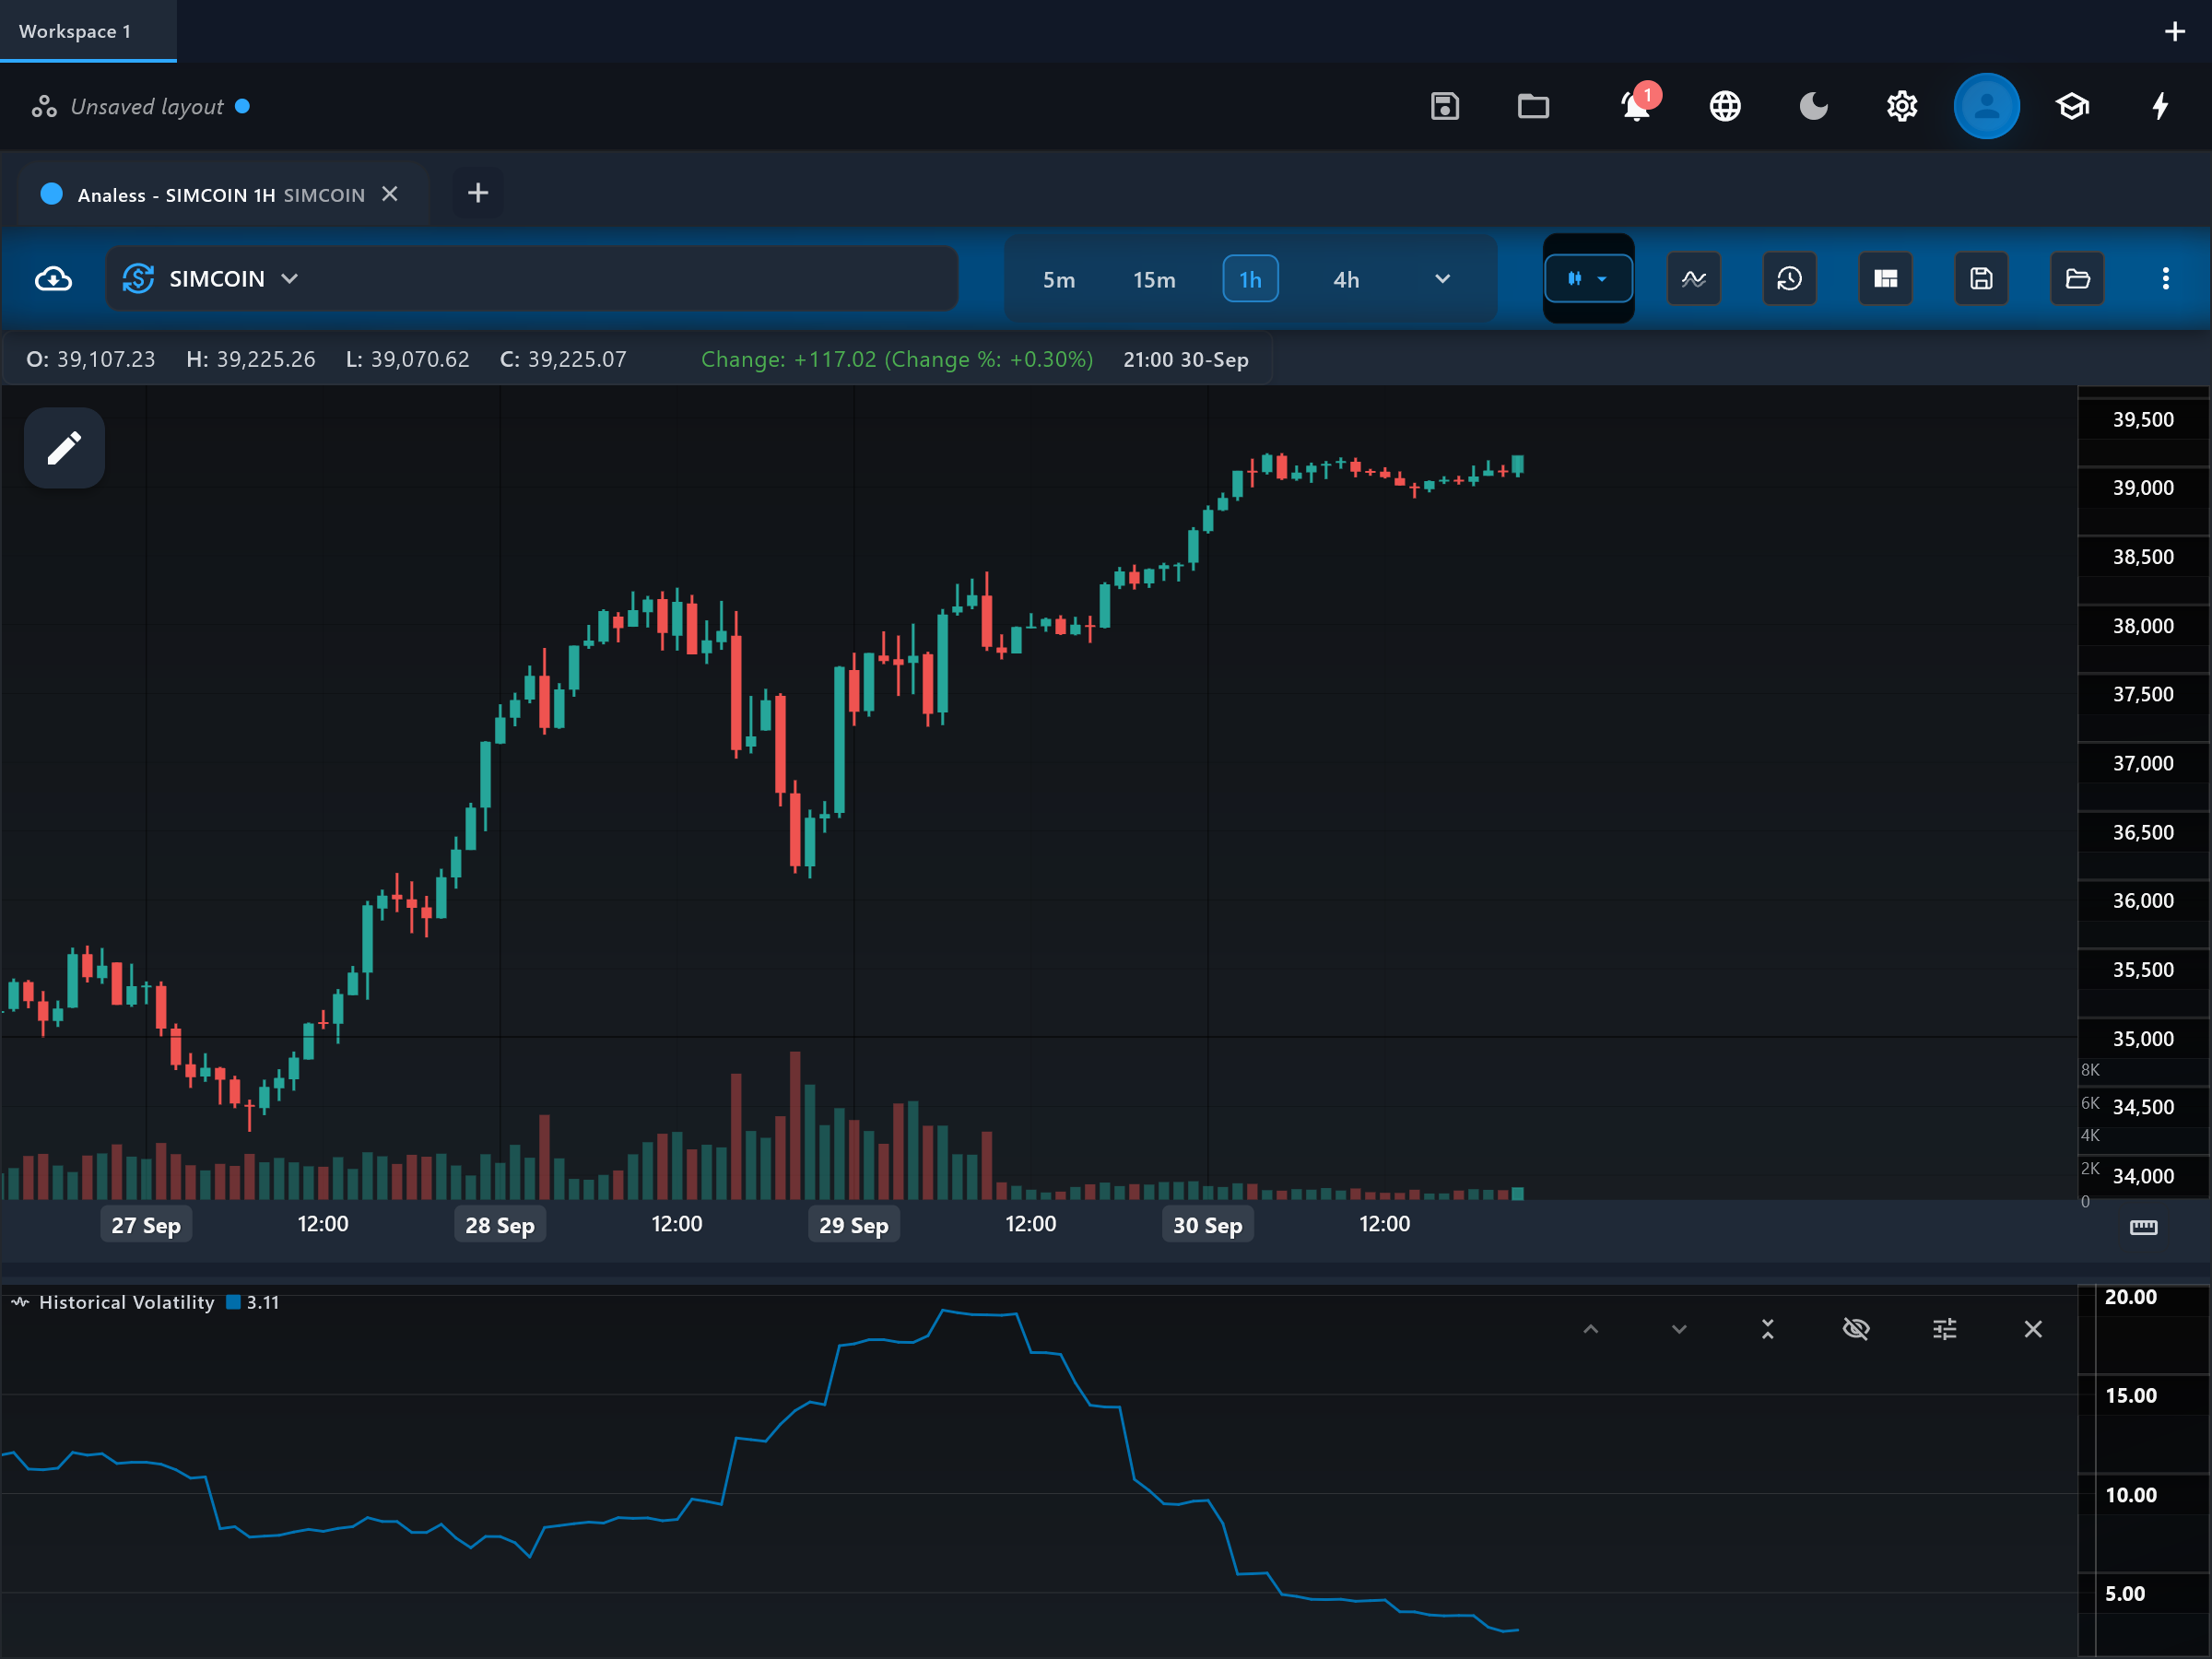
Historical Volatility (HV) expresses how much price has actually fluctuated, as an annualized percentage — the same convention options markets use to quote volatility. A reading of 40 means that, at the recent pace, price would be expected to swing about 40 percent over a year.
How it is calculated
The indicator computes bar-to-bar returns of the close — log returns by default, or simple percentage returns if useLogReturns is off — then takes their standard deviation over the chosen period (default 20). That per-bar figure is annualized by multiplying by the square root of annualizationPeriods (default 252, the number of trading days in a year) and by 100 to make it a percentage.
How to read it
A single line, hv, is plotted in its own pane on a percentage scale. Because it is normalized, readings ARE comparable across symbols and price levels — unlike ATR or raw standard deviation. Rising hv means realized swings are getting larger; falling hv means the market is calming. Compare the current value with the symbol's own typical range to judge whether conditions are unusually quiet or stormy.
What to look for
- SqueezeContext
hv at a long-term low marks a volatility compression that often precedes an expansion phase.
- Range expansionContext
A spike in hv confirms a regime change — a breakout, news shock, or panic — though it does not indicate direction.
- ConfirmationContext
Comparing hv across symbols helps rank instruments by risk when allocating position sizes.
When to use it
Well suited to daily charts of any asset class, where the default annualization of 252 trading days applies directly; on intraday or 24/7 crypto charts, adjust annualizationPeriods to match the number of bars per year. HV is strictly non-directional — do not use it to time entries on its own. It is most informative for risk comparison and for spotting compression/expansion cycles.
Works well with
Settings explained
period- How many returns feed the calculation (default 20, roughly a trading month of daily bars). Shorter windows track current conditions closely but whip around; longer windows describe the broader regime.
annualizationPeriods- The number of bars assumed per year (default 252, daily equity bars). Set it to match your timeframe — for example 365 for daily crypto bars, or much larger values for intraday bars — otherwise the percentage scale is misleading.
useLogReturns- On by default. Log returns are the standard for volatility work and behave better when bars move several percent. Turn off to use simple percentage returns; the difference is small for small moves.
Limitations and common mistakes
- It measures the past ("realized" volatility) — it is not a forecast, and volatility regimes can change abruptly.
- The annualized percentage is only meaningful if annualizationPeriods matches the actual bars per year for your symbol and timeframe.
- Non-directional: a high reading says nothing about whether the move was up or down.
References
- Origin: Classical realized-volatility measure—no single originator.
- Volatility (finance) — Wikipedia (opens in a new tab)
This page explains how an indicator is calculated and read. It describes past data, not what price will do next, and it is not a recommendation to trade. Read the disclaimers.
Try it in Analess
Add Historical Volatility to any chart, adjust its settings, and open this explainer from the indicator itself.