















Indicators · Volatility
ATR
Average True Range — the average size of recent price moves, a pure volatility measure.
Origin: J. Welles Wilder, 1978
- Best suited to
- Any market condition
- Responsiveness
- Lagging
- Family
- Volatility
What it is
Average True Range (ATR) measures how much price typically moves per bar, in price units. It is a pure volatility gauge: it tells you how large the swings are, not which way price is heading. Larger ATR values mean wider, more energetic bars; smaller values mean quieter trade.
How it is calculated
Each bar's "true range" is the largest of: high minus low, the distance from the previous close up to the high, and the distance from the previous close down to the low — so gaps between bars are counted. ATR is Wilder's smoothed moving average (RMA) of that true range over the chosen period (default 14).
How to read it
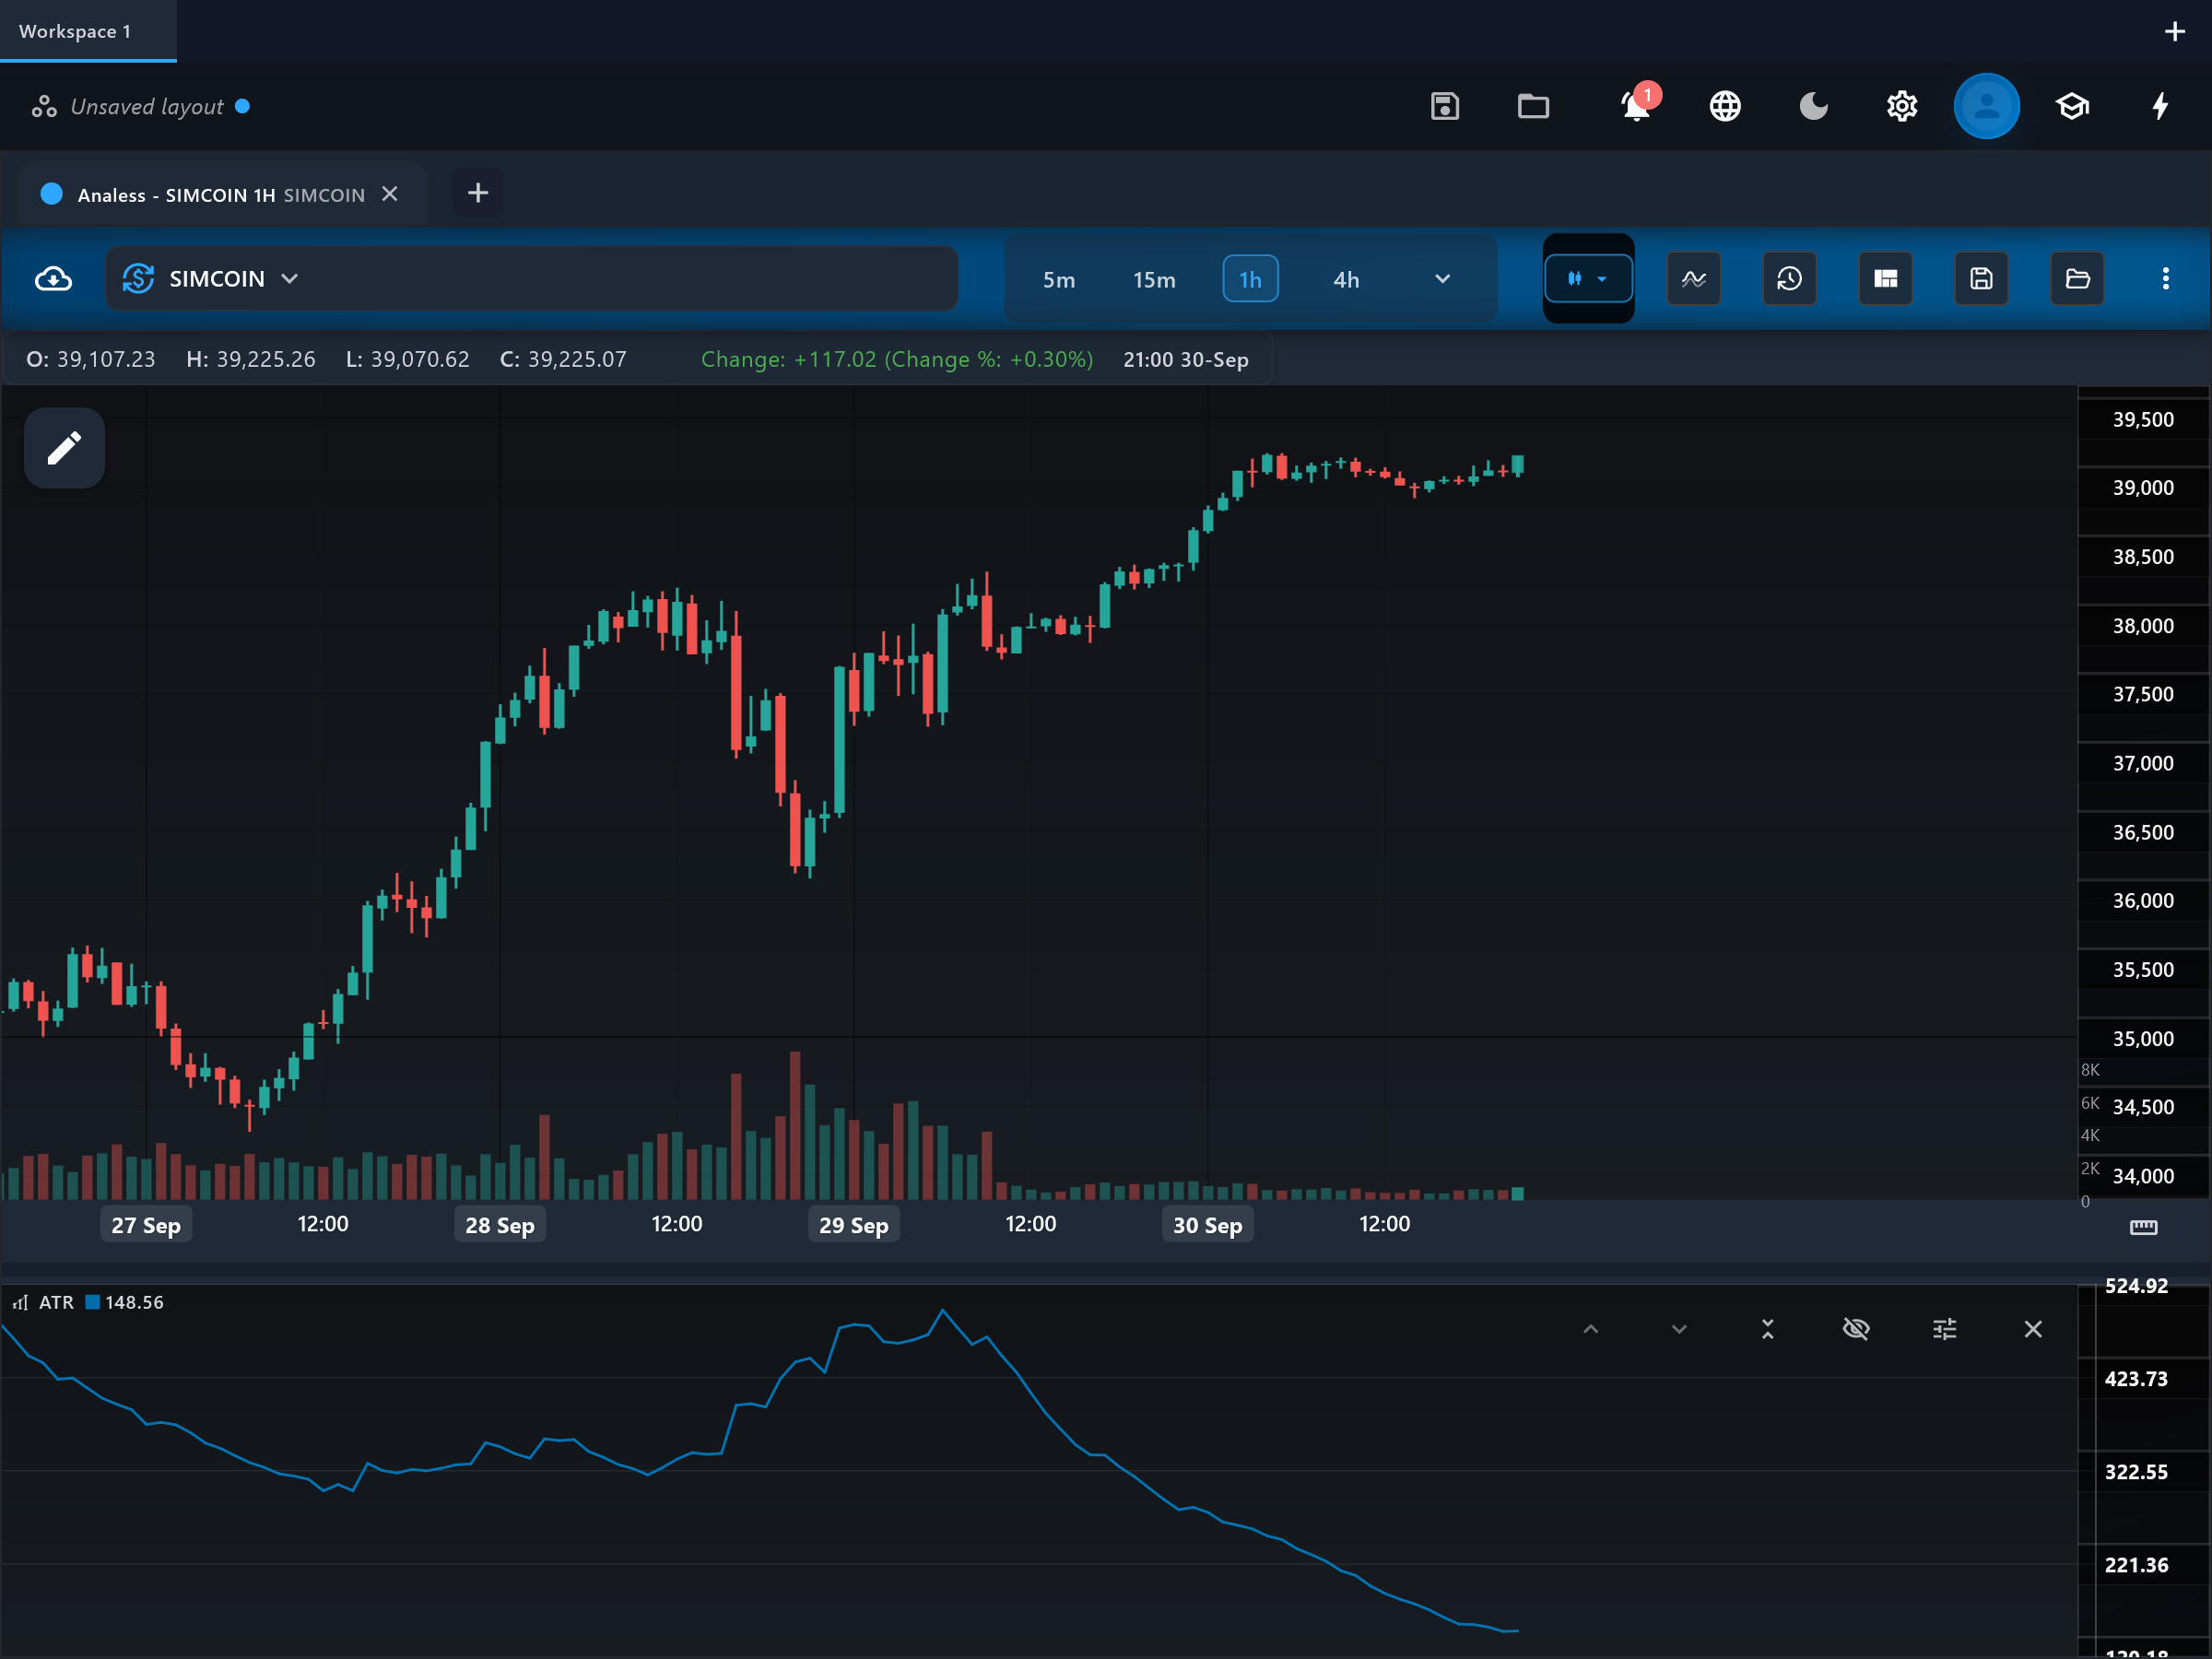
The indicator draws a single line, atr, in its own pane below the chart. Read its level relative to its own recent history: a rising atr line means bars are getting bigger and volatility is expanding, while a falling line means the market is quieting down. Because it is measured in price units, an ATR of 50 on one symbol cannot be compared with an ATR of 50 on another symbol or timeframe. There are no fixed overbought or oversold levels.
What to look for
- Range expansionContext
A sharp expansion in atr after a long quiet stretch often accompanies a breakout — the size of the move is confirming that something changed, though ATR itself does not say in which direction.
- SqueezeContext
A multi-week low in atr shows a volatility contraction. Quiet periods tend to be followed by expansions, so many traders watch compressed ATR as a "coiling" condition.
- ConfirmationContext
ATR is widely used for position sizing and stop placement: a stop set a multiple of atr away from entry adapts to current volatility instead of using a fixed distance.
When to use it
ATR works on any liquid market and any timeframe — stocks, crypto, forex — because it only needs high, low, and close. It is most useful when sizing stops or comparing today's activity with the recent past on the same chart. Do not use it as a directional signal: ATR is completely non-directional, and it cannot be compared across symbols because it is denominated in price units.
Works well with
Settings explained
period- The smoothing length (default 14, Wilder's original). Shorter periods react faster to volatility spikes but jump around more; longer periods give a steadier baseline that is slower to reflect regime changes.
Limitations and common mistakes
- ATR says nothing about direction — a rising ATR is equally consistent with a strong rally or a crash.
- Values are in price units, so they cannot be compared across symbols or after large price changes on the same symbol.
- Wilder smoothing makes ATR lag: a single explosive bar lifts it only gradually, and it stays elevated for a while after the move is over.
References
- Origin: J. Welles Wilder, 1978.
- Average true range — Wikipedia (opens in a new tab)
This page explains how an indicator is calculated and read. It describes past data, not what price will do next, and it is not a recommendation to trade. Read the disclaimers.
Try it in Analess
Add ATR to any chart, adjust its settings, and open this explainer from the indicator itself.