















Indicators · Moving averages
LSMA
Least Squares Moving Average — a line of best fit through recent prices, read at the current bar.
Origin: Least squares over a rolling window—Legendre, 1805; Gauss, 1809
- Best suited to
- Trending markets
- Responsiveness
- Lagging
- Family
- Moving averages
What it is
The Least Squares Moving Average (LSMA), also called the linear regression moving average, fits a straight regression line to the recent price window and plots where that line ends. It answers the question: if the last N bars were summarized by their best-fit trend line, where would price sit right now?
How it is calculated
Each bar, a least-squares linear regression is fitted to the last N values of the chosen source, and the indicator plots the endpoint of that fitted line — slope x (period - 1) + intercept, which is the fitted value at the most recent bar. Because the fit projects to the current bar rather than averaging the window, the LSMA sits much closer to price than an SMA of the same length and turns earlier.
How to read it
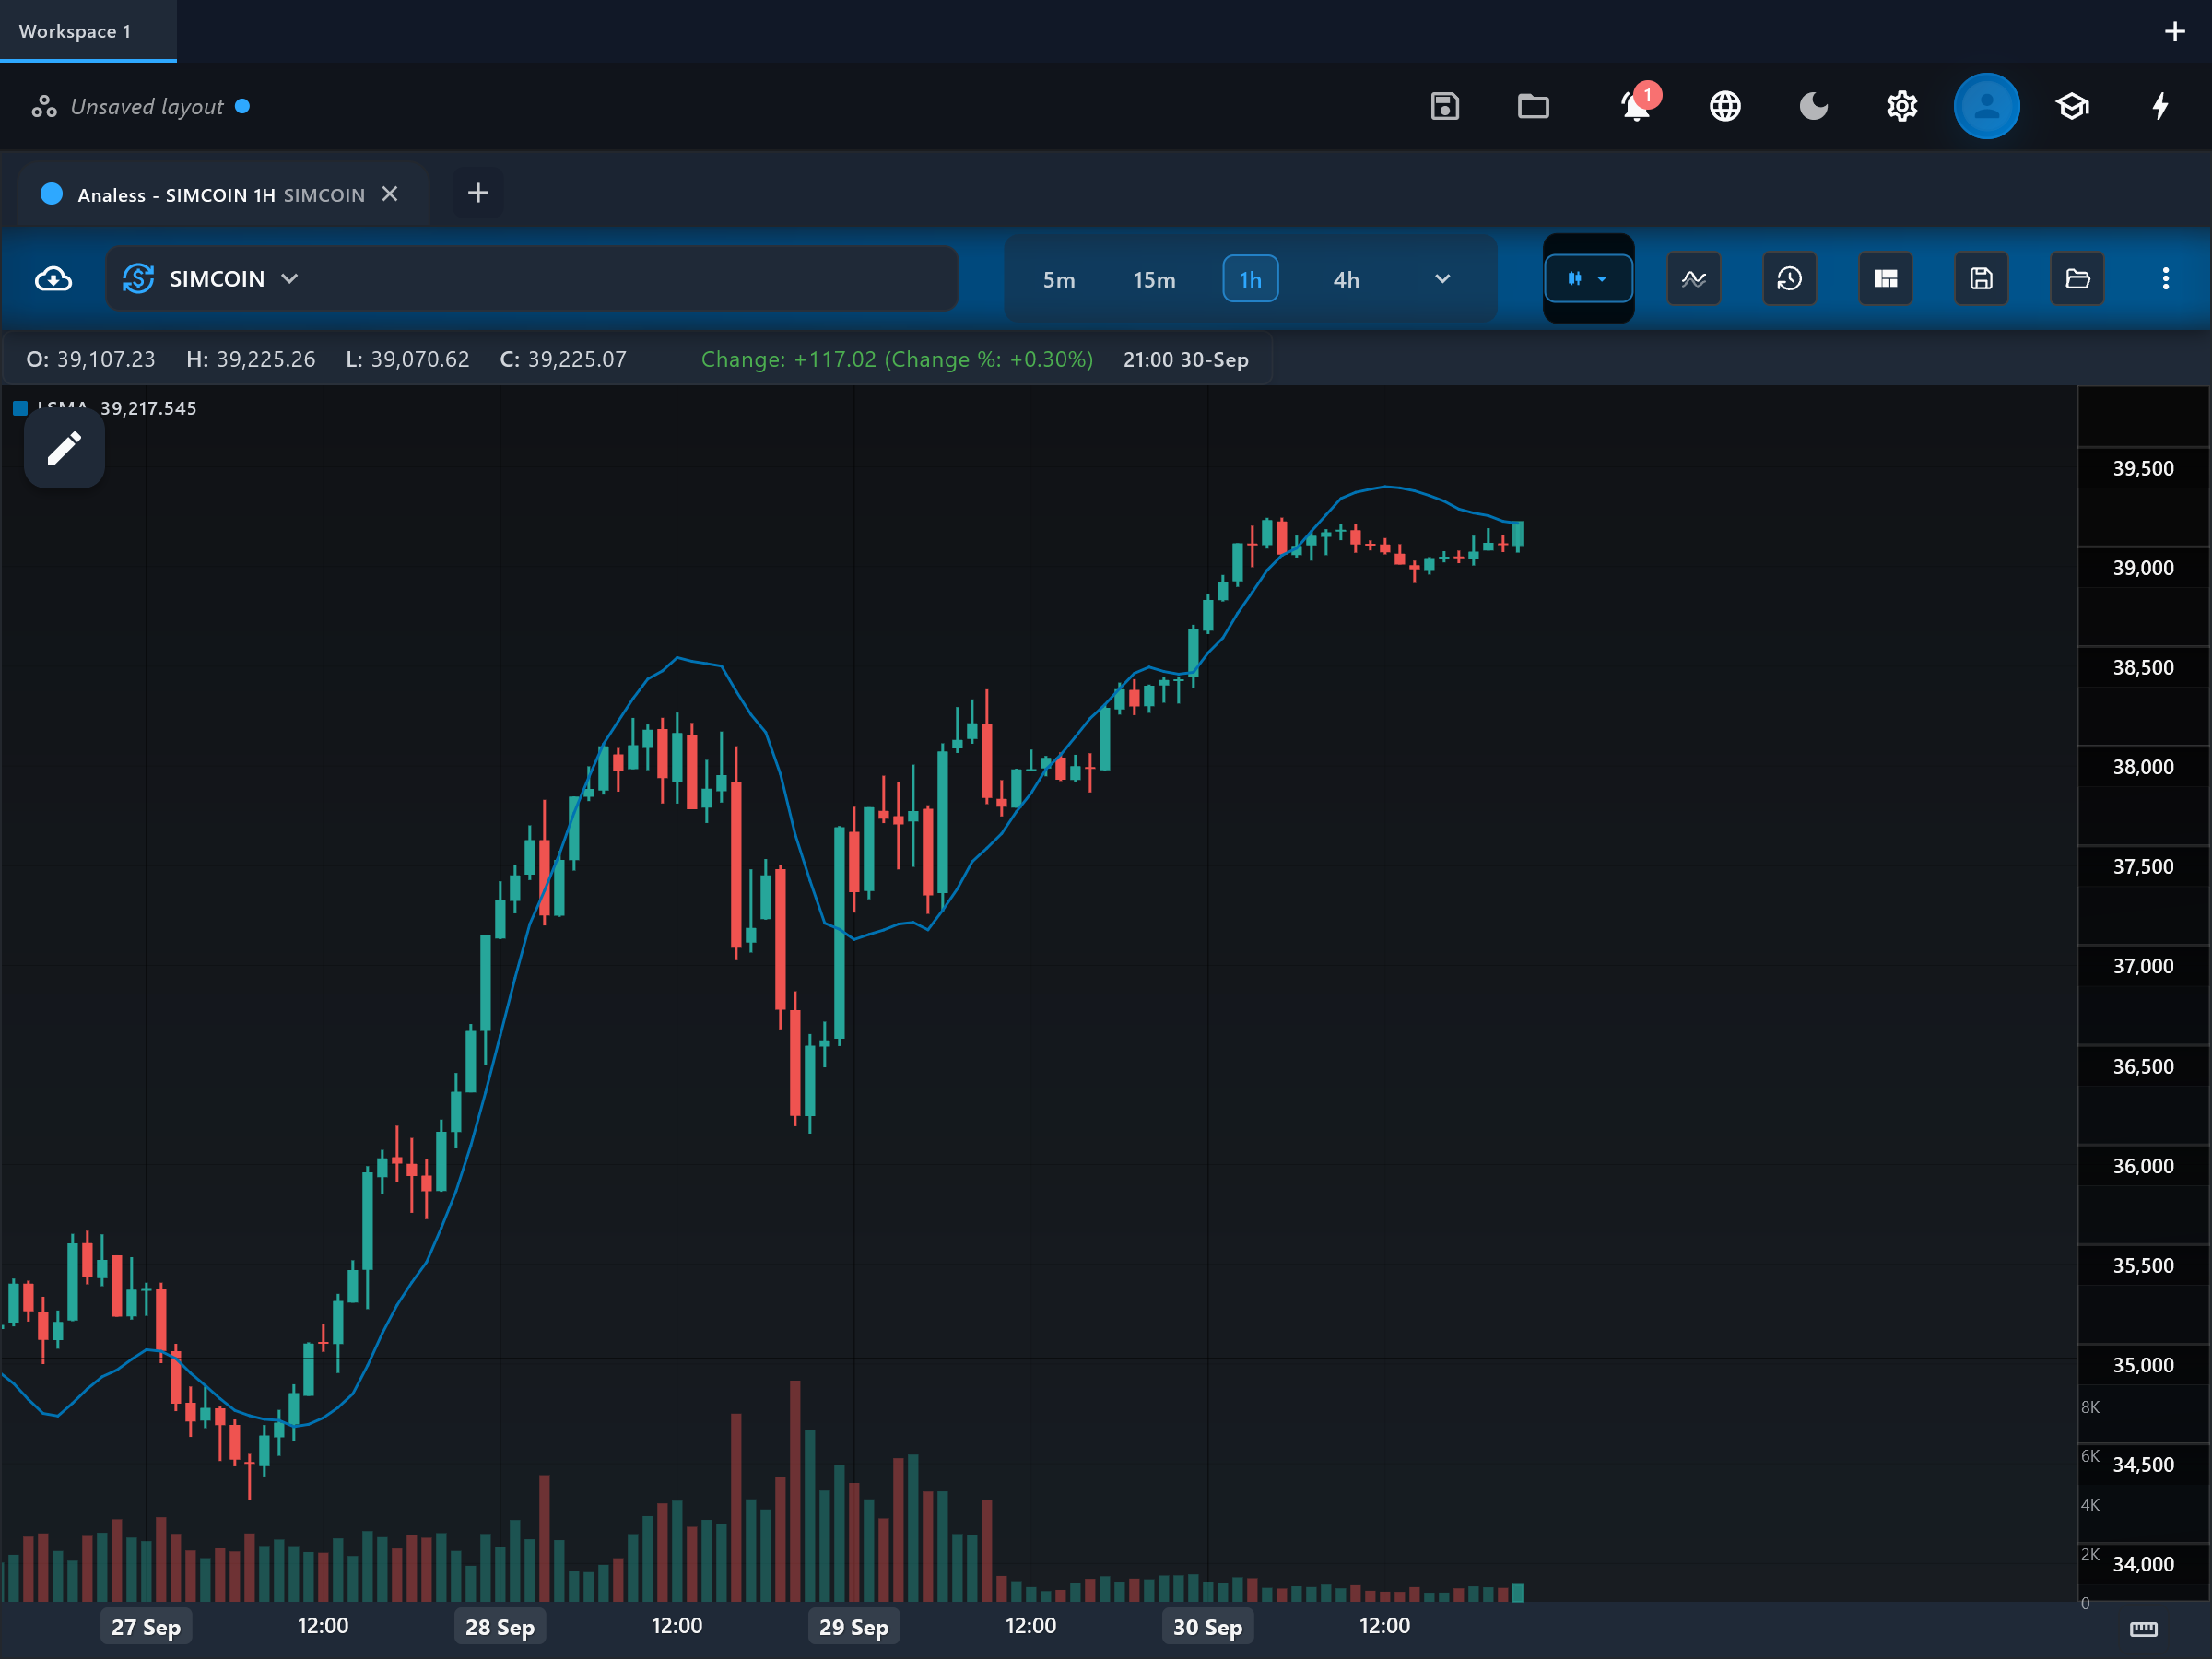
The indicator draws one line, lsma, on the price chart. Its slope is a direct reading of the fitted trend: steeply rising means the regression detects strong upward drift, flat means no statistical trend in the window. The line reacts fast, so crossings between price and lsma happen earlier — and more often — than with traditional averages. Watch for the line bending: a change in its curvature often precedes a visible price turn.
What to look for
- Price crossUpside
Price closes above the lsma line while its slope turns positive — an early trend-change reading.
- Price crossDownside
Price closes below the lsma line while its slope turns negative.
- Trend filterContext
The slope of the lsma line is effectively a rolling regression slope — positive slope for long bias, negative for short bias.
- ConfirmationContext
When lsma and a slower conventional average agree in direction, the trend reading is stronger than either alone.
When to use it
LSMA is used across stocks, forex and crypto, most commonly on intraday to daily charts by traders who want an average with minimal lag. It shines when price moves in clean linear swings. It is a poor fit for gappy or violently mean-reverting markets: the regression endpoint overreacts to outliers entering and leaving the window.
Works well with
Settings explained
period- Default 25. The regression window. Raising it fits the line to a longer trend, smoothing the plot and slowing its turns; lowering it makes the endpoint dart around with every swing.
source- Default close. The regression is fitted to this price field; close is standard.
Limitations and common mistakes
- The endpoint of a regression is sensitive to outliers — a single large bar entering or dropping out of the window can jerk the line.
- It assumes the window is well described by a straight line, which fails around curved tops and bottoms.
- Its responsiveness produces more price crossings, and therefore more false signals, in ranging markets.
References
- Origin: Least squares over a rolling window—Legendre, 1805; Gauss, 1809.
- Least squares — Wikipedia (opens in a new tab)
This page explains how an indicator is calculated and read. It describes past data, not what price will do next, and it is not a recommendation to trade. Read the disclaimers.
Try it in Analess
Add LSMA to any chart, adjust its settings, and open this explainer from the indicator itself.