















Indicators · Volatility
Standard Deviation
A statistical measure of how far price spreads from its average.
Origin: Classical statistics—no single originator
- Best suited to
- Any market condition
- Responsiveness
- Lagging
- Family
- Volatility
What it is
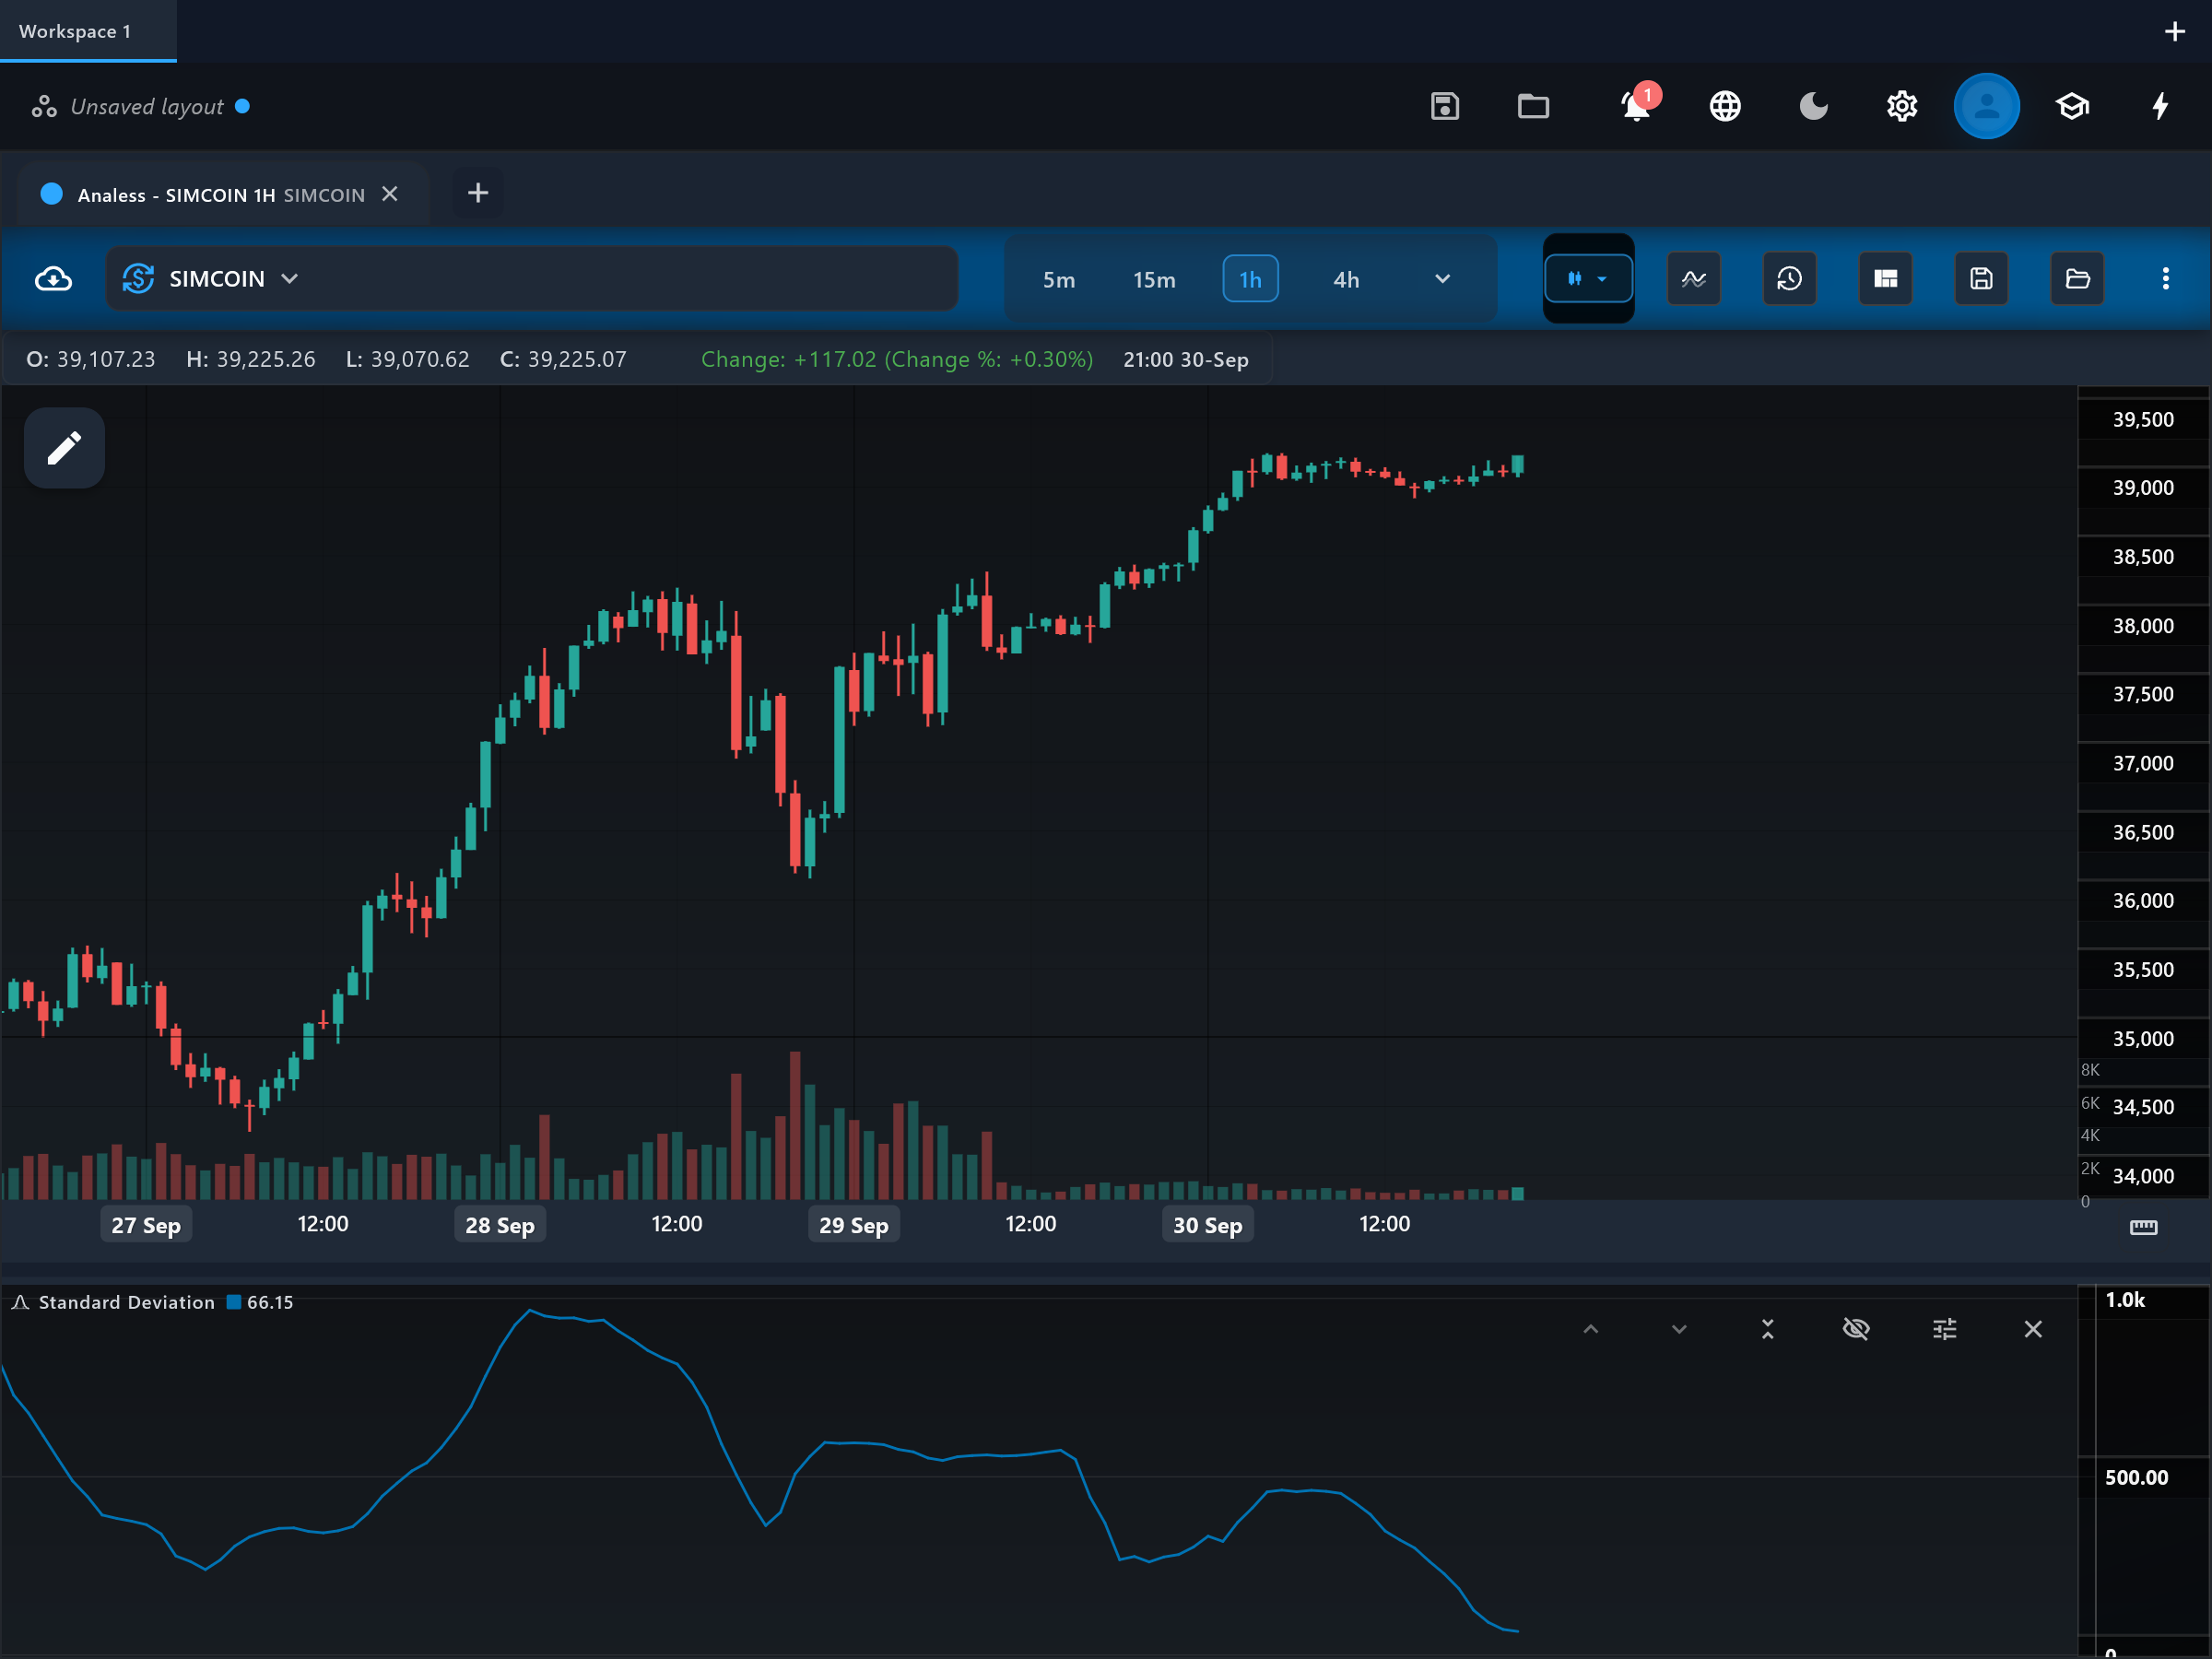
Standard Deviation measures how far prices have scattered around their recent average — the textbook statistical measure of dispersion applied to a rolling window of price. High readings mean price has been swinging widely; low readings mean it has hugged its average.
How it is calculated
Over the chosen period (default 20), the indicator takes the selected price source, computes its mean, and measures the root-mean-square distance of each value from that mean. By default it uses the sample formula (dividing by N−1); enabling usePopulation switches to the population formula (dividing by N), which is what classic Bollinger Bands use.
How to read it
A single line, stddev, is drawn in its own pane. Like ATR, it is read relative to its own history: peaks mark volatile stretches and troughs mark quiet ones. Because it is measured in price units, the absolute number depends on the symbol's price level. Watch for extremes — unusually low dispersion often precedes an expansion, and spikes usually mark climactic moves.
What to look for
- SqueezeContext
A drop in stddev to a multi-period low signals a volatility contraction — the same condition a Bollinger Band squeeze shows, since the bands are built from this value.
- Range expansionContext
A sudden jump in stddev confirms that a large move is under way, without saying in which direction.
- ConfirmationContext
Persistently elevated stddev warns that stops and targets calibrated for quiet conditions may be too tight.
When to use it
Useful on any symbol and timeframe as a raw volatility readout, and as a building block for understanding band indicators. It is non-directional — do not read high or low dispersion as bullish or bearish. Avoid comparing raw values across symbols with very different price levels.
Works well with
Settings explained
period- The rolling window length (default 20). Shorter windows react quickly to fresh volatility but are noisy; longer windows smooth the reading at the cost of lag.
usePopulation- Off by default (sample formula, dividing by N−1), the unbiased estimator when the window is treated as a sample. Turn it on for the population formula (dividing by N) — the form John Bollinger specifies for his bands, where the window IS the population. The difference is tiny for typical window lengths.
source- Which price the dispersion is measured on (default close). Alternatives such as hl2 or hlc3 smooth out some intra-bar noise.
Limitations and common mistakes
- Non-directional: it cannot distinguish a volatile rally from a volatile decline.
- Denominated in price units, so readings are not comparable across symbols or long spans where the price level changed a lot.
- A single outlier bar inflates the value for the entire window length before dropping out.
References
- Origin: Classical statistics—no single originator.
- Standard deviation — Wikipedia (opens in a new tab)
This page explains how an indicator is calculated and read. It describes past data, not what price will do next, and it is not a recommendation to trade. Read the disclaimers.
Try it in Analess
Add Standard Deviation to any chart, adjust its settings, and open this explainer from the indicator itself.