















Indicators · Volume
VWAP
Volume-Weighted Average Price — the average price weighted by volume, a common intraday reference.
Origin: Berkowitz, Logue & Noser, 1988—as an execution benchmark
- Best suited to
- Any market condition
- Responsiveness
- Coincident
- Family
- Volume
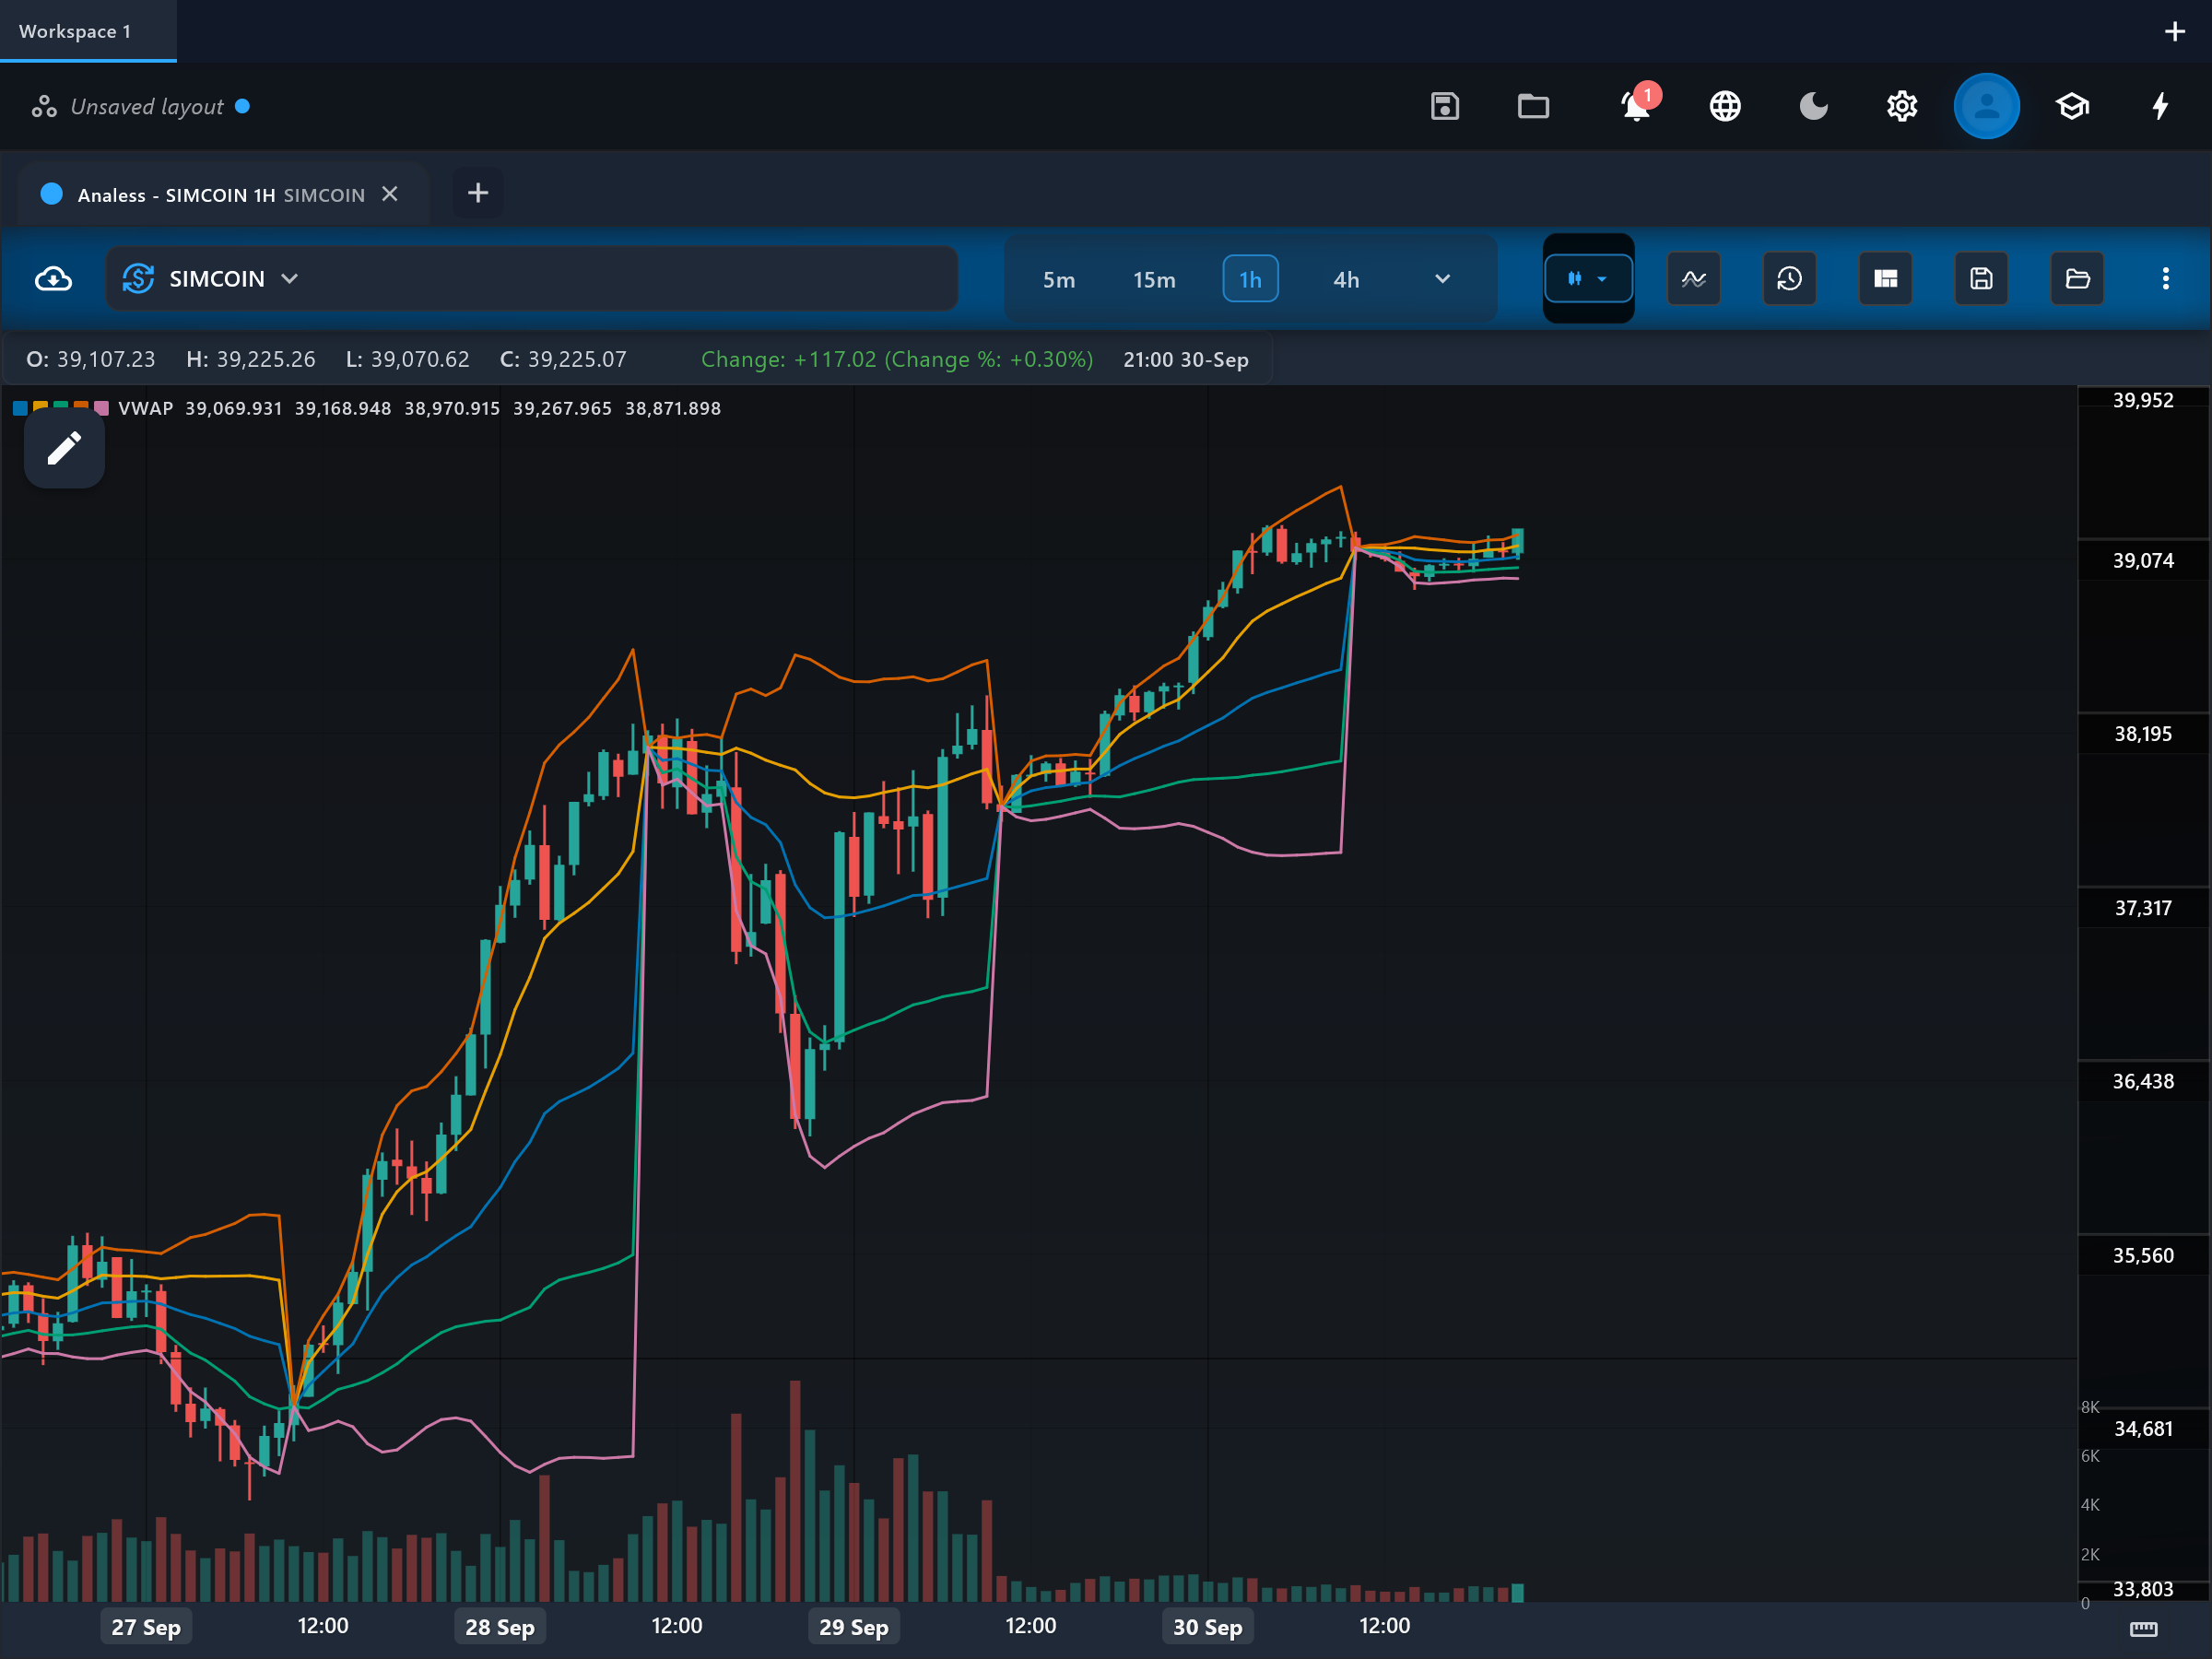
What it is
VWAP — Volume-Weighted Average Price — is the average price paid per unit over a stretch of trading, weighting each bar's price by its volume. Institutions use intraday VWAP as an execution benchmark: filling below VWAP means buying cheaper than the average participant that session.
How it is calculated
Running (typical price x volume) divided by running volume, accumulated from the start of the current anchor period and reset at every boundary — by default a UTC trading day, so each session gets a fresh line. Volume-weighted standard-deviation bands are drawn at two configurable multiples around it. Because the average restarts, the first bars of a session move it sharply and the last ones barely at all.
How to read it
The "vwap" line is the running volume-weighted average price: price trading above it means the market is paying up relative to the weighted average of the period; below it, the average buyer since the anchor is underwater. The "upper_band_1"/"lower_band_1" pair marks one volume-weighted standard deviation around vwap, and "upper_band_2"/"lower_band_2" marks the second, wider multiple — price reaching the outer bands is statistically stretched relative to the period's traded distribution. In conventional use, vwap acts as a magnet and reference: trends often pull back to it, and the side of vwap price holds is read as the session's bias.
What to look for
- Trend filterUpside
Price holding above the vwap line, with pullbacks that respect it, is conventionally read as buyers in control relative to the average traded price.
- Trend filterDownside
Price persistently rejected below vwap marks sellers in control — rallies to the line that fail are the classic short-side read.
- Price crossContext
A decisive cross of price through the vwap line marks a shift in who is ahead versus the average fill; reclaims after a long stay on one side draw particular attention.
- Overbought / oversoldContext
Price tagging upper_band_2 or lower_band_2 is stretched relative to the volume-weighted distribution and, in ranging conditions, is conventionally watched for reversion toward vwap.
When to use it
Most meaningful on liquid, high-volume markets — large-cap stocks, index futures, major crypto pairs — and traditionally on intraday timeframes, where session VWAP is the institutional benchmark. Since this implementation anchors to the loaded data rather than resetting daily, interpret it as an anchored VWAP. It degrades on thin or illiquid symbols, and spot-forex tick volume gives only an approximate weighting.
Works well with
Settings explained
deviation1- Multiplier for the inner band pair, upper_band_1/lower_band_1 (default 1.0 standard deviation). Widen it to make the inner band a less frequently touched envelope; narrow it for a tight channel around vwap.
deviation2- Multiplier for the outer band pair, upper_band_2/lower_band_2 (default 2.0 standard deviations). This is the "stretched" boundary — raise it so only rare extremes tag it, or lower it for earlier mean-reversion alerts.
anchor- The period the average restarts on, default session (a UTC trading day). VWAP is defined over a trading period — the question it answers is whether you traded better than the average participant TODAY — so it resets at each boundary rather than running forever. On a daily or higher chart a session is a single bar, which makes the line equal that bar's own typical price and flattens the bands onto it; use week, month or year there instead.
sessionHours- Which of the market's sessions the day anchors to, default rth. Regular trading hours is the window the institutional benchmark is measured over — 09:30 to 16:00 for US stocks. Choose eth to anchor at the extended-hours open instead, which matches a chart that is showing pre- and post-market bars. A 24/7 venue has one continuous session, so the choice makes no difference there.
sessionTimezone- The market's own timezone, filled in from the instrument — not something you normally set. A session belongs to the exchange, so it anchors in the exchange's clock: viewing a US stock from Sydney gives exactly the same line as viewing it from New York. Daylight saving is handled, so the market keeps opening at its local time.
sessionOpenMinutes- Minutes past local midnight at which the regular session opens, filled in from the instrument: 570 for a 09:30 US equity open, 1020 for the 17:00 New York forex rollover, 0 for a 24/7 venue.
extendedOpenMinutes- The same value for the extended session, used when sessionHours is eth. Also filled in from the instrument.
Limitations and common mistakes
- The session is a UTC calendar day, which suits crypto and most data feeds but is not every exchange's trading day: a US equity session opens at 14:30 UTC, so this anchor and that venue's own VWAP start at different points and will not agree.
- VWAP flattens as the session progresses: late in the day it moves slowly and reacts little to new prices, which is why the first bars after a reset swing the most.
- It is a benchmark, not a predictor — price crossing it changes the bookkeeping, not the future.
- On symbols without real volume (spot forex, thin listings) the weighting loses its institutional meaning.
References
- Origin: Berkowitz, Logue & Noser, 1988—as an execution benchmark.
- Volume-weighted average price — Wikipedia (opens in a new tab)
This page explains how an indicator is calculated and read. It describes past data, not what price will do next, and it is not a recommendation to trade. Read the disclaimers.
Try it in Analess
Add VWAP to any chart, adjust its settings, and open this explainer from the indicator itself.