















Indicators · Momentum & oscillators
Awesome Oscillator
The gap between a fast and slow average of bar midpoints, showing market momentum.
Origin: Bill Williams, 1990s
- Best suited to
- Trending markets
- Responsiveness
- Lagging
- Family
- Momentum & oscillators
What it is
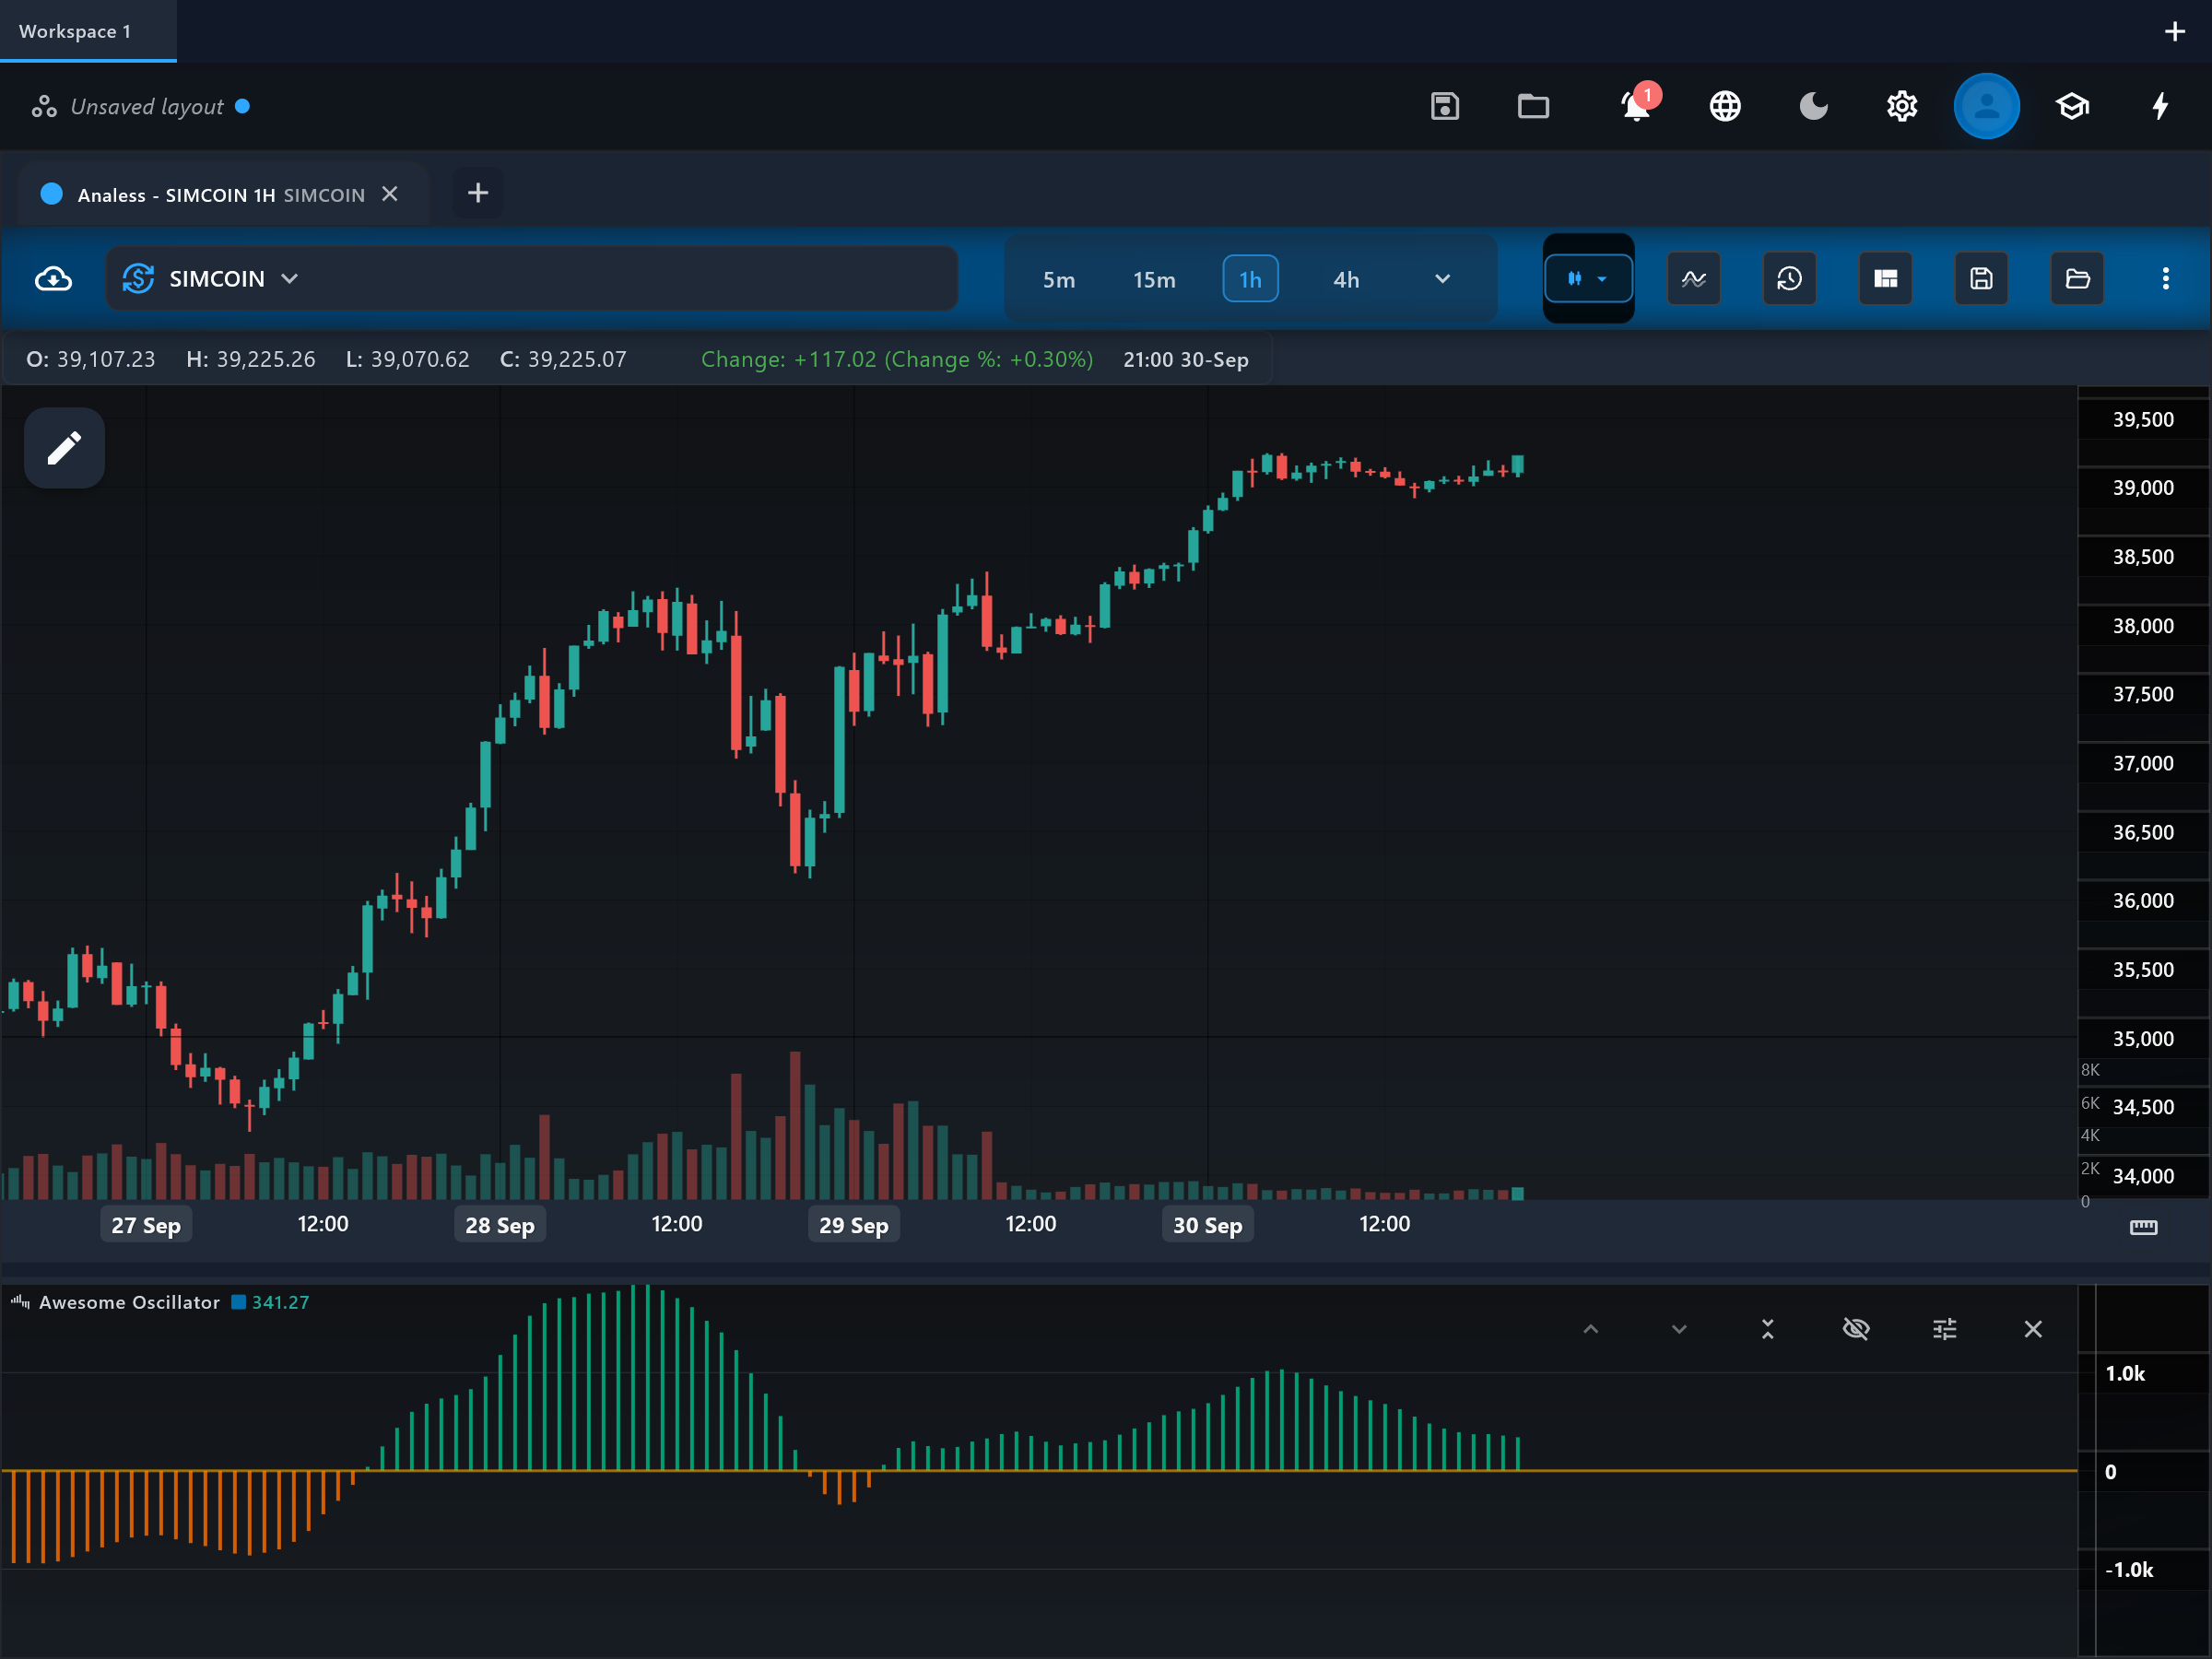
The Awesome Oscillator (AO) is a momentum histogram that compares recent market momentum with momentum over a longer window. It is one of the core tools in Bill Williams' trading method, built to show whether the driving force behind price is strengthening or fading. It oscillates around a zero line with no upper or lower bound.
How it is calculated
Each bar's median price is computed as (high + low) / 2. AO is the 5-period simple moving average of median price minus the 34-period simple moving average of median price. In Williams' original definition the 5 and 34 periods are fixed — they are part of what makes AO "the" Awesome Oscillator — although this app exposes them as editable parameters. The result is plotted as a histogram around a zero line.
How to read it
The "ao" histogram shows the gap between short-term and long-term median-price averages, and the flat "zero" line marks where the two averages are equal. Bars above zero mean short-term momentum is stronger than the longer baseline; bars below zero mean it is weaker. The bar-to-bar change matters as much as the level: growing bars show momentum building, shrinking bars show it fading. Williams' classic setups — twin peaks and the saucer — are read directly from the shape of consecutive histogram bars.
What to look for
- Centre-line crossUpside
The "ao" histogram crosses from below zero to above zero, showing short-term momentum overtaking the longer baseline.
- Centre-line crossDownside
The "ao" histogram crosses from above zero to below zero, showing short-term momentum falling behind the longer baseline.
- Turning patternUpside
Bullish twin peaks: two troughs below zero where the second trough is shallower than the first, followed by a rising bar — downside momentum weakening on the second push.
- Turning patternDownside
Bearish twin peaks: two peaks above zero where the second peak is lower than the first, followed by a falling bar.
- Turning patternContext
Saucer: on one side of the zero line, two shrinking bars followed by a bar that turns back in the trend direction — a brief momentum pause resolving with the trend.
- DivergenceContext
Price makes a new high or low that the "ao" histogram does not confirm, hinting the move is running on fading momentum.
When to use it
AO is used across stocks, forex, crypto, and futures, and works on any timeframe where trends develop — it is most informative on intraday to daily charts of liquid instruments. It shines when a directional move is underway and you want to gauge whether the push behind it is growing or fading. Avoid relying on it in flat, range-bound markets: the histogram hovers near zero and crosses the centerline repeatedly, producing whipsaw signals.
Works well with
Settings explained
fastPeriod- Length of the short median-price SMA. The default 5 is Bill Williams' original value and is what defines the classic AO — most references assume it. Lowering it makes the histogram twitchier; raising it smooths but delays momentum shifts.
slowPeriod- Length of the long median-price SMA baseline. The default 34 is Williams' original value. A larger value compares momentum against a slower baseline (fewer zero-line crosses); a smaller value makes the two averages track each other more closely.
Limitations and common mistakes
- AO is built from simple moving averages, so it lags price — the histogram confirms momentum shifts after they have begun.
- It is unbounded: a "large" bar on one instrument or timeframe means nothing on another, so absolute levels cannot be compared.
- In sideways markets the histogram oscillates tightly around zero and centerline crosses become noise.
- Changing the 5/34 periods means you are no longer reading the indicator most literature and screeners describe as AO.
References
- Origin: Bill Williams, 1990s.
- Bill Williams (trader) — Wikipedia (opens in a new tab)
This page explains how an indicator is calculated and read. It describes past data, not what price will do next, and it is not a recommendation to trade. Read the disclaimers.
Try it in Analess
Add Awesome Oscillator to any chart, adjust its settings, and open this explainer from the indicator itself.