















Indicators · Trend
ZigZag
Filters out small moves to draw the significant swings, highlighting structure.
Origin: Charting convention—no single originator
- Best suited to
- Any market condition
- Responsiveness
- Lagging
- Family
- Trend
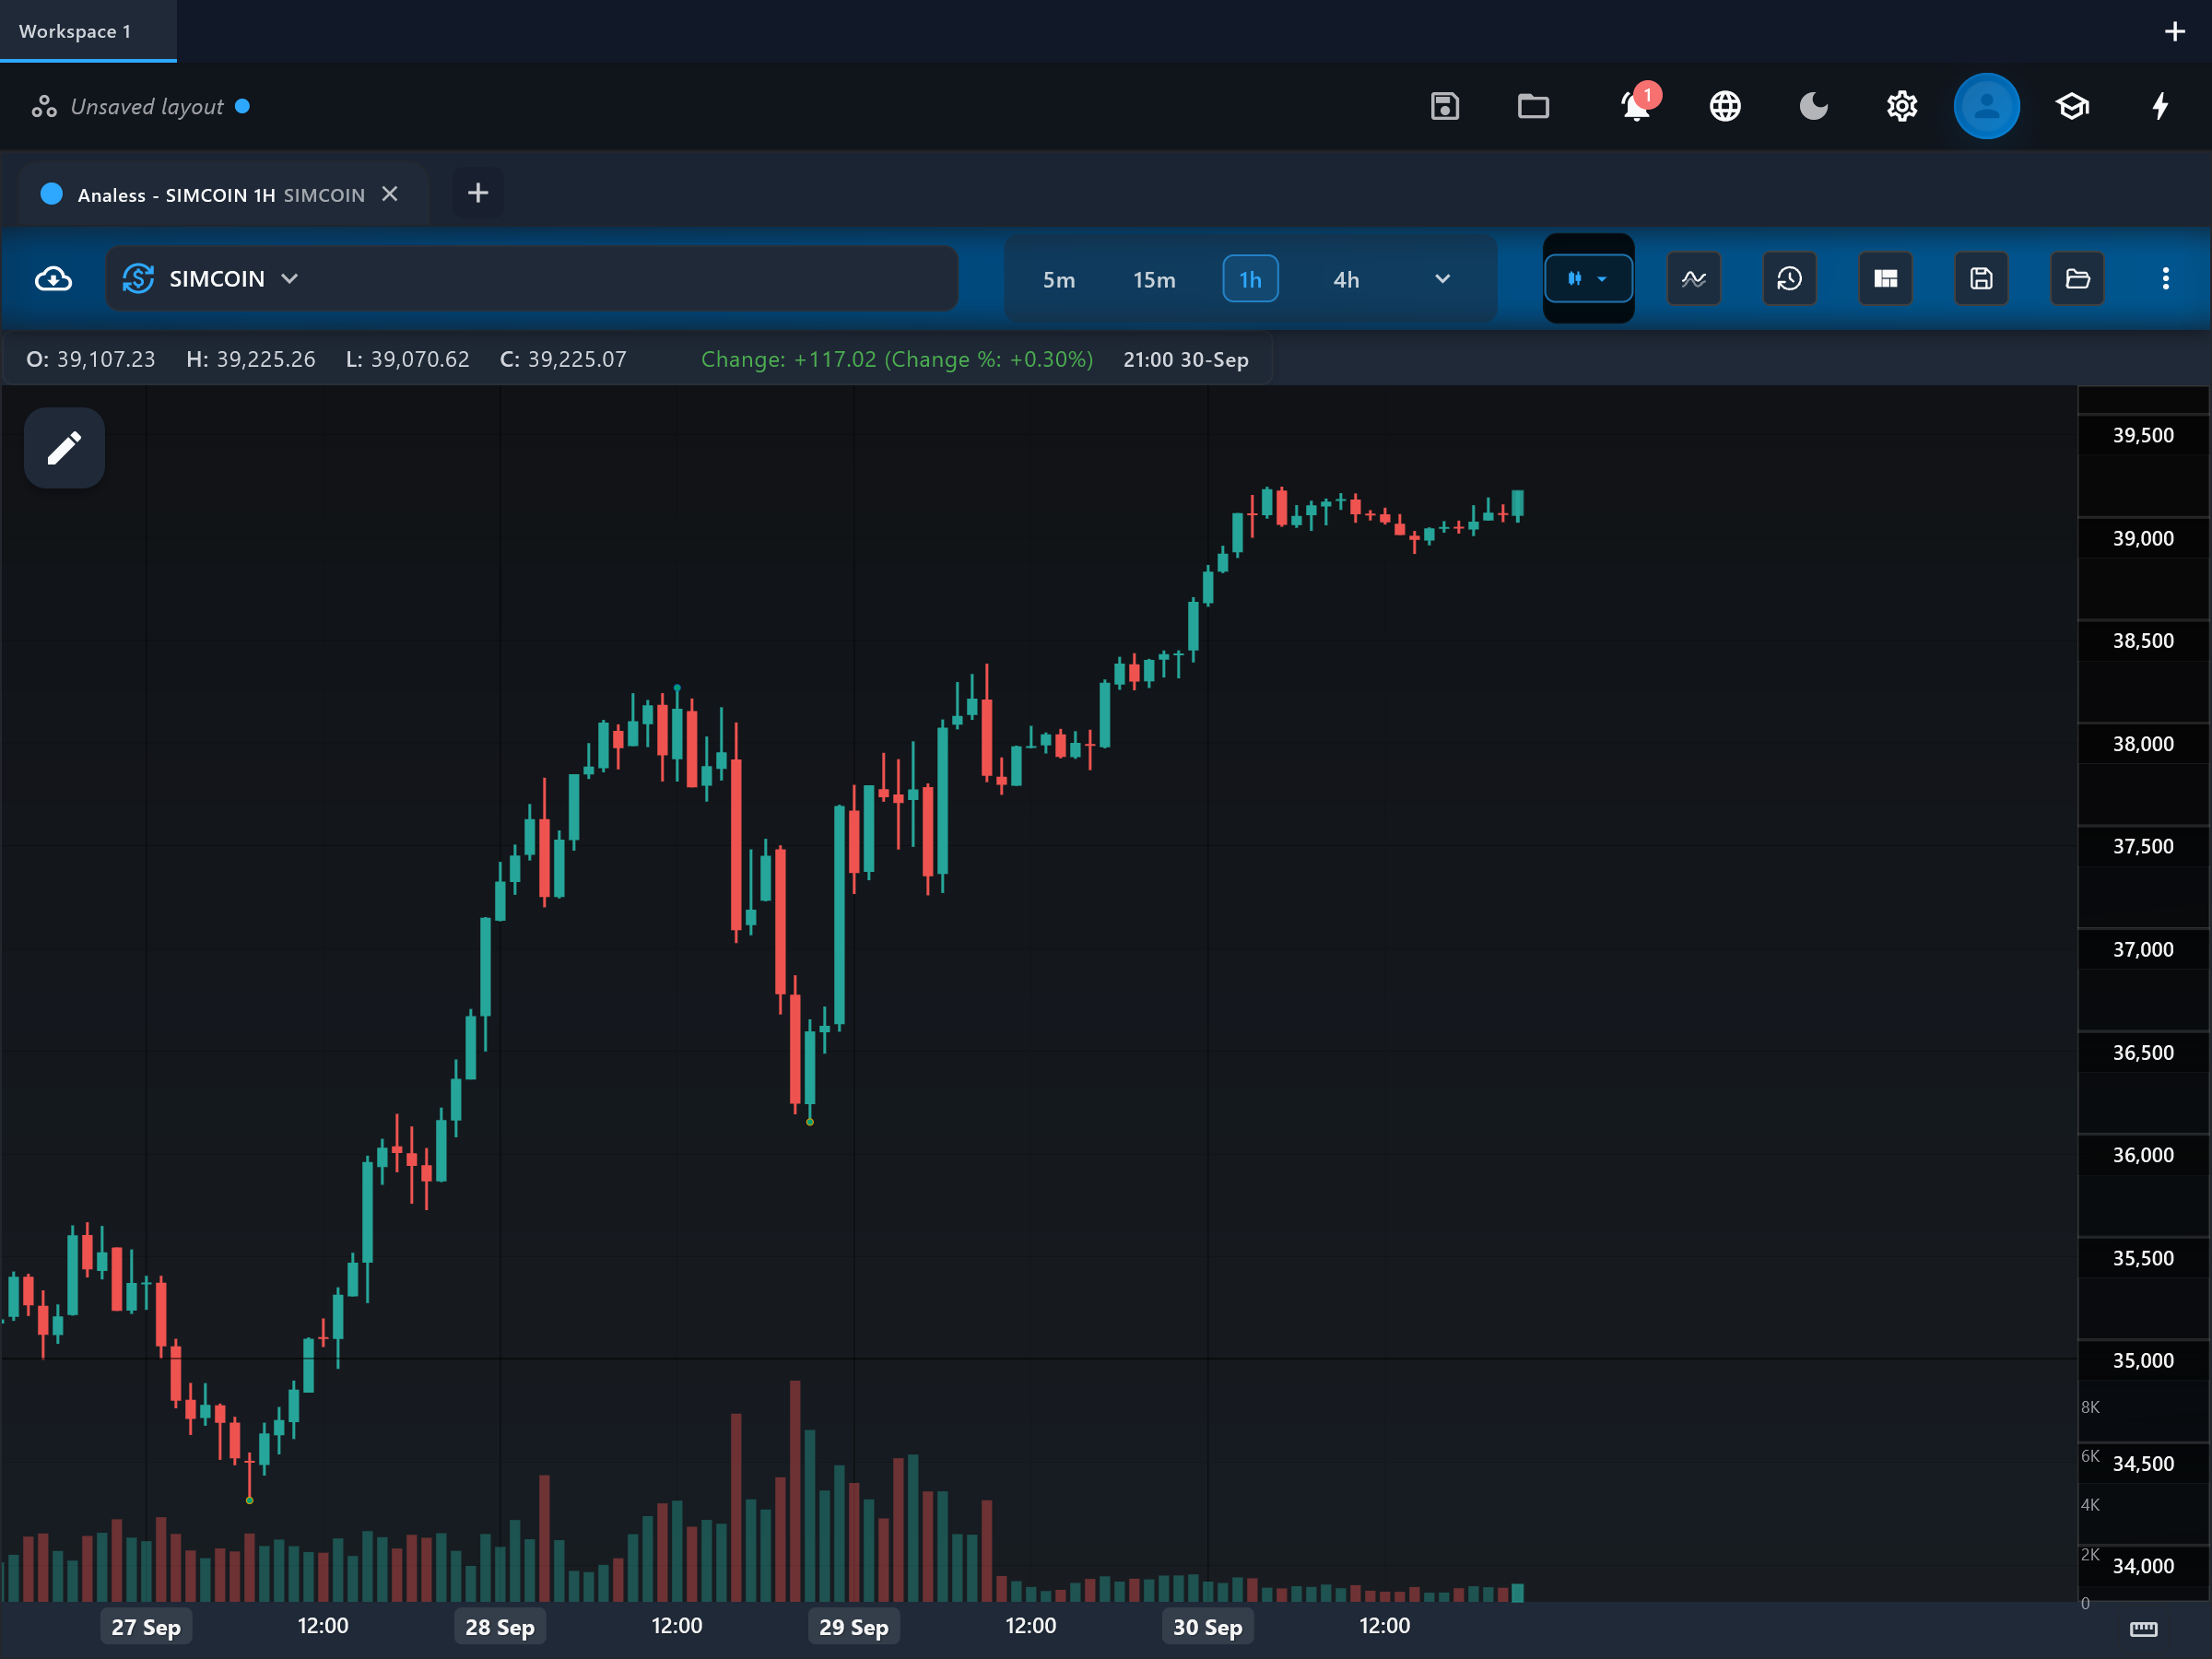
What it is
ZigZag filters out price movements smaller than a chosen percentage and connects the surviving swing highs and lows with straight lines. The result is a clean skeleton of the market's meaningful swings, with all the minor noise erased.
How it is calculated
The indicator tracks the latest extreme and only commits a pivot once price has reversed against it by at least the deviation percentage, with the depth setting requiring a minimum number of bars between pivots. Until that reversal threshold is met, the current leg keeps extending to each new extreme - which is why the most recent segment is provisional by construction.
How to read it
On the price chart, swing_highs and swing_lows mark the confirmed pivot points, and connections draws the straight legs between them. Read the structure, not the individual bars: a sequence of higher swing_lows and higher swing_highs is an uptrend by definition; lower highs and lower lows a downtrend. The pivots double as natural support/resistance references and as anchors for measuring swing sizes, retracements, and chart or wave patterns. Treat the final leg as unconfirmed - it will keep redrawing while price extends.
What to look for
- Trend filterContext
A run of higher swing_lows and higher swing_highs defines an uptrend structure; lower highs and lower lows define a downtrend - the cleanest way to read market structure.
- Turning patternContext
A confirmed pivot that breaks the prevailing sequence (e.g. the first lower swing_high after a series of higher ones) is an early structural warning of a trend change.
- ConfirmationContext
Confirmed pivots are reference anchors for retracement measurements, pattern outlines and wave counts - analysis performed in hindsight, on settled structure.
When to use it
ZigZag is an ANALYSIS overlay, not a signal generator: use it on any market and timeframe to study swing structure, identify support/resistance pivots, measure retracements, and provide context for pattern or Elliott-style work in backtesting and chart review. Do not use it for live entries - by the time a pivot is confirmed, price has already reversed by the full deviation percentage, and the last leg is still mutable.
Works well with
Settings explained
deviation- Default 5.0 (percent). The minimum reversal required to confirm a new pivot. Smaller values keep more minor swings (a busier zigzag); larger values keep only major swings and confirm them later.
depth- Default 3. The minimum number of bars between pivots. Raising it suppresses rapid-fire pivots in volatile stretches and enforces a minimum swing duration.
Limitations and common mistakes
- ZigZag REPAINTS: the last leg keeps redrawing as new extremes form, and a pivot that looks confirmed can vanish if price pushes past it before reversing enough. Never trade the most recent segment as if it were settled.
- Backtests that read ZigZag values as-of-now overstate performance badly, because historical charts show only the final, hindsight-perfect version of every swing.
- Pivot confirmation is inherently late - each pivot is only known after price has already moved the full deviation away from it.
- The output is entirely a function of the deviation/depth choice; two analysts with different settings see different "structures" on the same chart.
References
- Origin: Charting convention—no single originator.
This page explains how an indicator is calculated and read. It describes past data, not what price will do next, and it is not a recommendation to trade. Read the disclaimers.
Try it in Analess
Add ZigZag to any chart, adjust its settings, and open this explainer from the indicator itself.