















Indicators · Moving averages
Moving Average
The building block — the average of the last N prices, with simple, exponential, and other modes.
Origin: Classical statistics—no single originator
- Best suited to
- Trending markets
- Responsiveness
- Lagging
- Family
- Moving averages
What it is
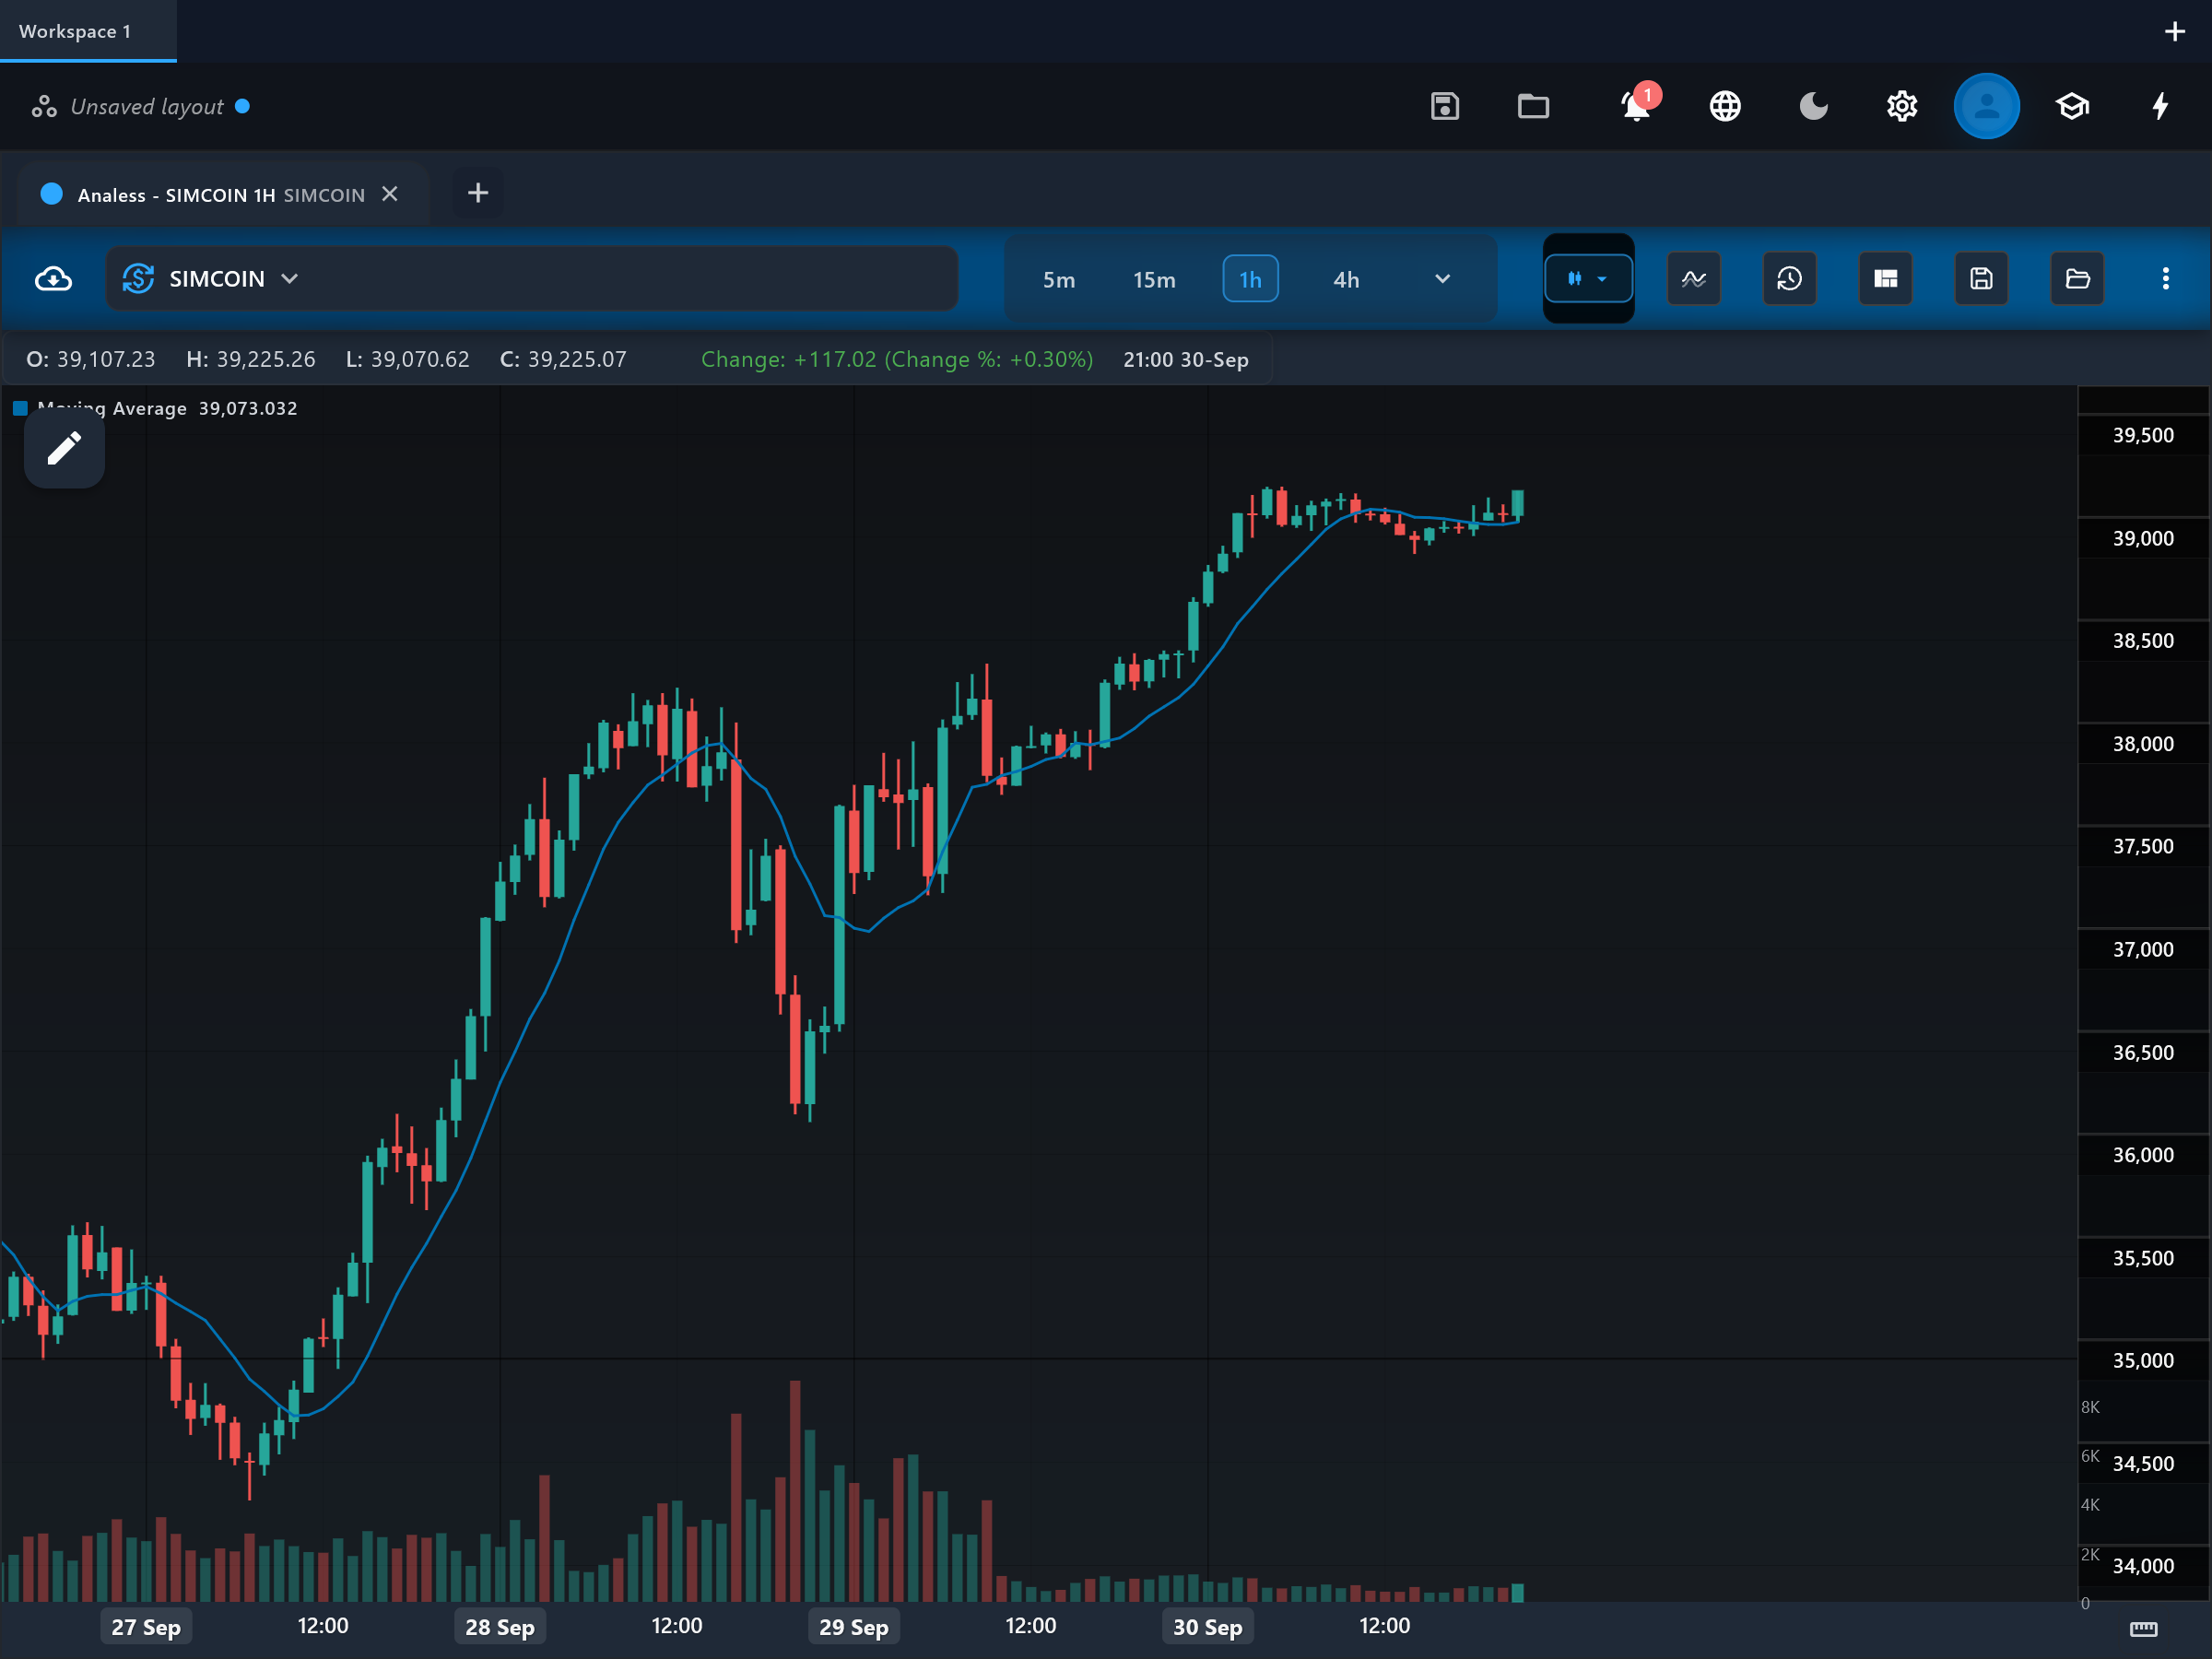
A moving average smooths price data into a single flowing line so the underlying trend is easier to see. It is the most widely used technical indicator and the building block for many others, including MACD and Bollinger Bands.
How it is calculated
Each bar, the indicator averages the last N values of the chosen price source. The method setting selects how that average is taken: simple weights every bar equally; exponential applies a smoothing factor of 2 / (N + 1) so recent bars count more; weighted applies linearly increasing weights toward the newest bar; linear fits a least-squares regression line over the window and plots its endpoint. A shift greater than zero displaces the finished line that many bars forward on the chart.
How to read it
The indicator draws one line, ma_line, directly on the price chart. When ma_line slopes upward and price holds above it, the market is in an uptrend; a downward slope with price below it signals a downtrend. A flat ma_line with price weaving across it indicates a range, where moving-average signals are least reliable. Traders often treat the line itself as dynamic support in uptrends and resistance in downtrends.
What to look for
- Price crossUpside
Price closes above ma_line after trading below it — often read as the start of upward momentum, especially when the line is already flattening or turning up.
- Price crossDownside
Price closes below ma_line after trading above it — a common warning that the uptrend is weakening.
- Trend filterContext
The slope of ma_line acts as a regime filter: many traders only take long setups while the line rises and short setups while it falls.
- ConfirmationContext
A pullback that touches ma_line and holds tends to confirm the prevailing trend; a decisive break through it questions the trend.
When to use it
Moving averages are used on every asset class — stocks, forex, crypto, indices and commodities — and on every timeframe from minutes to months. Longer settings such as 50 or 200 periods are common on daily stock charts, while shorter settings suit intraday trading. Avoid relying on them in sideways, choppy markets, where repeated crosses produce whipsaw losses.
Works well with
Settings explained
period- Default 10. Raising it produces a smoother, slower line that ignores minor noise but reacts late to turns; lowering it makes the line hug price and signal earlier, at the cost of more false crosses.
shift- Default 0 (no displacement). Raising it pushes the plotted line that many bars to the right, which some traders use to reduce premature crosses; it does not change the calculation itself.
method- Default simple. Exponential and weighted respond faster to recent price; linear (least-squares regression endpoint) tracks the direction of the window most tightly. Faster methods give earlier signals but more whipsaws.
source- Default close. Choosing a different price field (open, high, low, or a blended value such as hl2) changes which part of each bar is averaged; close is the standard choice for most strategies.
Limitations and common mistakes
- It is a lagging indicator: by the time the line turns, part of the move has already happened.
- In ranging markets, price crosses the line repeatedly and generates whipsaw signals.
- It carries no volume or volatility information — a cross on thin volume looks identical to one on heavy volume.
References
- Origin: Classical statistics—no single originator.
- Moving average — Wikipedia (opens in a new tab)
This page explains how an indicator is calculated and read. It describes past data, not what price will do next, and it is not a recommendation to trade. Read the disclaimers.
Try it in Analess
Add Moving Average to any chart, adjust its settings, and open this explainer from the indicator itself.