















Indicators · Volatility
Realized Volatility
A synthetic close-to-close and range-based estimate of how much price has actually varied. This is not the CBOE VIX.
Origin: Michael Parkinson, 1980 (range estimator); app-specific blend
- Best suited to
- Any market condition
- Responsiveness
- Lagging
- Family
- Volatility
What it is
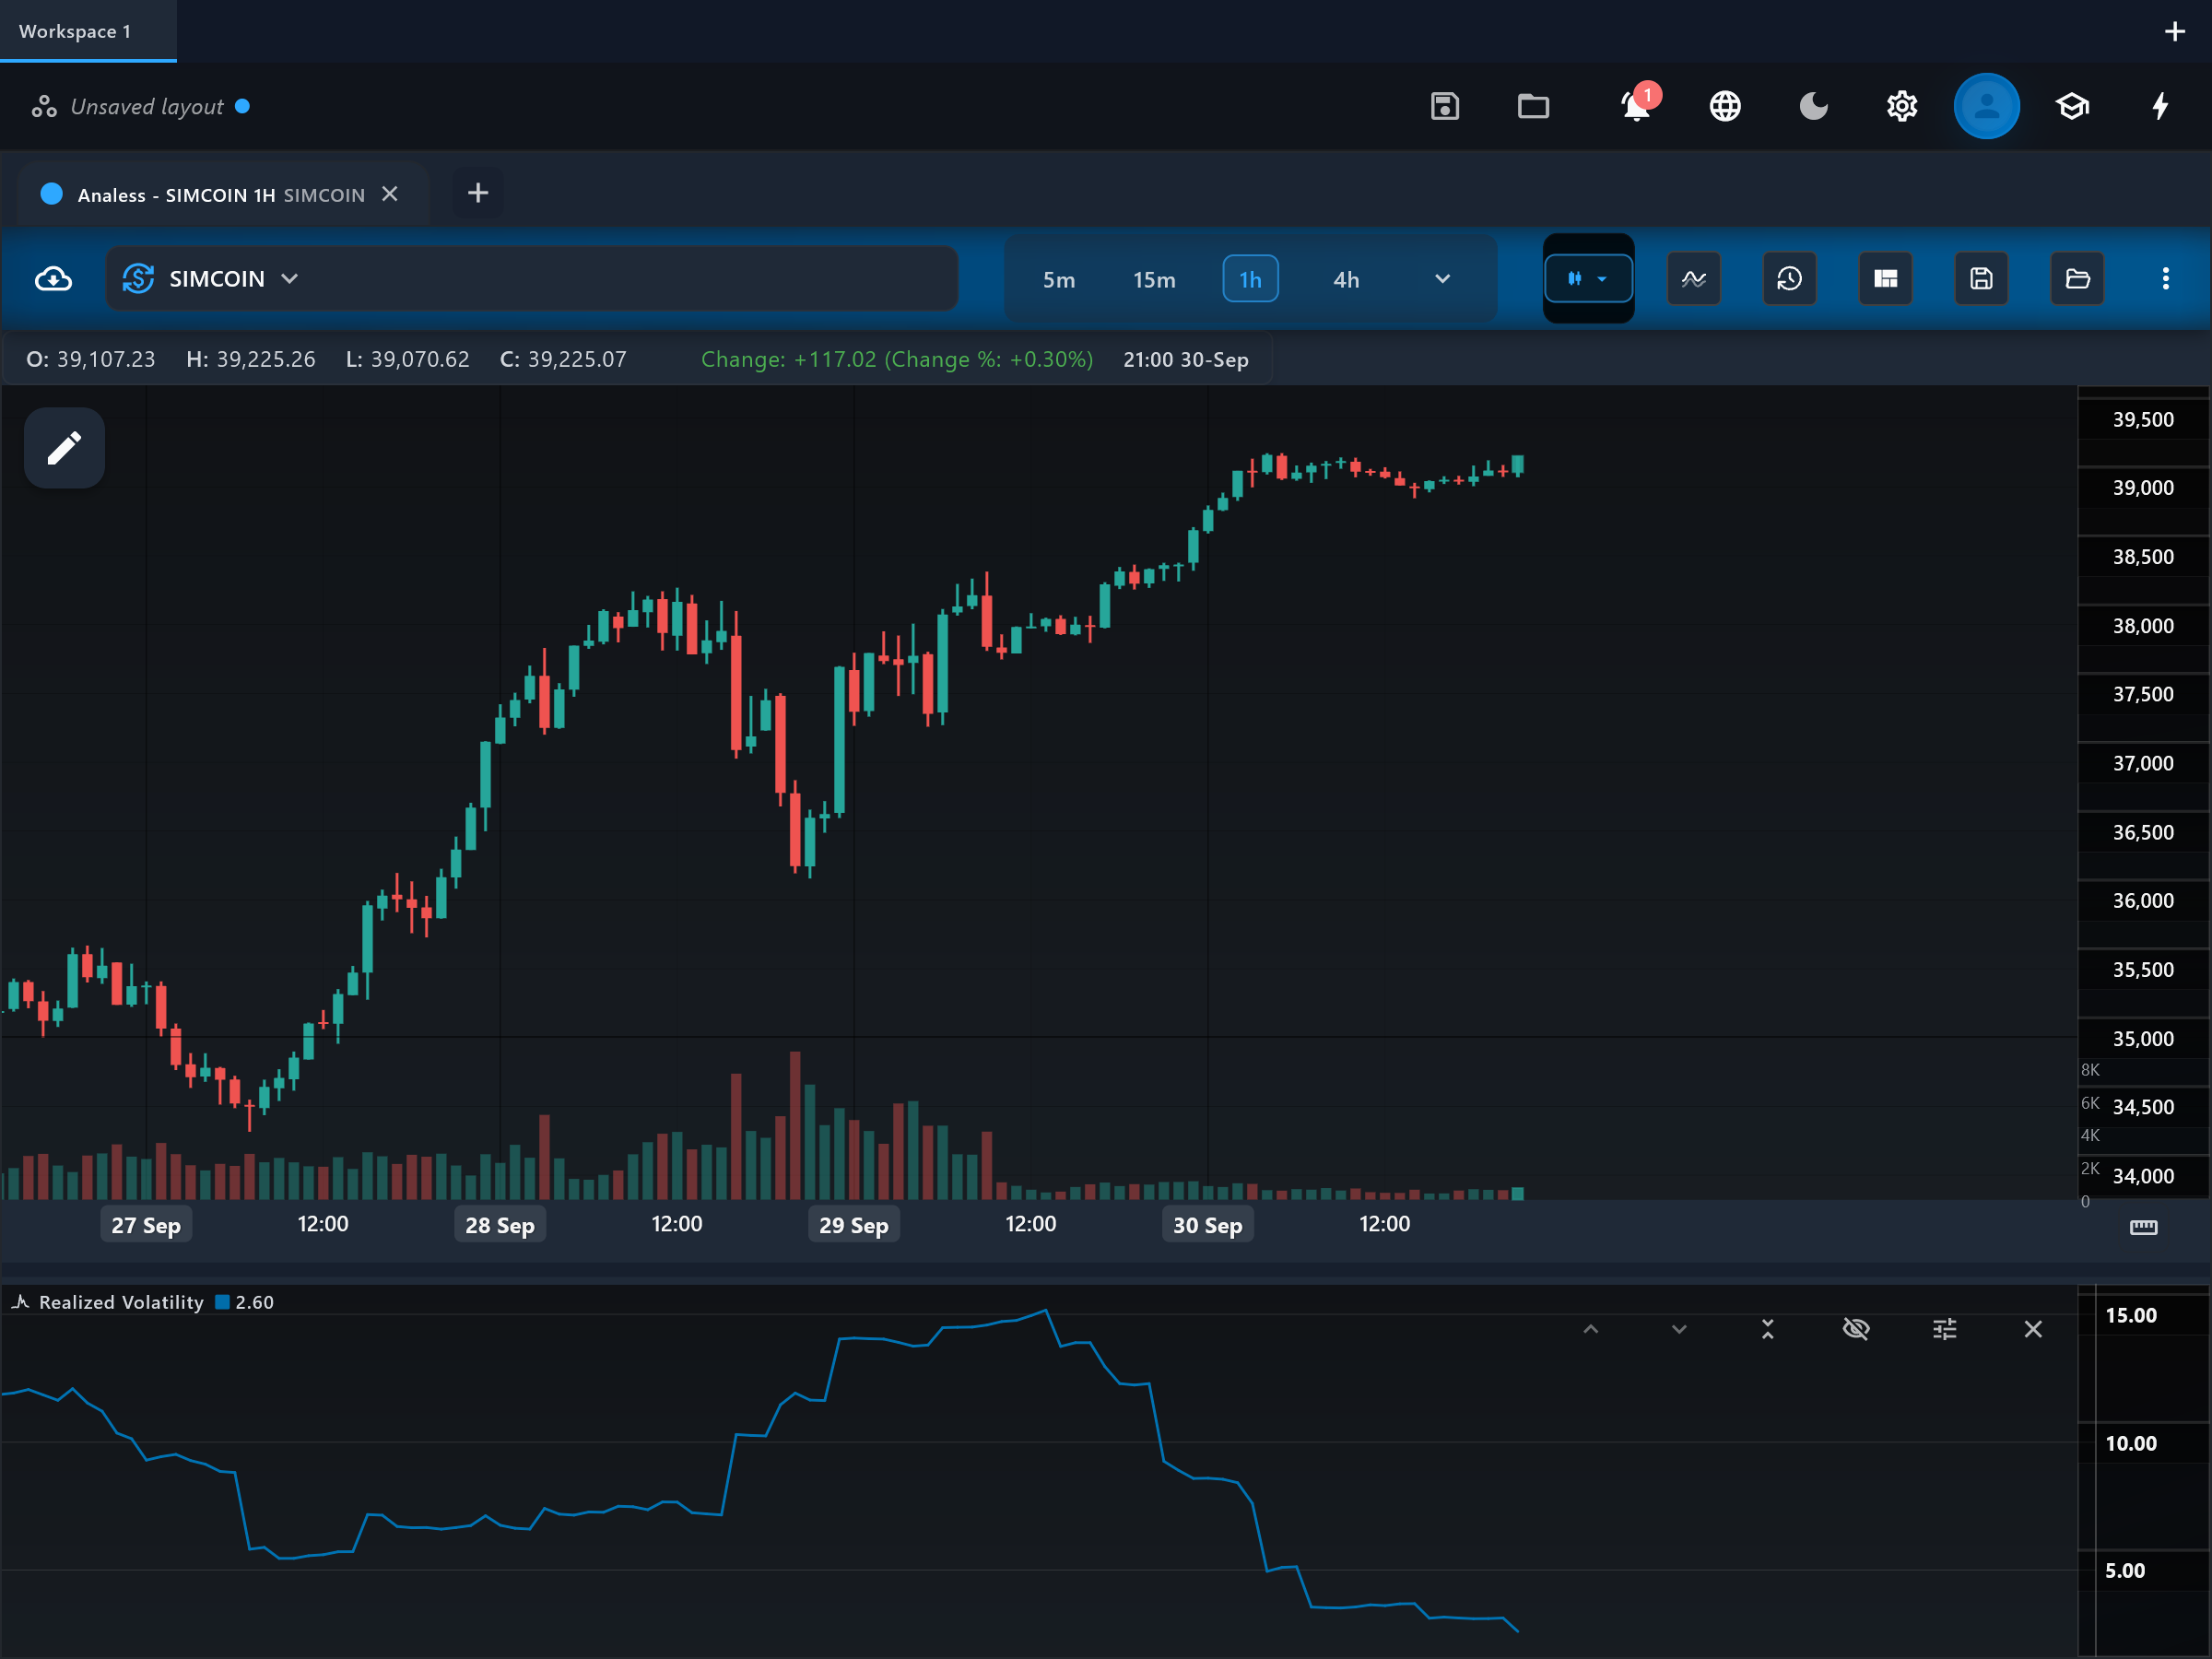
Realized Volatility expresses how much this symbol has actually been moving, as an annualized percentage, using only the chart's own price data. Despite the internal id "vix", this is NOT the CBOE VIX: the real VIX is computed from S&P 500 option prices and measures the volatility the options market expects, while this indicator measures the volatility that has already happened in this symbol's bars.
How it is calculated
Two estimates are computed over the chosen period (default 22 bars, about one trading month of daily data): the standard deviation of close-to-close log returns, and the standard deviation of each bar's intra-bar log range (a Parkinson-style high/low estimator). The two are averaged with equal weight and annualized by multiplying by the square root of 252 and by 100, yielding an annualized percentage. The range component lets the estimate use information inside each bar, not just where it closed.
How to read it
A single line, vix_line, is plotted in its own pane on a percentage scale. Higher readings mean the symbol has been swinging harder; lower readings mean calm. Because it is annualized and normalized, values are comparable across symbols and against familiar volatility benchmarks — for instance, 15 is quiet and 60 is stormy by large-cap equity standards. Rising vix_line during a sell-off reflects the classic volatility/fear link, but remember it is trailing data, not a market forecast.
What to look for
- SqueezeContext
vix_line grinding down to a long-term low marks a volatility compression — complacent, quiet conditions that often precede an expansion.
- Turning patternUpside
An extreme spike in vix_line during a steep decline is consistent with capitulation; historically, volatility peaks tend to cluster near price bottoms.
- ConfirmationContext
Because the scale is annualized and comparable across charts, it is useful for sizing risk consistently across symbols.
When to use it
Works on any symbol with reliable high/low data, and is most interpretable on daily charts where the sqrt-252 annualization matches the bar frequency; on intraday or 24/7 crypto charts treat the absolute level as approximate. It is non-directional. Do not use it as a substitute for the actual CBOE VIX or for options-implied volatility — it cannot see market expectations, only history.
Works well with
Settings explained
period- The estimation window (default 22 bars, roughly one month of daily data). Shorter windows track volatility shifts faster but produce a jumpier line; longer windows describe the slower regime.
Limitations and common mistakes
- It is NOT the CBOE VIX — that index is derived from option prices and looks forward; this one is computed from past bars of the charted symbol and looks backward.
- The sqrt-252 annualization assumes daily-bar frequency; on other timeframes the absolute percentage is only indicative.
- Non-directional, and like all realized measures it reacts after the volatility has already happened.
References
- Origin: Michael Parkinson, 1980 (range estimator); app-specific blend.
- Volatility (finance) — Wikipedia (opens in a new tab)
This page explains how an indicator is calculated and read. It describes past data, not what price will do next, and it is not a recommendation to trade. Read the disclaimers.
Try it in Analess
Add Realized Volatility to any chart, adjust its settings, and open this explainer from the indicator itself.