















Indicators · Volatility
Bollinger Bands %B
Locates price within its Bollinger Bands as a single number.
Origin: John Bollinger, 1980s
- Best suited to
- Ranging markets
- Responsiveness
- Coincident
- Family
- Volatility
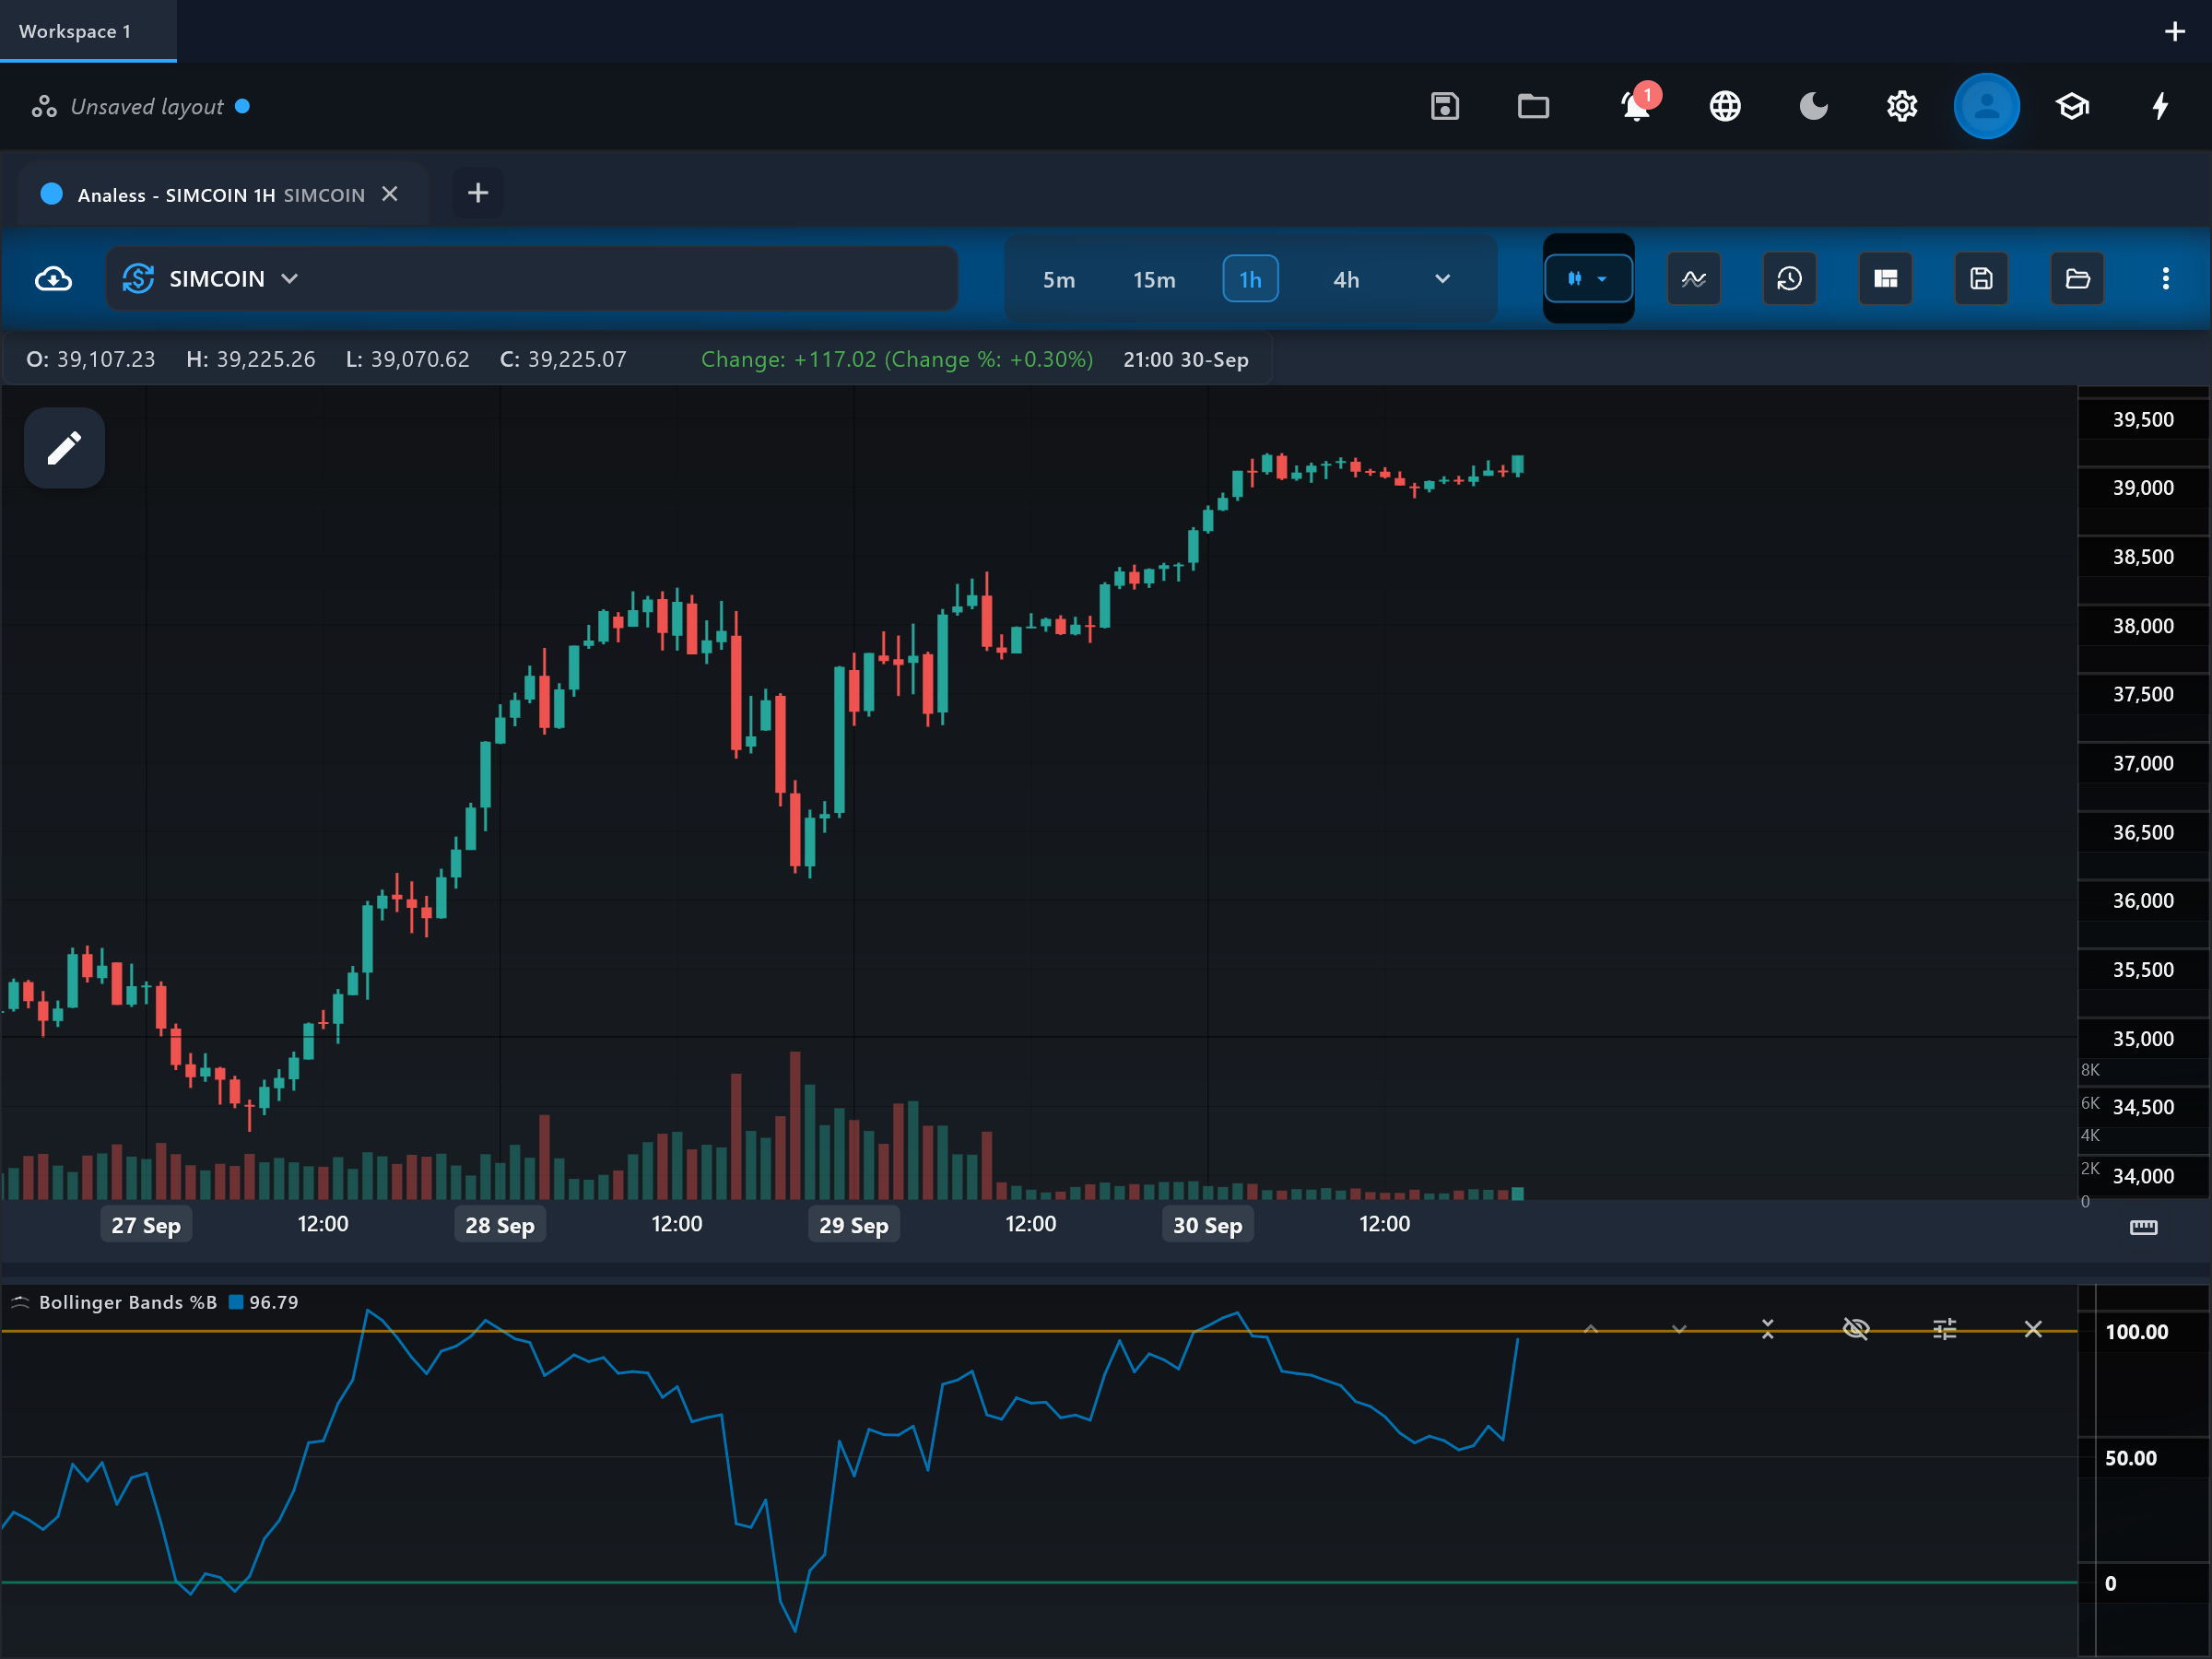
What it is
Bollinger Bands %B tells you exactly where price sits inside its Bollinger Bands, as one number. It turns the visual "is price near the upper or lower band?" question into an oscillator you can read precisely and compare over time.
How it is calculated
Standard Bollinger Bands are computed from the source over period with the chosen multiplier, and %B measures price's position between them: (price − lower) / (upper − lower). A value at the oversold level means price is sitting on the lower band, the midpoint means it is on the middle SMA, and the overbought level means it is on the upper band; readings beyond those levels mean price has closed outside the bands. When the bands have zero width the value is pinned to the midpoint.
How to read it
The pane shows the percent_b line with two horizontal guides, upper_level and lower_level, marking the configurable overbought and oversold levels (price at the upper and lower band respectively). percent_b oscillating between the guides means price is trading inside its bands. Repeated readings at or beyond upper_level in an uptrend are a sign of strength (a band walk), while the same reading in a range suggests stretched prices. Divergences — price making a new high while percent_b makes a lower high — warn that momentum toward the band is fading.
What to look for
- Overbought / oversoldDownside
In a sideways market, percent_b at or above upper_level shows price stretched to the top of its statistical range and prone to reverting toward the middle band.
- Overbought / oversoldUpside
In a sideways market, percent_b at or below lower_level shows price stretched to the bottom of its range and prone to snapping back.
- Trend filterContext
A band walk — percent_b holding near upper_level (or lower_level) bar after bar — signals a strong trend, not a reversal. Treating a walk as overbought/oversold is the classic %B mistake.
- DivergenceContext
Price making a new extreme while percent_b makes a shallower one shows the move is no longer reaching as far outside its bands — momentum toward the band is fading.
When to use it
Best for mean-reversion reads on range-bound markets and for quantifying band position when building alerts or comparing symbols. In strong trends its overbought/oversold reads fail systematically — price can ride the upper band for weeks — so confirm the regime first. It works on any liquid symbol and timeframe.
Works well with
Settings explained
period- The Bollinger lookback (default 20). Shorter periods make %B twitchier; longer ones anchor it to a slower baseline.
multiplier- The band width in standard deviations (default 2.0). A larger multiplier widens the bands, so extreme %B readings become rarer and more significant.
source- The price used for both the bands and the position calculation (default close).
overboughtLevel- Where the upper guide is drawn on the 0-100 scale (default 100 — price exactly on the upper band). Raise it slightly to only flag closes outside the bands; lower it to flag stretched readings earlier.
oversoldLevel- Where the lower guide is drawn on the 0-100 scale (default 0 — price exactly on the lower band). Lower it to only flag closes outside the bands; raise it to react earlier.
Limitations and common mistakes
- In trends, extreme %B is a strength signal, not a reversal signal — the indicator cannot tell the two regimes apart by itself.
- During a tight squeeze the bands are so narrow that tiny price moves swing %B violently.
- It inherits all the assumptions of Bollinger Bands, including the lookback and multiplier choices.
References
- Origin: John Bollinger, 1980s.
- Bollinger Bands — Wikipedia (opens in a new tab)
This page explains how an indicator is calculated and read. It describes past data, not what price will do next, and it is not a recommendation to trade. Read the disclaimers.
Try it in Analess
Add Bollinger Bands %B to any chart, adjust its settings, and open this explainer from the indicator itself.