















Indicators · Volatility
Chaikin Volatility
Measures volatility from the spread between high and low over time.
Origin: Marc Chaikin, 1980s
- Best suited to
- Any market condition
- Responsiveness
- Lagging
- Family
- Volatility
What it is
Chaikin Volatility measures how fast the trading range (high minus low) is widening or narrowing, expressed as a rate of change. Instead of asking "how volatile is it?", it asks "is volatility increasing or decreasing right now?"
How it is calculated
The indicator smooths each bar's high-minus-low range with an exponential moving average over period (default 10), then computes the percentage change of that smoothed range compared with rocPeriod bars ago (default 10). Positive values mean the average range is wider than it was; negative values mean it has contracted. Note that, unlike ATR, it ignores gaps between bars because it uses only intra-bar range.
How to read it
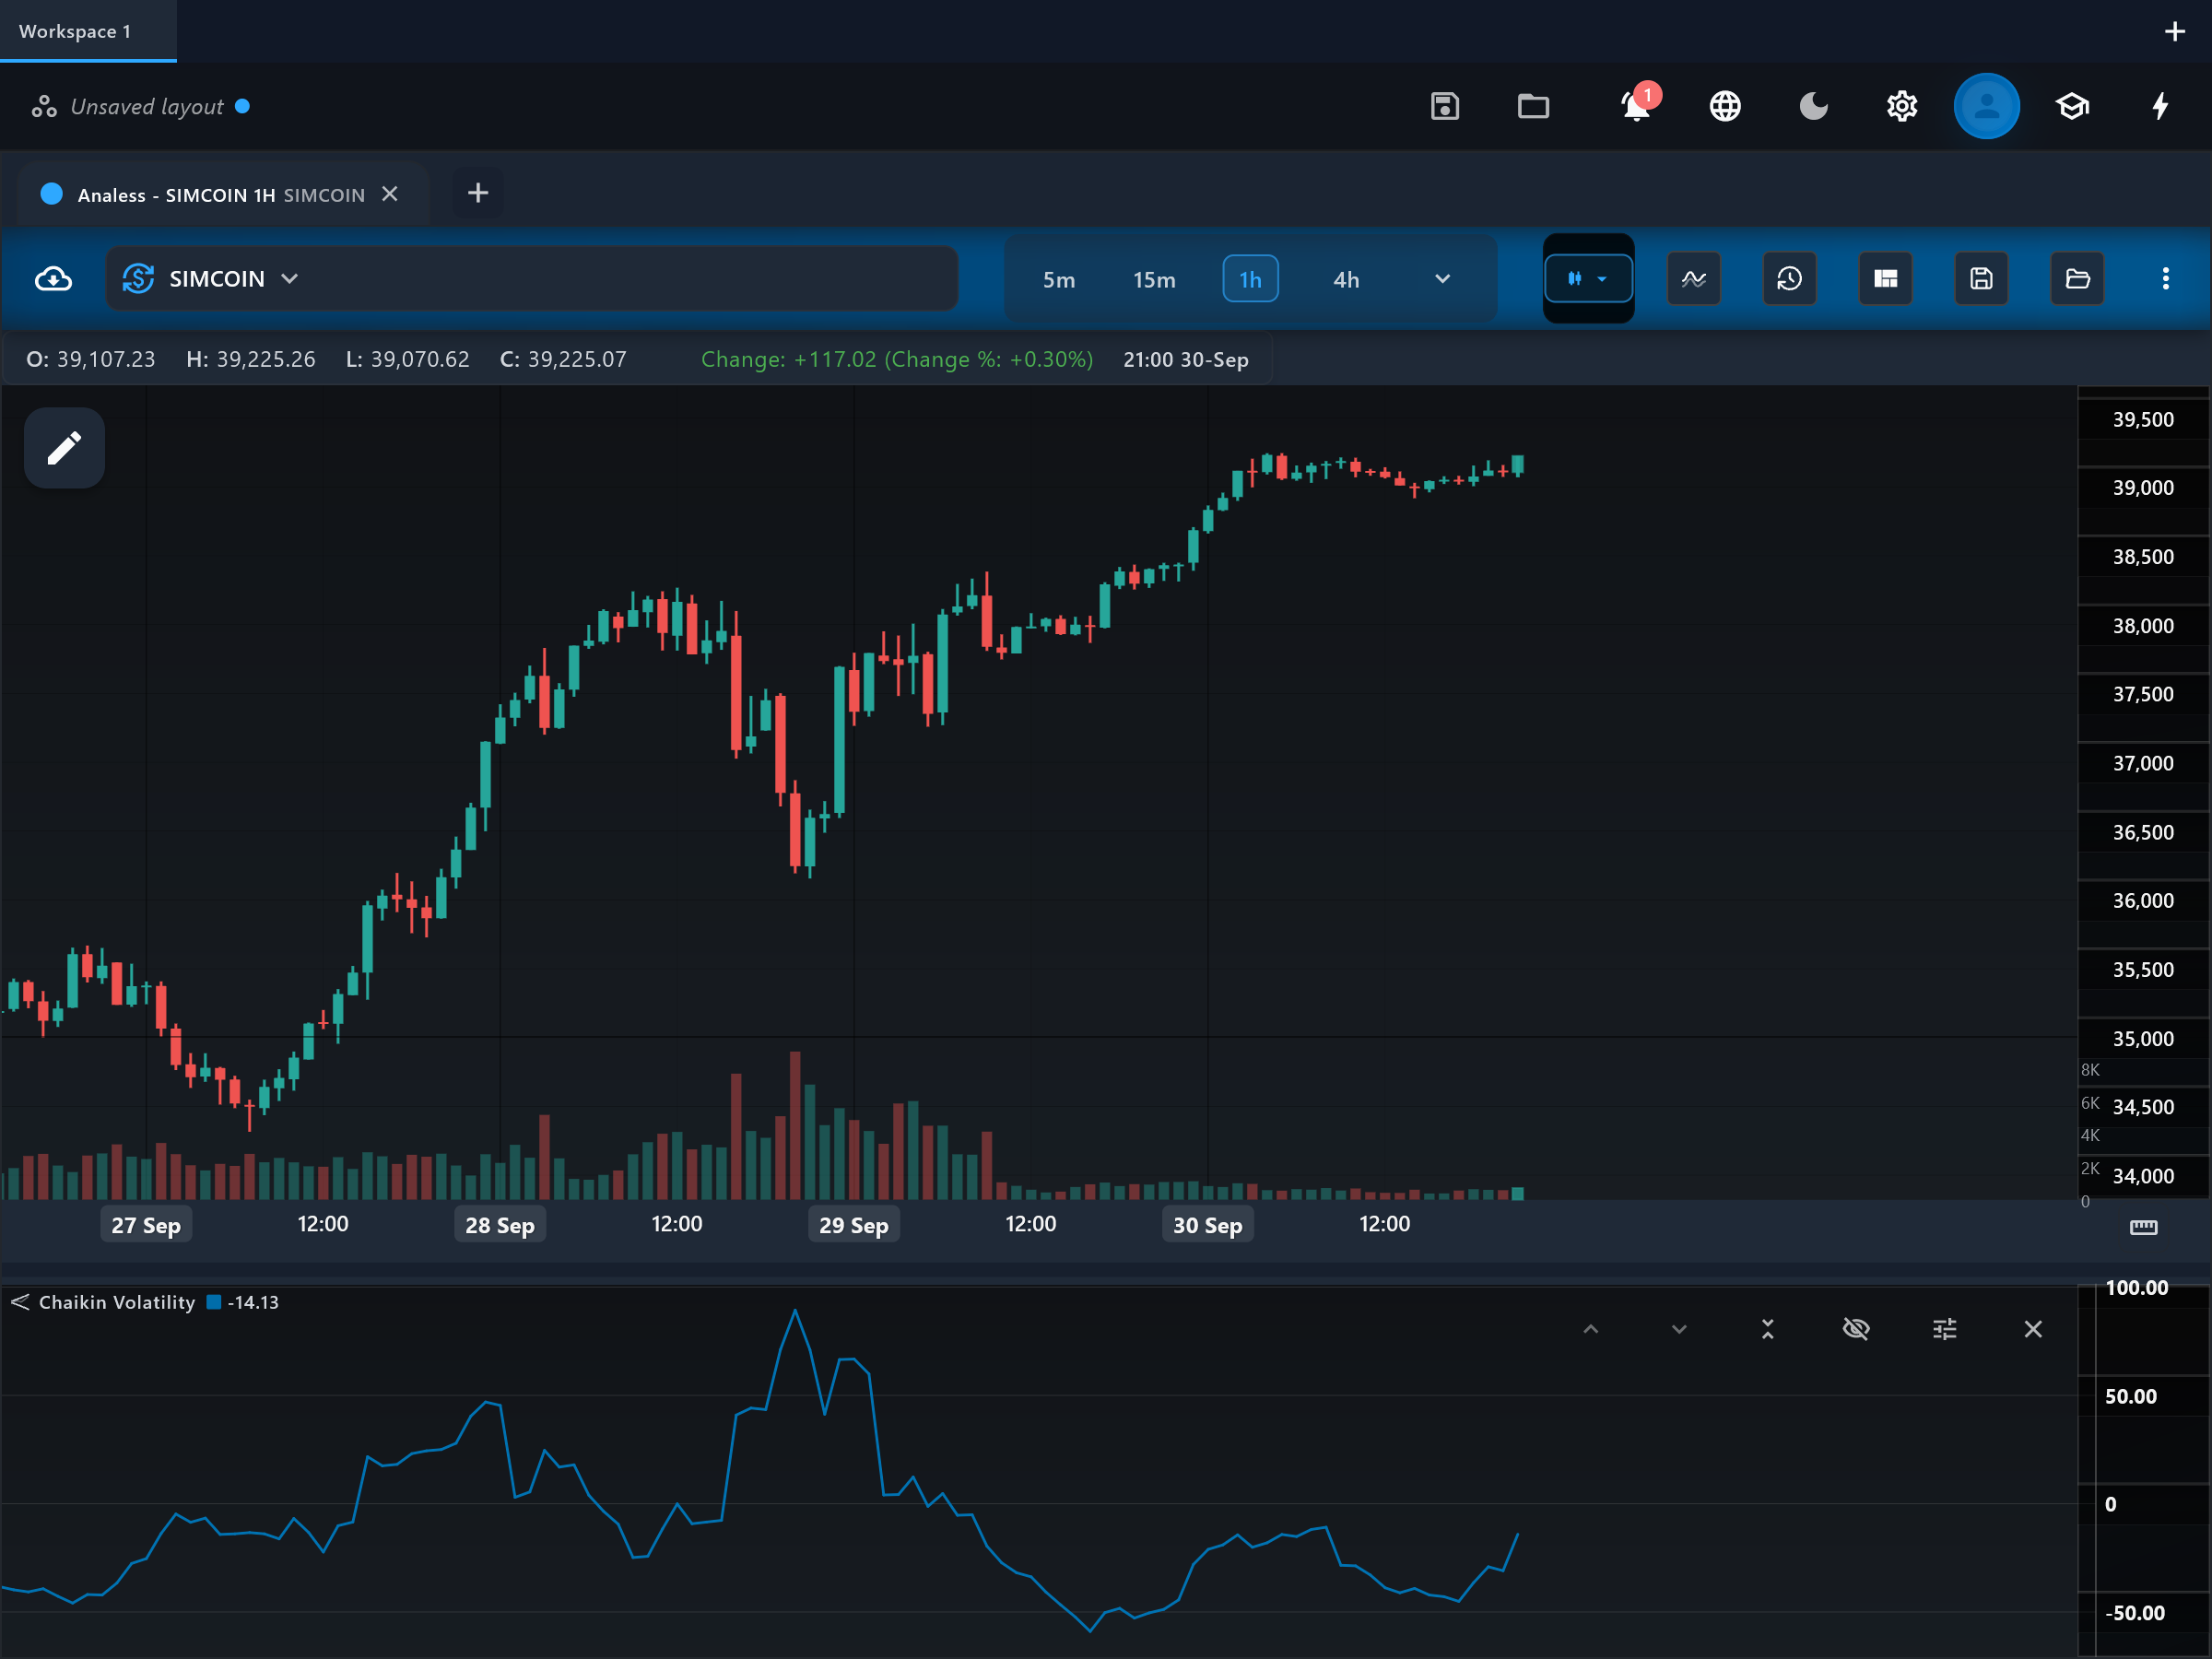
A single line, chaikin_volatility, oscillates around zero in its own pane on a percentage scale. Readings above zero show expanding ranges; below zero, contracting ranges. Chaikin's own interpretation is contrarian at extremes: a volatility spike over a short period often accompanies panic selling near market bottoms, while a slow decline in volatility as price drifts up can mark a maturing, complacent top. Read it together with the direction of price, since the line itself is direction-blind.
What to look for
- Turning patternUpside
A sharp upward spike in chaikin_volatility during a steep decline is consistent with capitulation — ranges blow out as sellers panic — which often occurs near tradable bottoms.
- SqueezeContext
A sustained slide into deeply negative territory shows ranges compressing — a quiet spell that frequently precedes the next expansion.
- ConfirmationContext
Rising volatility alongside a price breakout adds evidence that the move has real participation behind it.
When to use it
Suited to markets where intra-bar range carries the volatility story — equities and indices on daily charts especially. Because it ignores overnight gaps, it understates volatility on symbols that gap frequently; ATR is the better gauge there. It is non-directional, so never trade its extremes without checking what price itself is doing.
Works well with
Settings explained
period- The EMA length applied to the high-low range (default 10). Longer values smooth the range series more, filtering one-bar outliers.
rocPeriod- How many bars back the smoothed range is compared against (default 10). Shorter values catch volatility shifts sooner but whipsaw more.
Limitations and common mistakes
- Gaps between bars are invisible to it, unlike ATR's true range.
- The contrarian spike-at-bottoms interpretation is a tendency, not a rule — volatility spikes also occur mid-crash.
- Two smoothing choices (EMA then ROC) make it doubly sensitive to parameter selection.
References
- Origin: Marc Chaikin, 1980s.
This page explains how an indicator is calculated and read. It describes past data, not what price will do next, and it is not a recommendation to trade. Read the disclaimers.
Try it in Analess
Add Chaikin Volatility to any chart, adjust its settings, and open this explainer from the indicator itself.