















Indicators · Volatility
Mass Index
Sums the ratio of a 9-period EMA of the high-low range to an EMA of that EMA, over 25 periods.
Origin: Donald Dorsey, 1992
- Best suited to
- Trending markets
- Responsiveness
- Leading
- Family
- Volatility
What it is
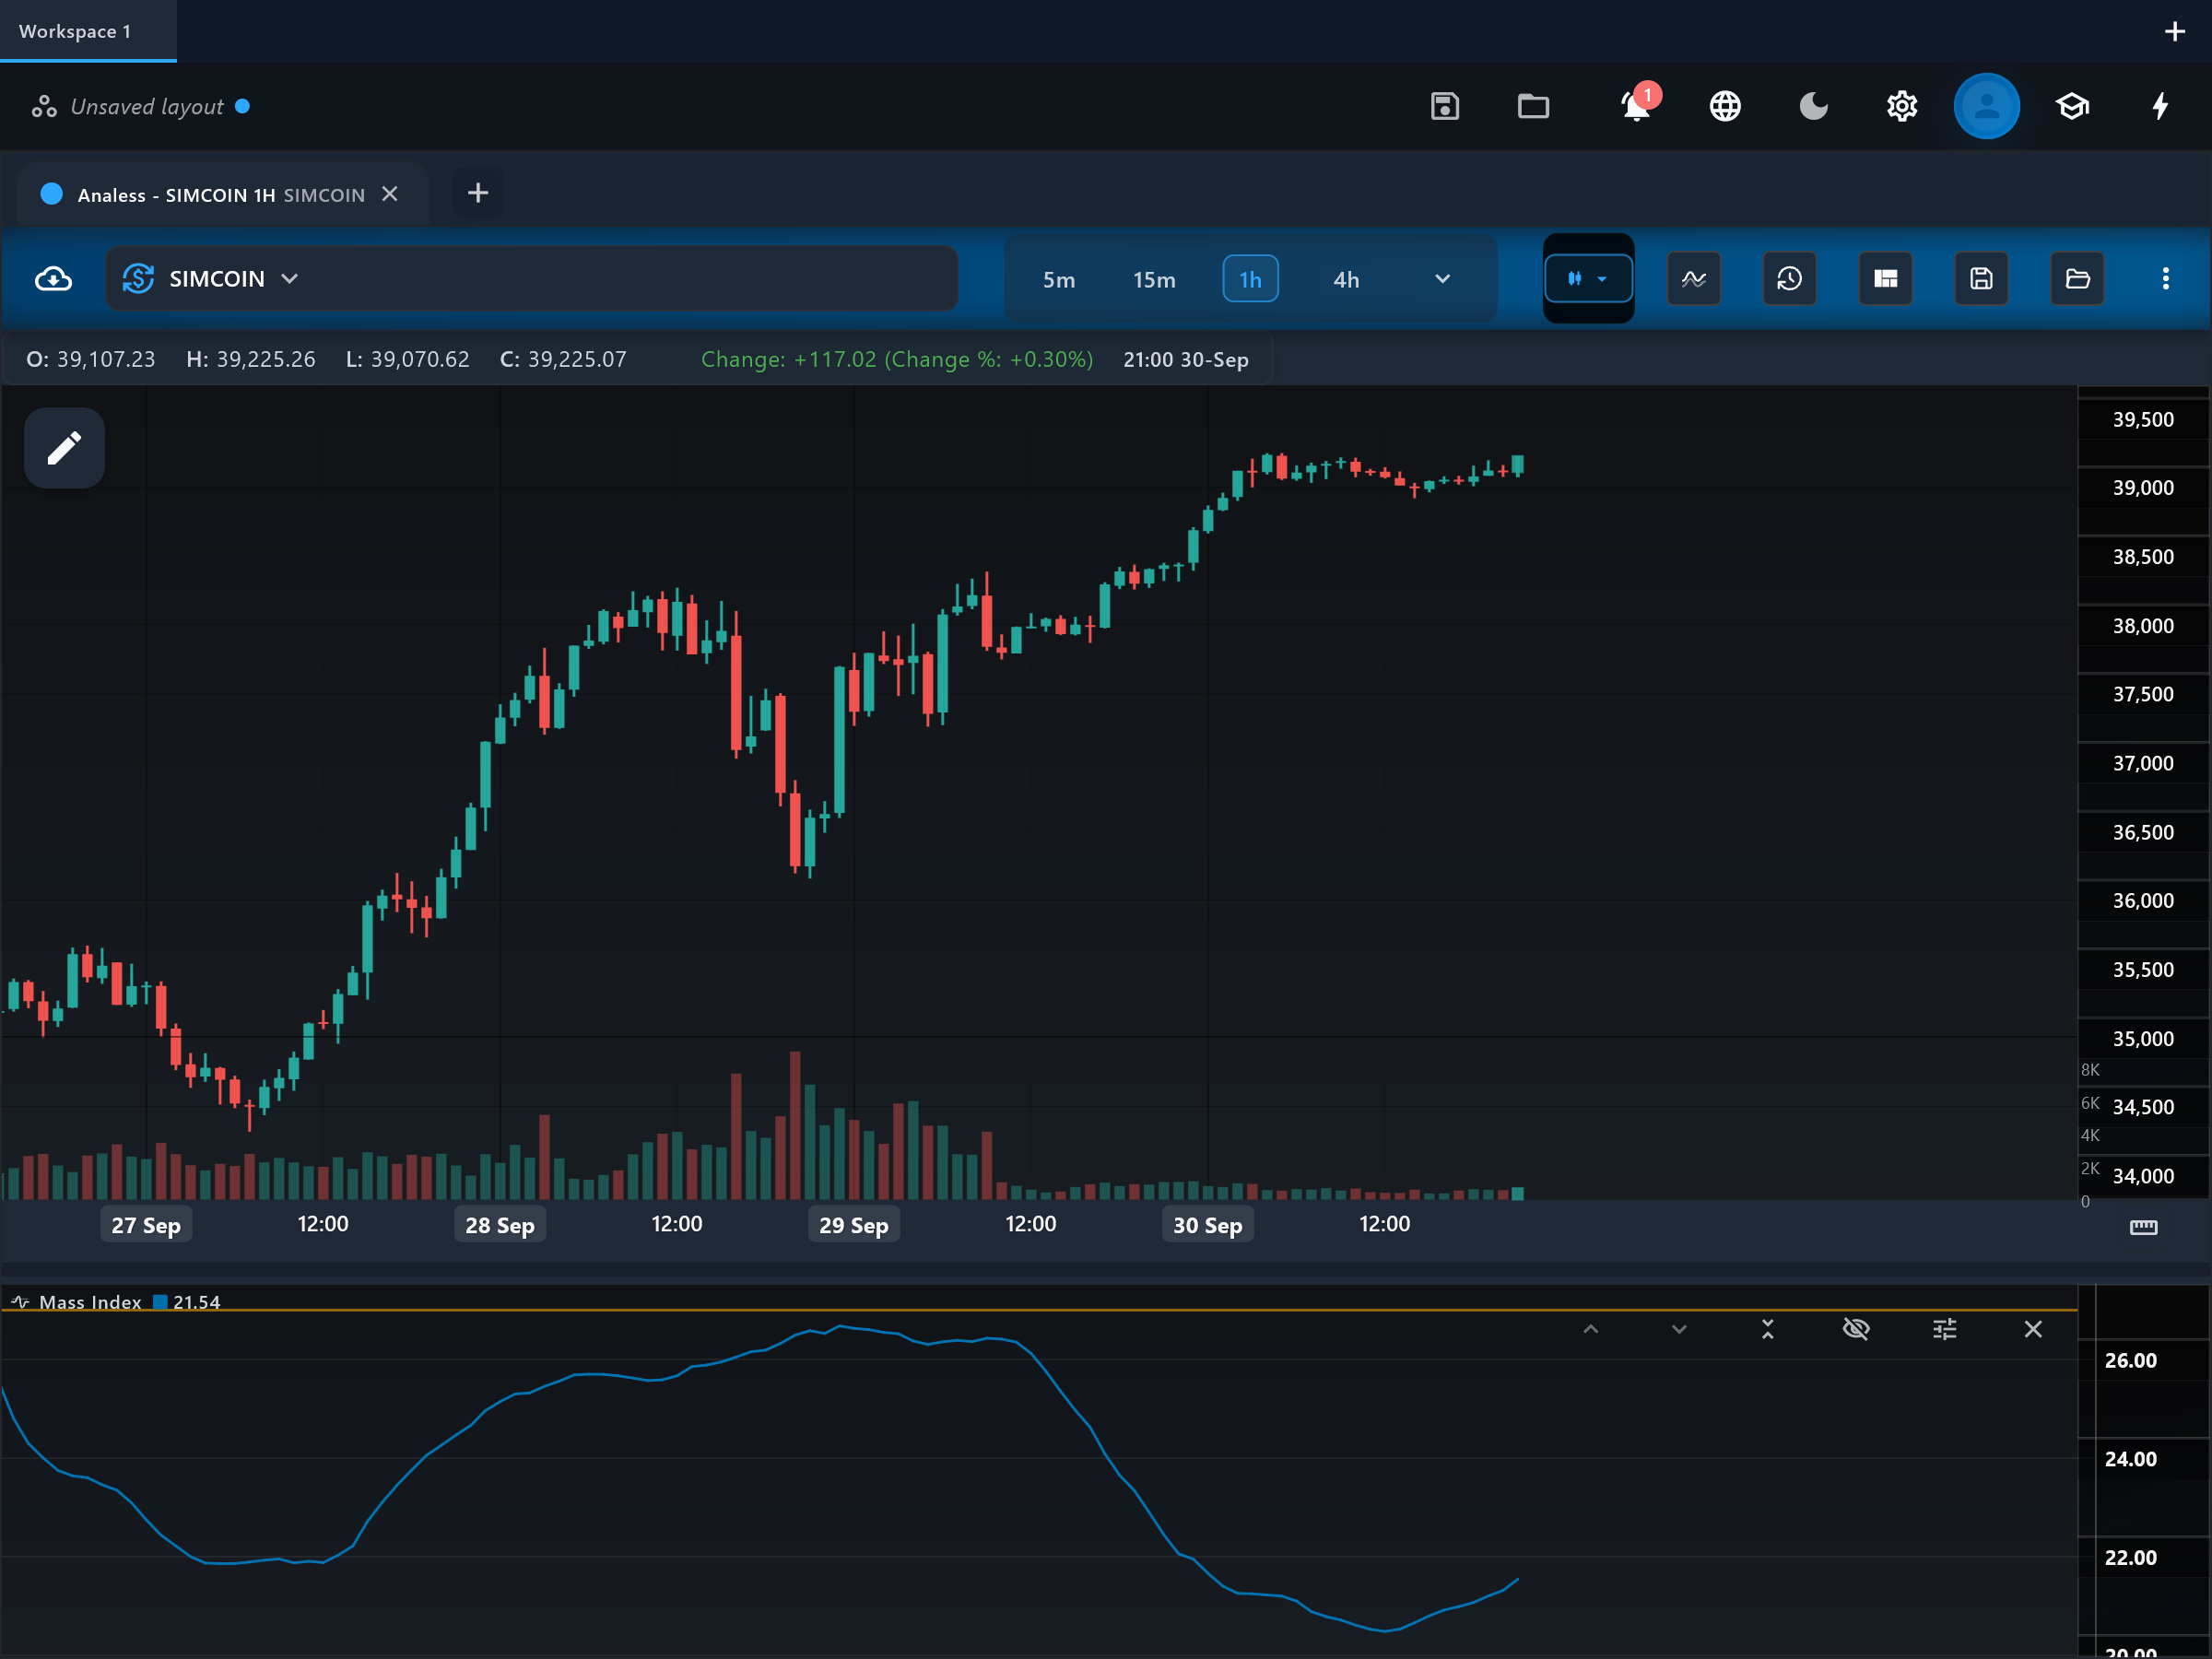
The Mass Index hunts for trend reversals by watching the high-low range "breathe". When ranges widen sharply and then contract — a pattern Dorsey called the reversal bulge — the prevailing trend, in either direction, has an elevated chance of turning.
How it is calculated
Each bar's high-minus-low range is smoothed with an EMA over emaPeriod (default 9), that EMA is smoothed again with a second EMA of the same length, and the ratio of single-smoothed to double-smoothed EMA is summed over the last period bars (default 25). When ranges expand quickly the ratio exceeds 1 and the sum inflates; as ranges settle, it deflates.
How to read it
The pane shows the mass_index line and a horizontal setup guide at 27. With the default 25-bar sum the line normally hovers in the low-to-mid 20s. The classic sequence is two-step: first the line rises above 27 (the "setup" — ranges have bulged), then it drops back below 26.5 (the "trigger" — the bulge has deflated). Only after the trigger does the indicator suggest the current trend is vulnerable; the direction of the reversal must be read from price or a directional tool, because the Mass Index itself is direction-blind.
What to look for
- Turning patternContext
The reversal bulge: mass_index rises above 27 and then falls back below 26.5. Dorsey's rule treats this as a warning that the trend in force — up or down — may reverse.
- ConfirmationContext
Dorsey paired the bulge with a short EMA of price to supply the direction: after a trigger, trade in the direction the EMA then turns.
- SqueezeContext
A low, flat mass_index means ranges are compressed and stable — no reversal setup is forming, and trend-following signals face fewer volatility ambushes.
When to use it
Designed for daily charts of trending instruments — equities and indices in Dorsey's original work — where range expansions are meaningful events. The 27/26.5 thresholds were calibrated for the default settings; changing periods invalidates them. It is non-directional and unusual in that it deliberately ignores price direction entirely, so it must always be paired with a directional tool. Avoid it on choppy, thin symbols where ranges bulge randomly.
Works well with
Settings explained
emaPeriod- The length of both range EMAs (default 9, Dorsey's original). Changing it alters the ratio's sensitivity and shifts the line away from the calibrated 27/26.5 levels.
period- How many ratio values are summed (default 25). The classic thresholds assume 25; a longer sum raises the line's typical level, a shorter one lowers it.
Limitations and common mistakes
- It never indicates direction — a bulge before a bottom looks identical to one before a top.
- The 27/26.5 thresholds only apply to the default 9/25 settings and to markets with behavior similar to those it was calibrated on.
- Reversal bulges are infrequent; the indicator can stay silent for long stretches.
- Not every bulge resolves in a reversal — trends sometimes survive the volatility episode.
References
- Origin: Donald Dorsey, 1992.
- Mass index — Wikipedia (opens in a new tab)
This page explains how an indicator is calculated and read. It describes past data, not what price will do next, and it is not a recommendation to trade. Read the disclaimers.
Try it in Analess
Add Mass Index to any chart, adjust its settings, and open this explainer from the indicator itself.