















Indicators · Trend
Chande Kroll Stop
A volatility-based trailing stop level that follows the trend.
Origin: Tushar Chande and Stanley Kroll, 1994
- Best suited to
- Trending markets
- Responsiveness
- Lagging
- Family
- Trend
What it is
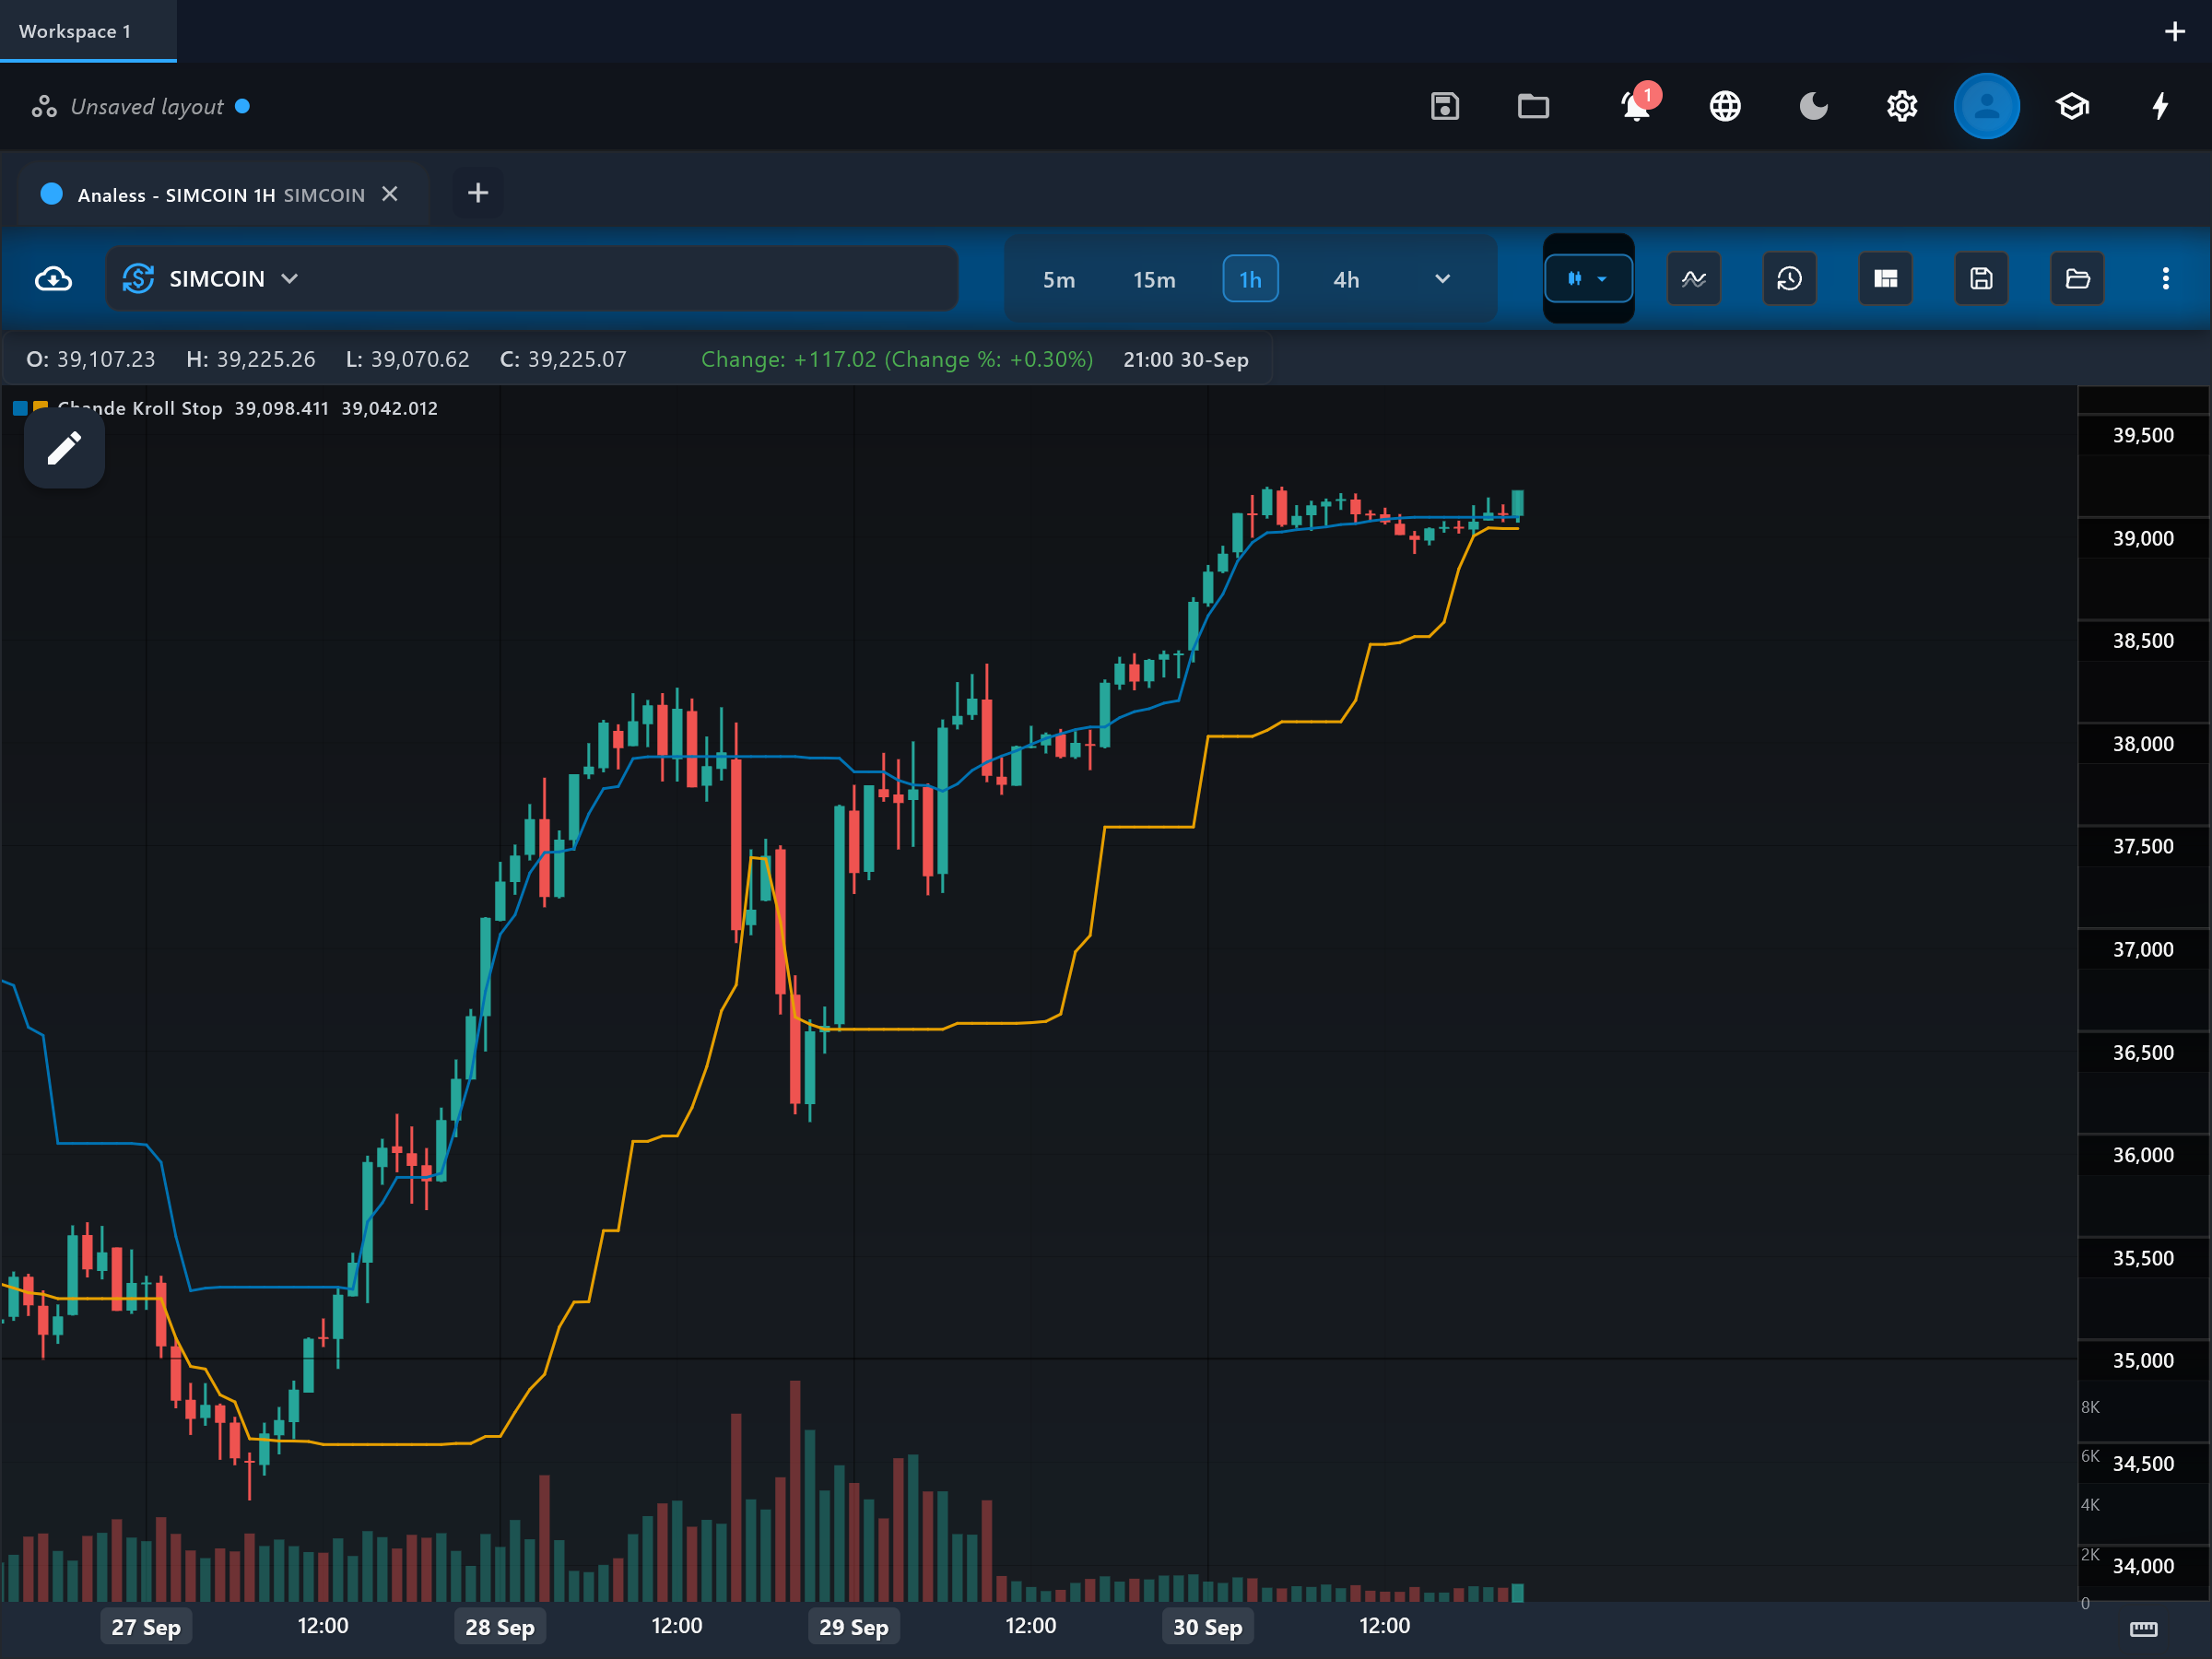
The Chande Kroll Stop plots two volatility-adjusted trailing-stop lines on the price chart: one for protecting long positions and one for shorts. It answers "where should my stop be, given this market's volatility?" rather than "when should I enter?".
How it is calculated
A preliminary long stop is the highest high of the ATR window minus a multiple of ATR (Wilder-smoothed true range); it is then run through a second highest-of window so the stop steps up smoothly and resists dipping on noise. The short stop mirrors this: lowest low plus the ATR multiple, passed through a lowest-of window. Volatile markets automatically push the stops further from price.
How to read it
Two lines track price: stop_long below the bars (the exit level for long positions) and stop_short above the bars (the exit level for shorts). While a trend is healthy, price stays on the correct side of its stop line and the line ratchets along behind the move. A close below stop_long ends the long regime; a close above stop_short ends the short regime. When price is squeezed between the two lines, neither side has a protected trend - treat it as neutral ground.
What to look for
- Price crossDownside
Price closing below stop_long is the long-exit event - the uptrend has given back more than its volatility allowance.
- Price crossUpside
Price closing above stop_short is the short-exit event, and for some traders a signal that the downtrend has failed.
- Trend filterContext
Price chopping between stop_long and stop_short marks a no-man's-land: no protected trend in either direction.
- ConfirmationContext
A steadily ratcheting stop_long under rising price confirms an orderly uptrend; a stop that keeps getting hit and re-forming reflects an unstable one.
When to use it
This is an exit-management tool for trend traders on swing timeframes - futures, forex, stocks and crypto alike - and pairs naturally with any entry method that needs a volatility-aware stop. Because the stop distance scales with ATR, it travels well across instruments of different volatility. It does not mark entries, and in flat markets its exits fire constantly because price hovers between the two lines.
Works well with
Settings explained
atrPeriod- Default 10. The window for both the ATR and the initial highest-high / lowest-low. Longer windows anchor the stop to more history and slow its reaction to volatility shifts.
multiplier- Default 1.0. How many ATRs of cushion the stop keeps from the extreme. Raising it (2-3) tolerates deeper pullbacks before stopping out; lowering it produces tighter, more frequent exits.
stopPeriod- Default 9. The second smoothing window (highest/lowest of the preliminary stop). Larger values make the stop line stair-step more smoothly and ignore brief volatility blips.
Limitations and common mistakes
- It manages exits, not entries - on its own it never tells you when to get in.
- In ranging markets price crosses both stops repeatedly, generating a stream of meaningless exit events.
- An ATR spike (news bar) widens the stops abruptly, which can leave more room than intended right when risk is highest.
References
- Origin: Tushar Chande and Stanley Kroll, 1994.
This page explains how an indicator is calculated and read. It describes past data, not what price will do next, and it is not a recommendation to trade. Read the disclaimers.
Try it in Analess
Add Chande Kroll Stop to any chart, adjust its settings, and open this explainer from the indicator itself.