















Indicators · Trend
Ichimoku
A full trend system in one overlay: a cloud, baseline, and conversion line that frame support, resistance, and momentum.
Origin: Goichi Hosoda, 1969
- Best suited to
- Trending markets
- Responsiveness
- Lagging
- Family
- Trend
What it is
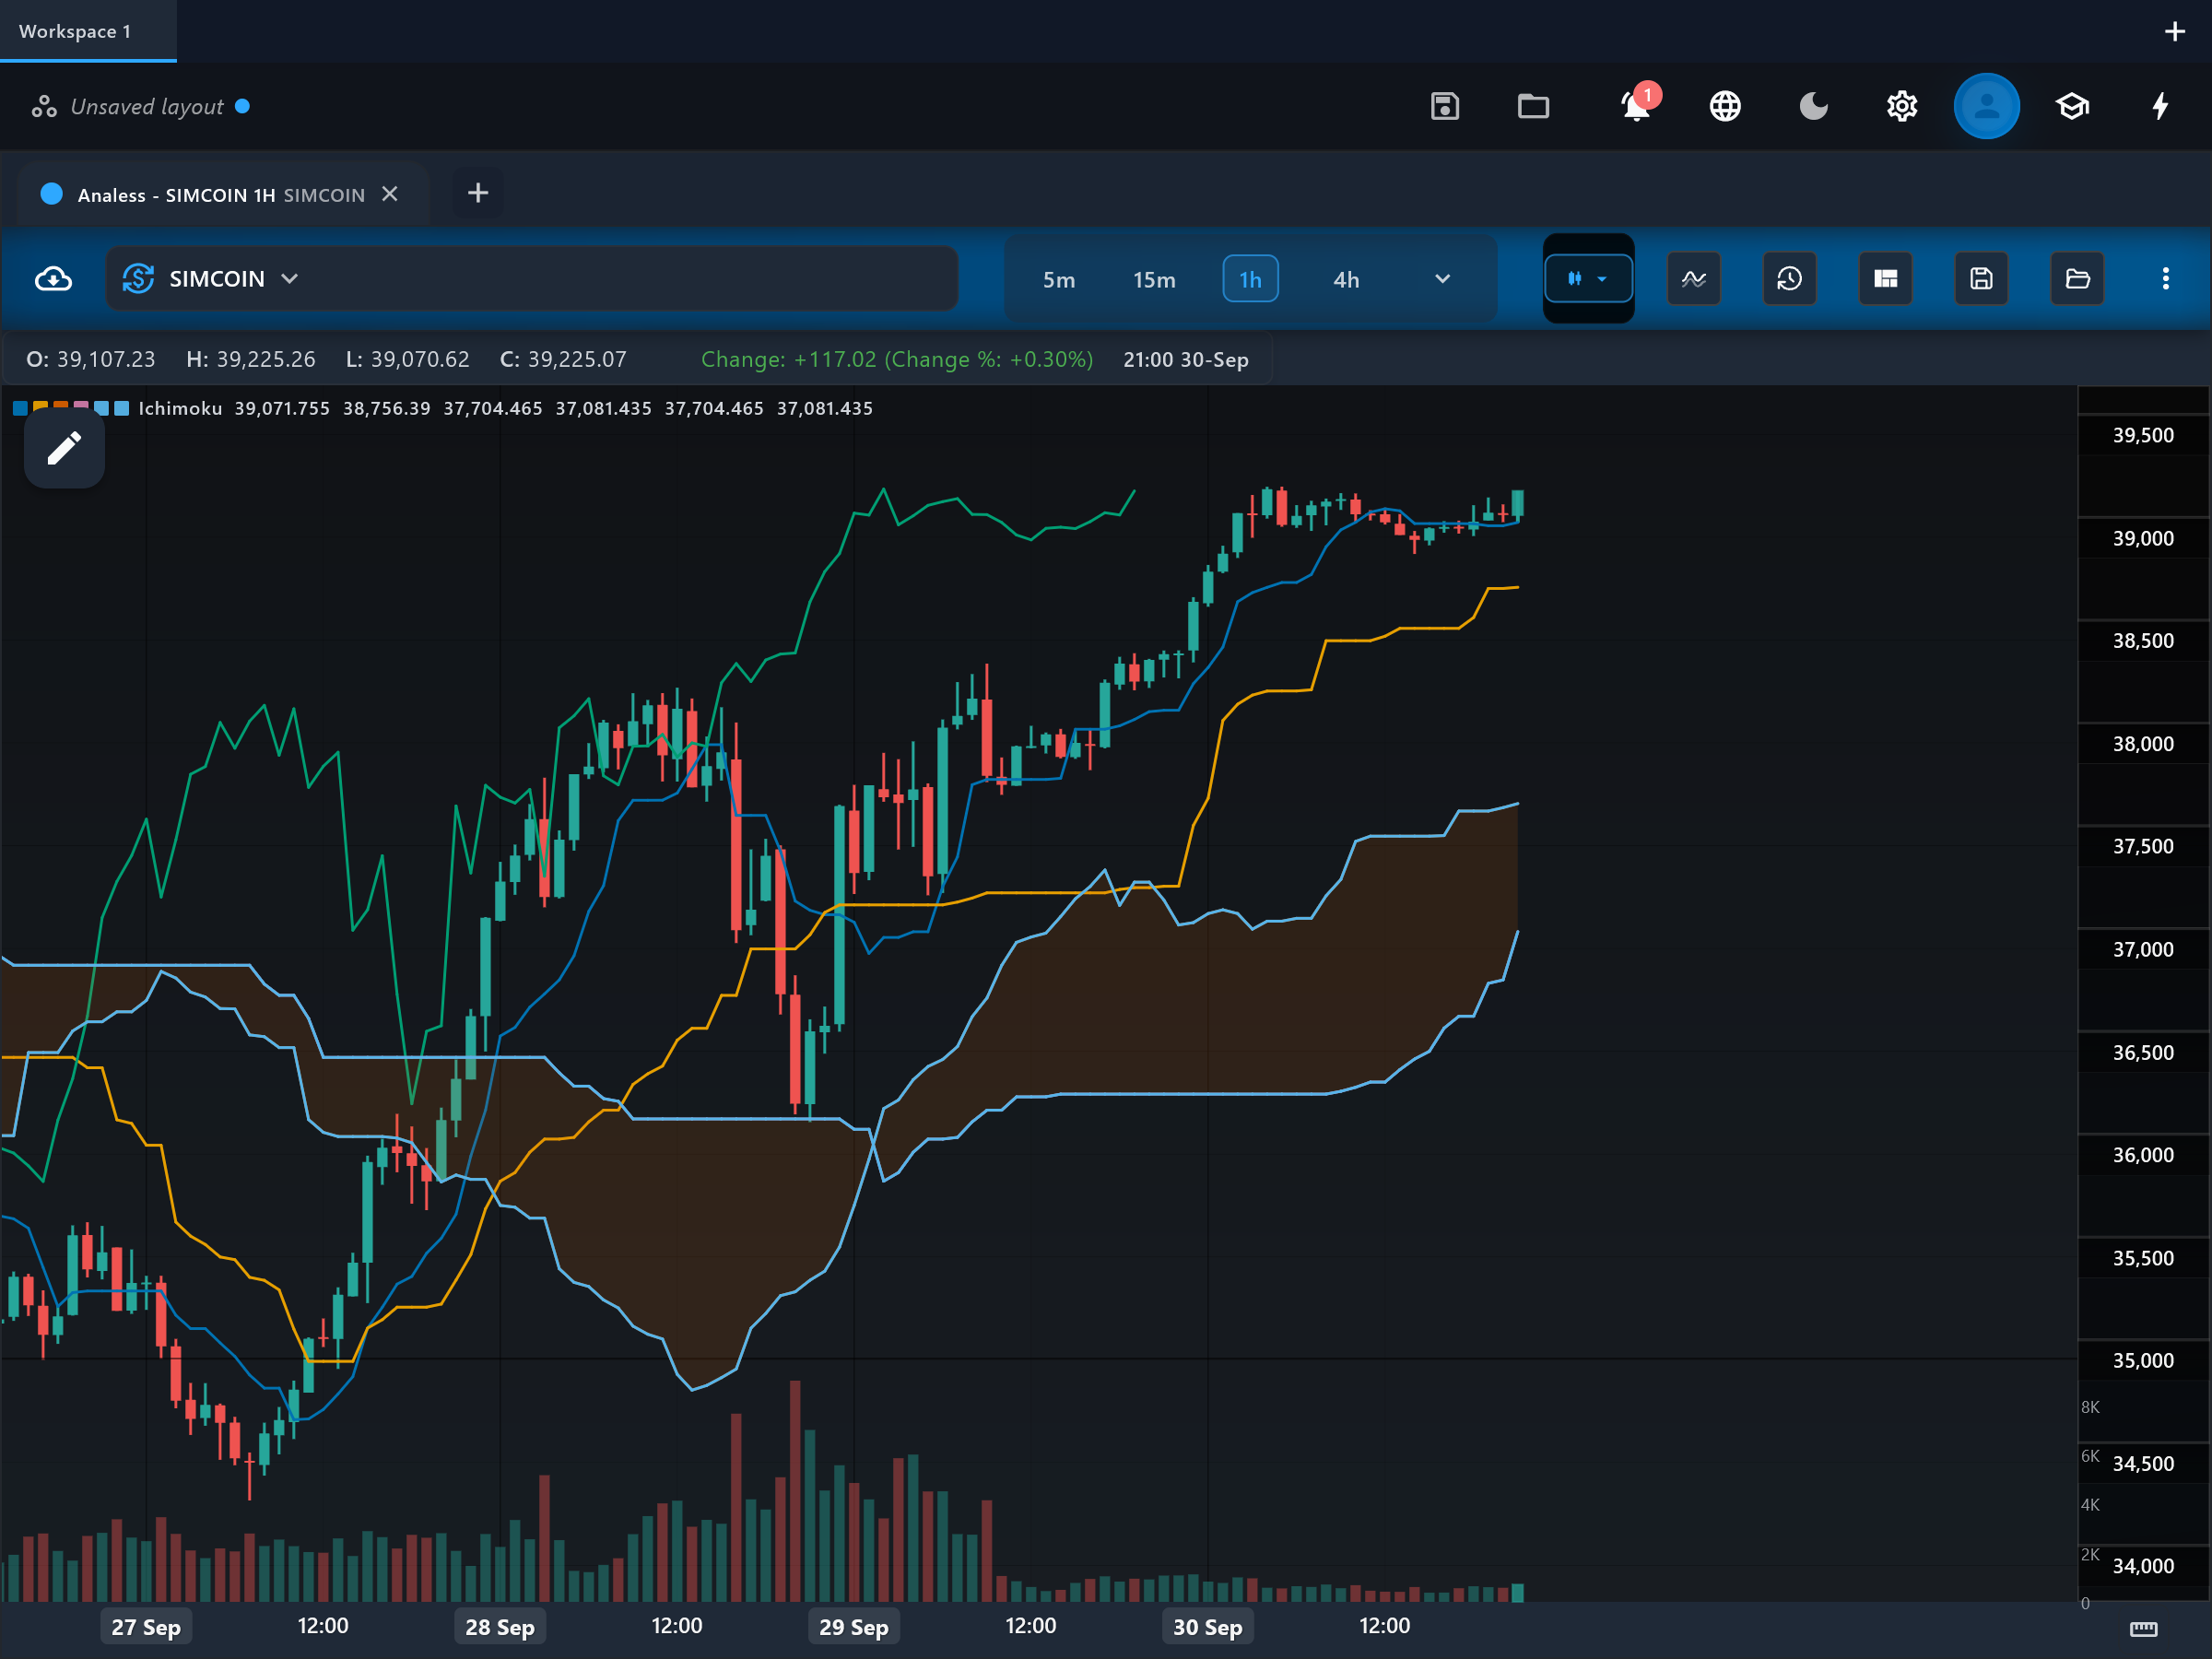
Ichimoku Kinko Hyo ("one-glance equilibrium chart") is a complete trend system of five lines and a shaded cloud, designed so a single glance shows trend direction, momentum, and support/resistance. It is unusual in plotting parts of itself into the future and the past.
How it is calculated
Every line is a midpoint, not an average: tenkan is the middle of the highest high and lowest low of the last 9 bars, kijun the same over 26 bars. senkou_a is the midpoint of tenkan and kijun plotted 26 bars FORWARD; senkou_b is the 52-bar midpoint, also plotted 26 bars forward - together they bound the cloud. chikou is today's close plotted 26 bars BACKWARD, comparing the present to the recent past.
How to read it
On the price chart you see tenkan (fast midpoint), kijun (slow midpoint), the displaced spans senkou_a and senkou_b with the shaded cloud between them, and the chikou lagging line. Price above the cloud is the bullish regime, below it bearish, inside it undecided - and the cloud ahead of the current bar projects future support/resistance because the spans are drawn forward. tenkan/kijun act like a fast/slow moving-average pair for timing. chikou clearing the price bars of 26 periods ago confirms that today's close beats the past - a momentum check. Note the displacement: the cloud you see ahead was computed from bars already closed, and chikou is drawn behind the current bar.
What to look for
- Price crossUpside
Price breaking and holding above the cloud marks a shift to the bullish regime; the cloud beneath becomes layered support.
- Price crossDownside
Price breaking below the cloud marks the bearish regime, with the cloud above acting as resistance.
- Signal-line crossUpside
tenkan crossing above kijun is the classic timing signal - strongest when it happens above the cloud, weakest below it.
- Signal-line crossDownside
tenkan crossing below kijun is the bearish counterpart, strongest when price is already under the cloud.
- ConfirmationContext
chikou sitting clear of the price bars it overlaps confirms the move; chikou tangled in old price action warns of nearby congestion.
- Trend filterContext
A twist ahead - senkou_a and senkou_b crossing in the projected cloud - flags a potential regime change zone at that future date; a thin cloud is easier for price to pierce than a thick one.
When to use it
Ichimoku was developed on daily Japanese equity charts and is at its best on daily and weekly timeframes of trending markets - forex majors, indices, large-cap stocks, and crypto's long directional phases. Its layered confirmations reward patience: the full system wants price, the cross, the cloud and chikou all agreeing. It is a poor fit for tight ranges (price lives inside the cloud and every signal conflicts) and for very short intraday charts, where the 9/26/52 rhythm loses its meaning.
Works well with
Settings explained
tenkanPeriod- Default 9 (Hosoda's original). The fast midpoint window. Shortening it makes tenkan hug price and cross kijun more often; most practitioners keep the traditional value.
kijunPeriod- Default 26. The slow midpoint window and the system's backbone - kijun is the equilibrium level and a common trailing-stop reference. Raising it slows every derived signal, since senkou_a also depends on it.
senkouSpanBPeriod- Default 52. The long midpoint window for senkou_b, the slower cloud boundary. Larger values anchor the cloud to more history, making it thicker and harder to cross.
displacement- Default 26. How far the spans are plotted forward and chikou backward. Changing it shifts where the cloud sits relative to price - most traders leave it matched to the kijun period.
Limitations and common mistakes
- The chart is visually busy - six overlapping elements overwhelm beginners, and cherry-picking one element loses the system's checks and balances.
- All lines are midpoints of past ranges, so signals lag; the "forward" cloud is displaced old data, not a forecast.
- In ranging markets price oscillates through the cloud and the signals contradict each other constantly.
- The traditional 9/26/52 settings come from a 6-day Japanese trading week; they are conventions, and re-tuning them changes every component at once.
References
- Origin: Goichi Hosoda, 1969.
- Ichimoku Kinkō Hyō — Wikipedia (opens in a new tab)
This page explains how an indicator is calculated and read. It describes past data, not what price will do next, and it is not a recommendation to trade. Read the disclaimers.
Try it in Analess
Add Ichimoku to any chart, adjust its settings, and open this explainer from the indicator itself.