















Indicators · Trend
DMI
Directional Movement Index — separates upward and downward movement to show which side is in control.
Origin: J. Welles Wilder, 1978
- Best suited to
- Trending markets
- Responsiveness
- Lagging
- Family
- Trend
What it is
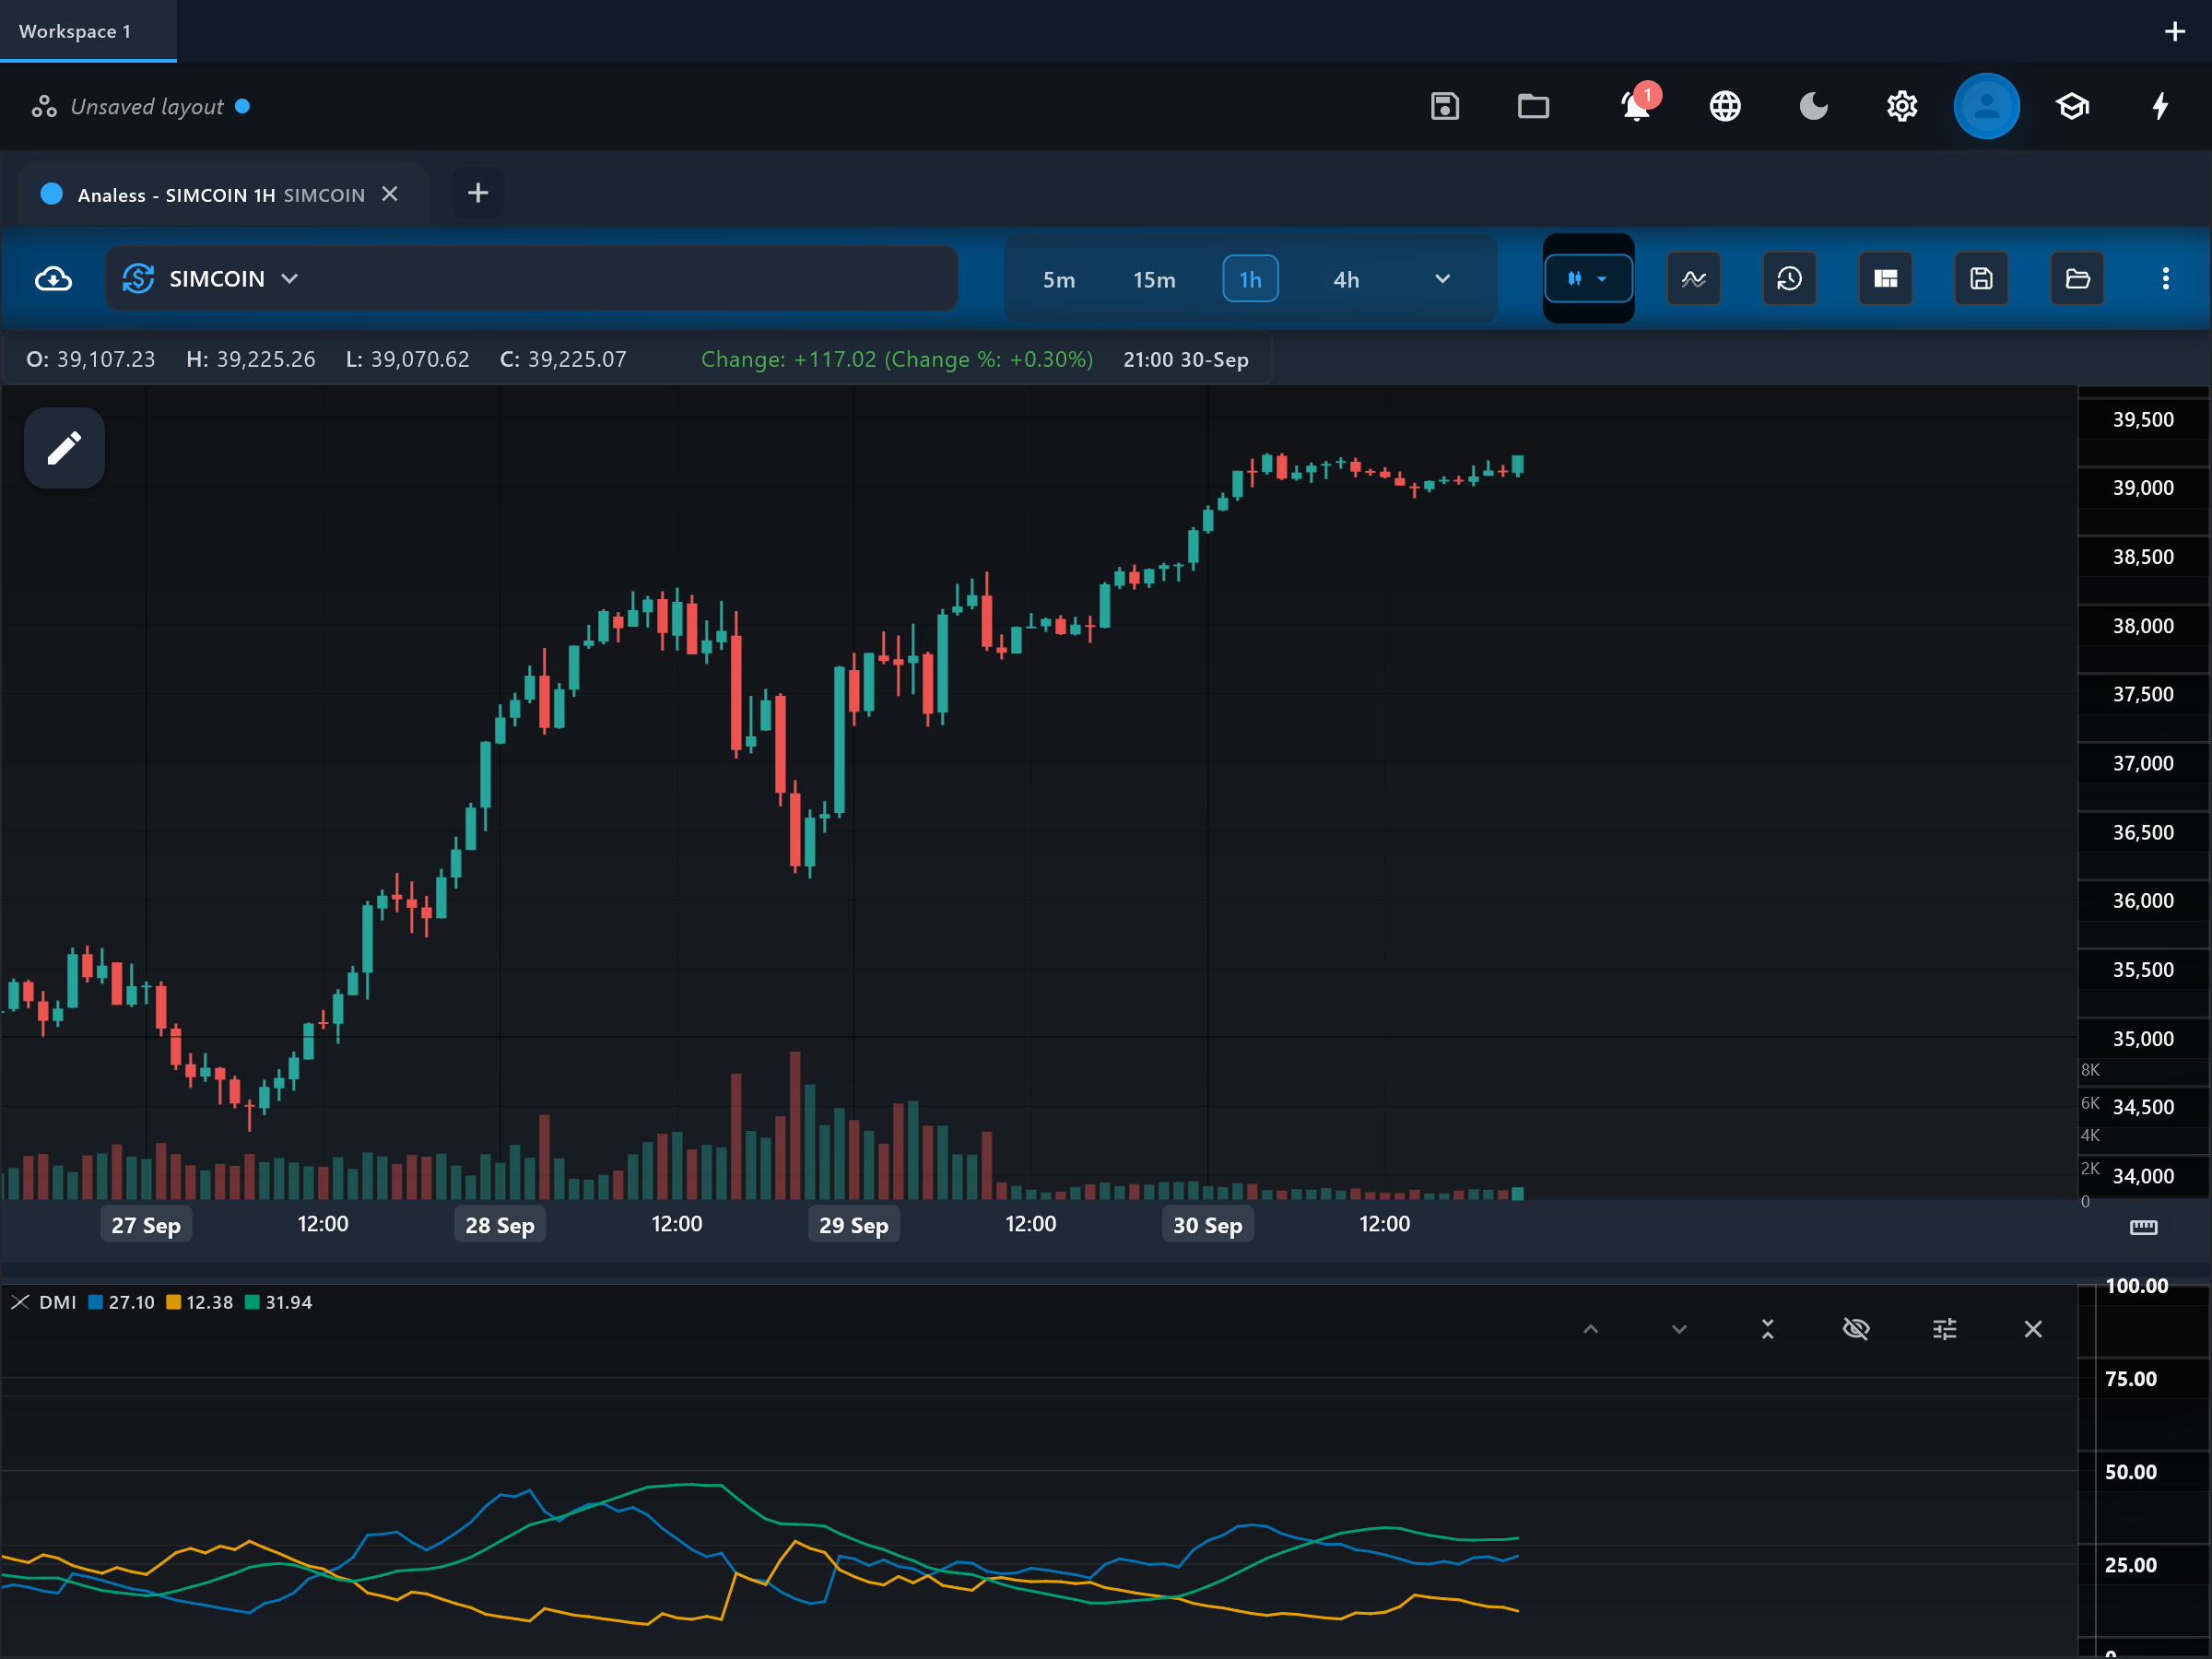
The Directional Movement Index (DMI) is Wilder's complete directional system: two direction lines (+DI and -DI) that show which side is winning, plus the ADX line that shows how decisively they are winning. It is the full instrument panel from which ADX alone is a single dial.
How it is calculated
Each bar contributes directional movement only to the side that expanded the range more: +DM when the high pushes up further than the low pushes down, -DM in the opposite case. Both are Wilder-smoothed over the period and normalized by ATR to give plus_di and minus_di as percentages of true range. Their normalized spread (DX) is then Wilder-smoothed again over the ADX smoothing length to give adx.
How to read it
Three lines share the pane: plus_di, minus_di and adx, all on a 0-100 scale. Whichever DI line is on top identifies the dominant direction - plus_di on top means buying pressure is expanding the range upward. The gap between the DI lines shows how one-sided the market is, and adx summarizes that one-sidedness over time: above 25 the dominance is persistent (a trend), below 20 the lines are tangled and the market is drifting. Crosses of the DI lines are the raw signals; adx tells you whether those crosses happen in an environment where they tend to follow through.
What to look for
- Signal-line crossUpside
plus_di crossing above minus_di signals that upward range expansion has overtaken downward - Wilder's basic buy setup.
- Signal-line crossDownside
minus_di crossing above plus_di signals that downward range expansion dominates - the basic sell setup.
- Trend filterContext
adx above 25 validates DI crosses; below 20, crosses are usually range noise and best ignored.
- ConfirmationContext
adx turning up shortly AFTER a DI cross confirms the new direction is developing into a trend rather than a one-bar spike.
When to use it
DMI is at home on daily and 4-hour charts of trending instruments - commodities (its original habitat), forex majors, index futures and liquid crypto. It is most valuable when you need direction AND strength from one tool. Skip it on instruments that spend most of their time in tight ranges, and on very low timeframes where bar-to-bar range noise makes the DI lines cross constantly.
Works well with
Settings explained
period- Default 14 (Wilder's original). Smoothing length for +DM, -DM and the ATR normalizer. Shorter periods produce earlier but noisier DI crosses; longer periods produce fewer, more reliable ones.
adxSmoothing- Default 14. The second smoothing pass that turns DX into the adx line. Lower values make the strength gauge more responsive; higher values make it a slower, steadier regime filter.
Limitations and common mistakes
- The double smoothing means every reading describes what the market HAS been doing - signals arrive after a move is underway.
- DI crossovers generate frequent false signals in sideways markets; the system was designed to be filtered by adx, not traded raw.
- Like ADX alone, the adx line carries no direction - beginners sometimes read a rising adx in a downtrend as bullish.
- Sharp gaps and thin liquidity inflate true range and can mute the DI lines just when the move is most dramatic.
References
- Origin: J. Welles Wilder, 1978.
- Average directional movement index — Wikipedia (opens in a new tab)
This page explains how an indicator is calculated and read. It describes past data, not what price will do next, and it is not a recommendation to trade. Read the disclaimers.
Try it in Analess
Add DMI to any chart, adjust its settings, and open this explainer from the indicator itself.