















Indicators · Trend
Super Trend
An ATR-based line that tracks the trend and flips when price crosses it.
Origin: Olivier Seban
- Best suited to
- Trending markets
- Responsiveness
- Lagging
- Family
- Trend
What it is
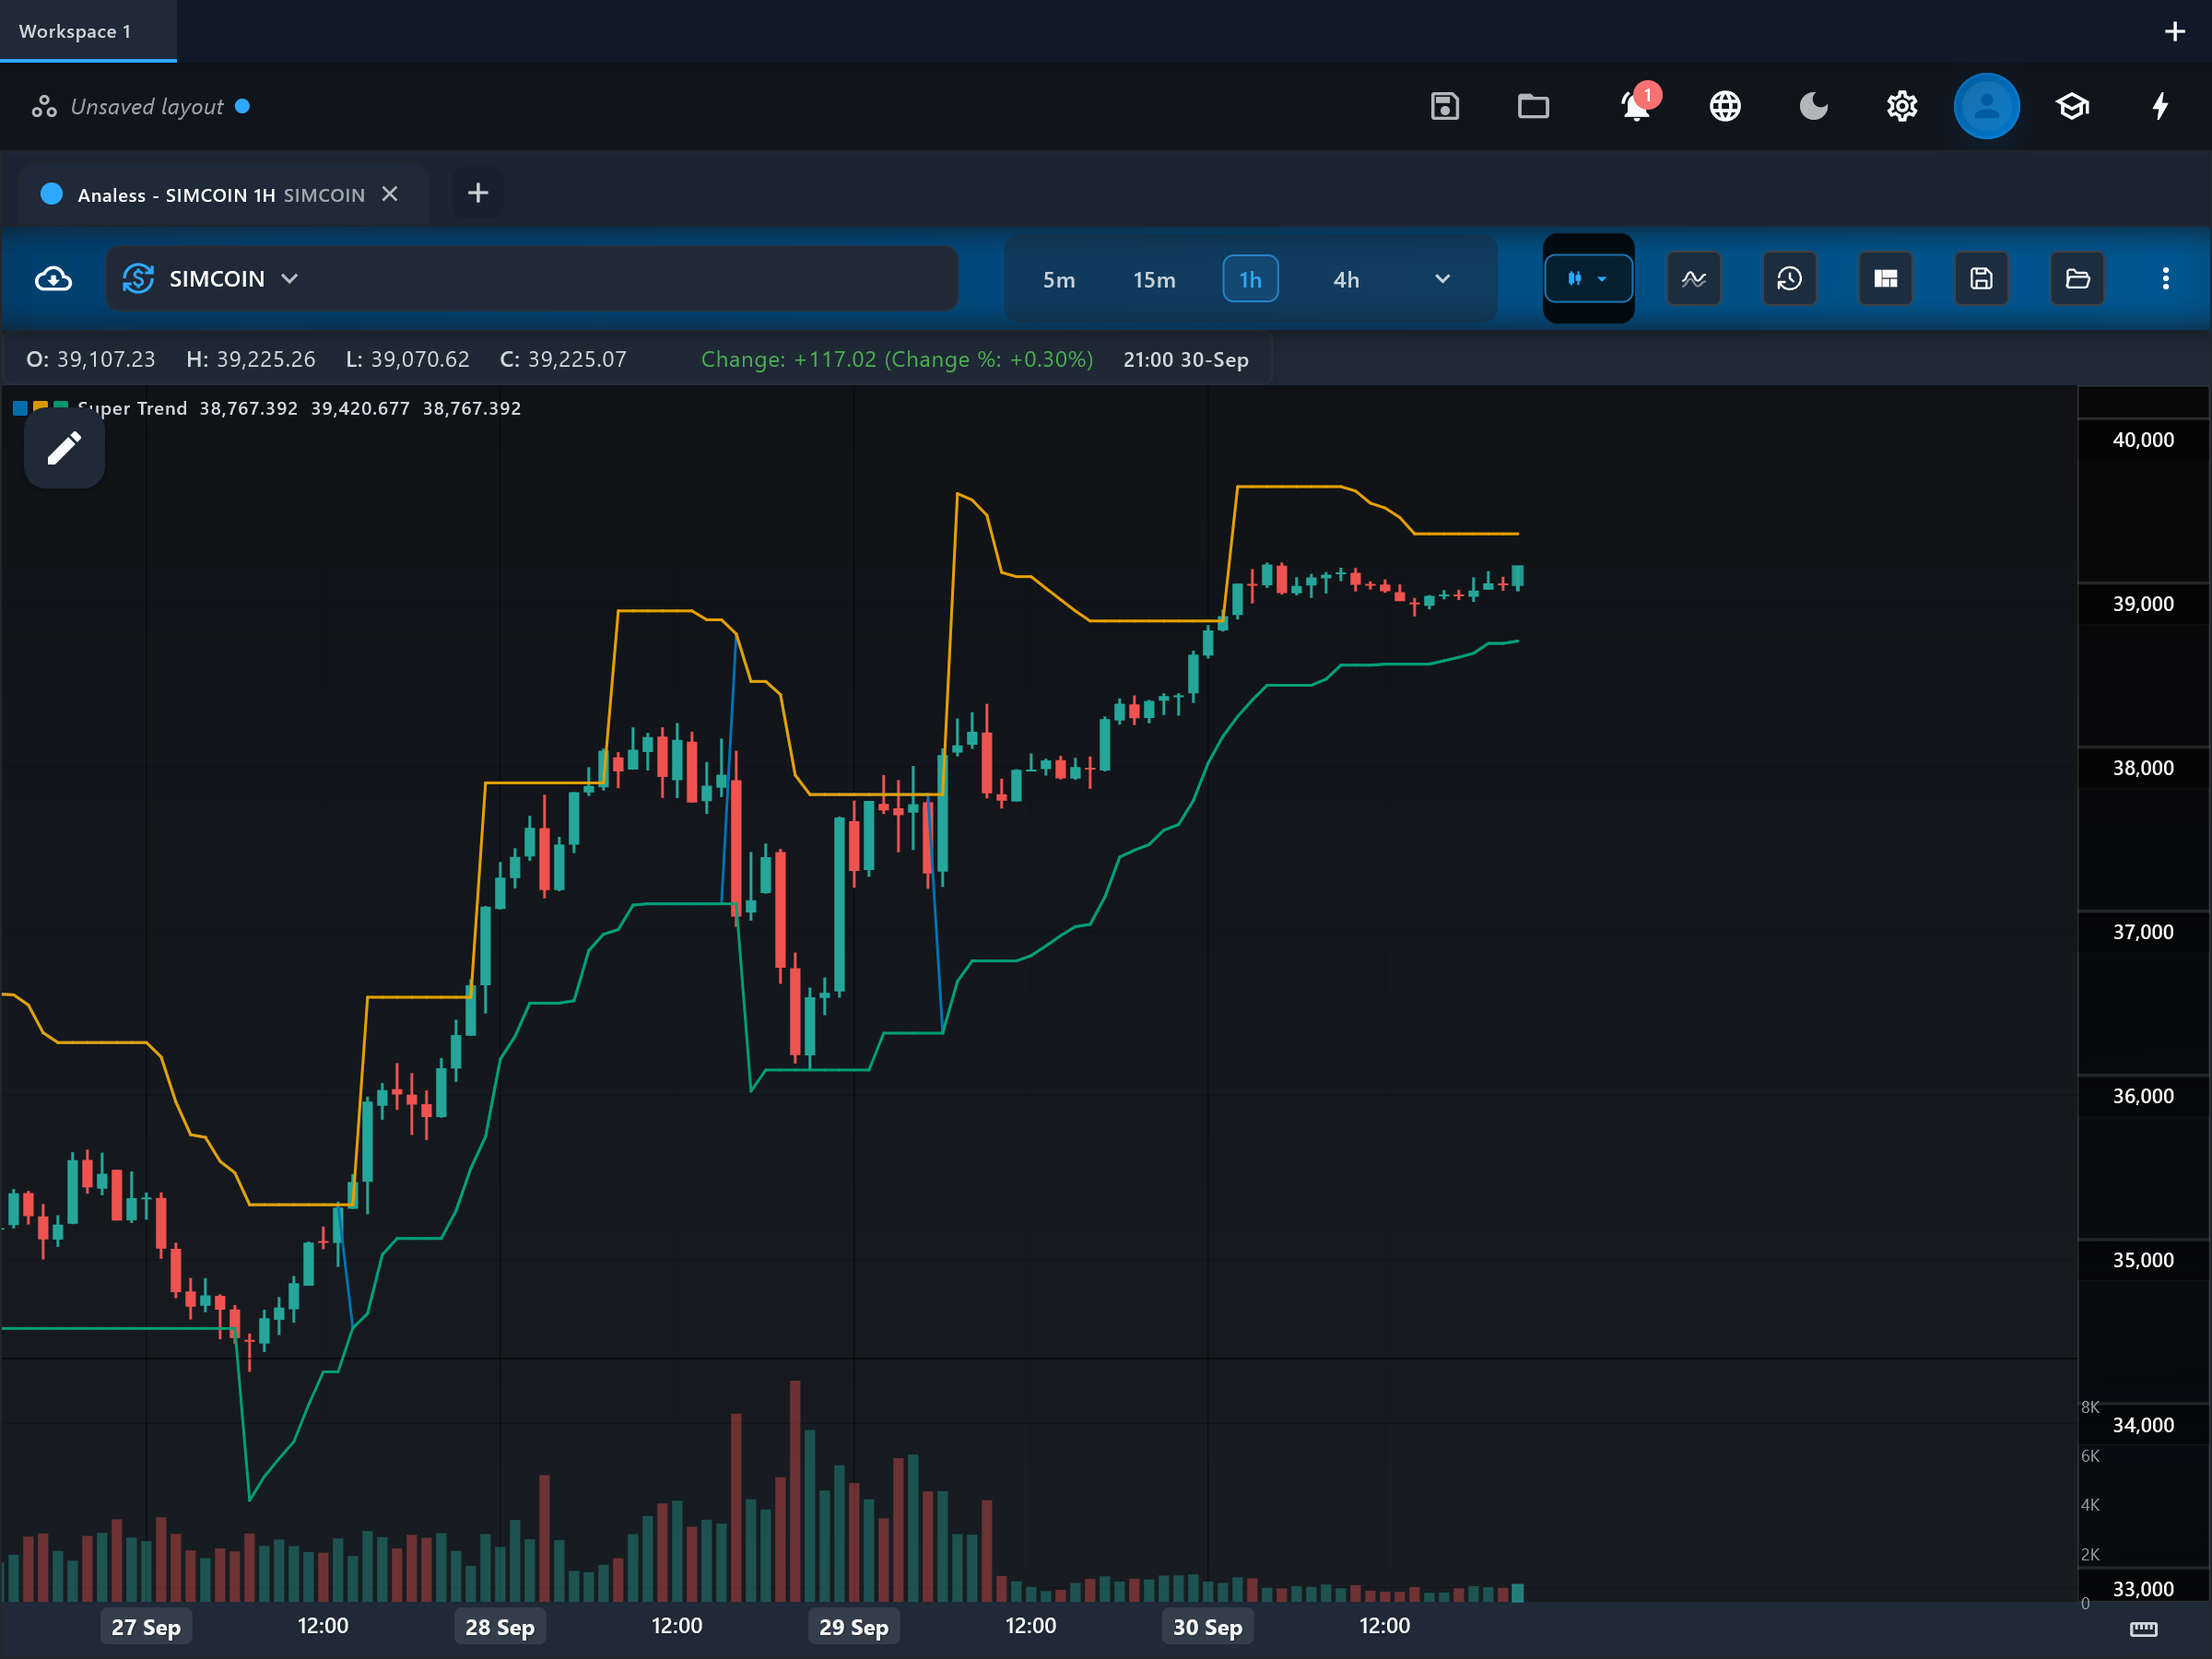
Super Trend is a volatility-based trailing stop drawn directly on the price chart. It plots one line that sits below price in uptrends and above price in downtrends, flipping sides when price closes through it.
How it is calculated
Two provisional bands are built from the bar midpoint plus/minus a multiple of ATR (Wilder-smoothed true range). The bands ratchet: in an uptrend the lower band may only rise, never fall, so the stop trails price without giving ground; the mirror rule applies to the upper band in downtrends. The active band becomes the super_trend line, and a close beyond it switches the regime to the other band.
How to read it
The main output is the super_trend line on the price chart, with upper_band and lower_band available as the raw ATR envelope. When the line runs below the candles the regime is bullish and the line marks a dynamic support / trailing-stop level; when it runs above the candles the regime is bearish and it acts as resistance. The flip - price closing through the line so it jumps to the other side - is the signal event. Distance between price and the line reflects how much ATR cushion the current trend has.
What to look for
- Price crossUpside
Price closing above the super_trend line flips it below price - the regime turns bullish and the line becomes the trailing support.
- Price crossDownside
Price closing below the super_trend line flips it above price - the regime turns bearish.
- ConfirmationContext
Pullbacks that touch but do not close through the line and then resume are trend-continuation behavior; the line held as support or resistance.
- Trend filterContext
Rapid alternation of flips in a narrow price band flags a ranging market where Super Trend signals should be stood down.
When to use it
Super Trend is popular on intraday and swing charts of liquid, directional markets - index futures, forex majors and crypto - because the ATR basis adapts the stop distance to each instrument's volatility automatically. It is a natural trailing stop for trend-following entries and a clean visual regime filter. Avoid it in low-volatility consolidations, where the bands compress and price saws through the line repeatedly.
Works well with
Settings explained
period- Default 10. The ATR lookback. Shorter periods make the bands react quickly to volatility changes (tighter, jumpier stop); longer periods give a steadier band that tolerates more noise.
multiplier- Default 3.0. How many ATRs the band sits from the bar midpoint. Lower multipliers (1.5-2) flip earlier and suit fast intraday trading; higher multipliers (3-4) hold through deeper pullbacks and suit swing positions.
Limitations and common mistakes
- Like all stop-and-flip tools it whipsaws in ranges - a narrow market produces alternating false flips.
- The line only moves one way within a regime, so after a volatility spike the stop can be left far from price, giving back a lot before flipping.
- Flips confirm on closes, so a sharp intrabar reversal is signaled only after the bar completes.
References
- Origin: Olivier Seban.
This page explains how an indicator is calculated and read. It describes past data, not what price will do next, and it is not a recommendation to trade. Read the disclaimers.
Try it in Analess
Add Super Trend to any chart, adjust its settings, and open this explainer from the indicator itself.