















Indicators · Trend
Parabolic SAR
Trailing dots that follow price and flip to the other side when the trend reverses.
Origin: J. Welles Wilder, 1978
- Best suited to
- Trending markets
- Responsiveness
- Lagging
- Family
- Trend
What it is
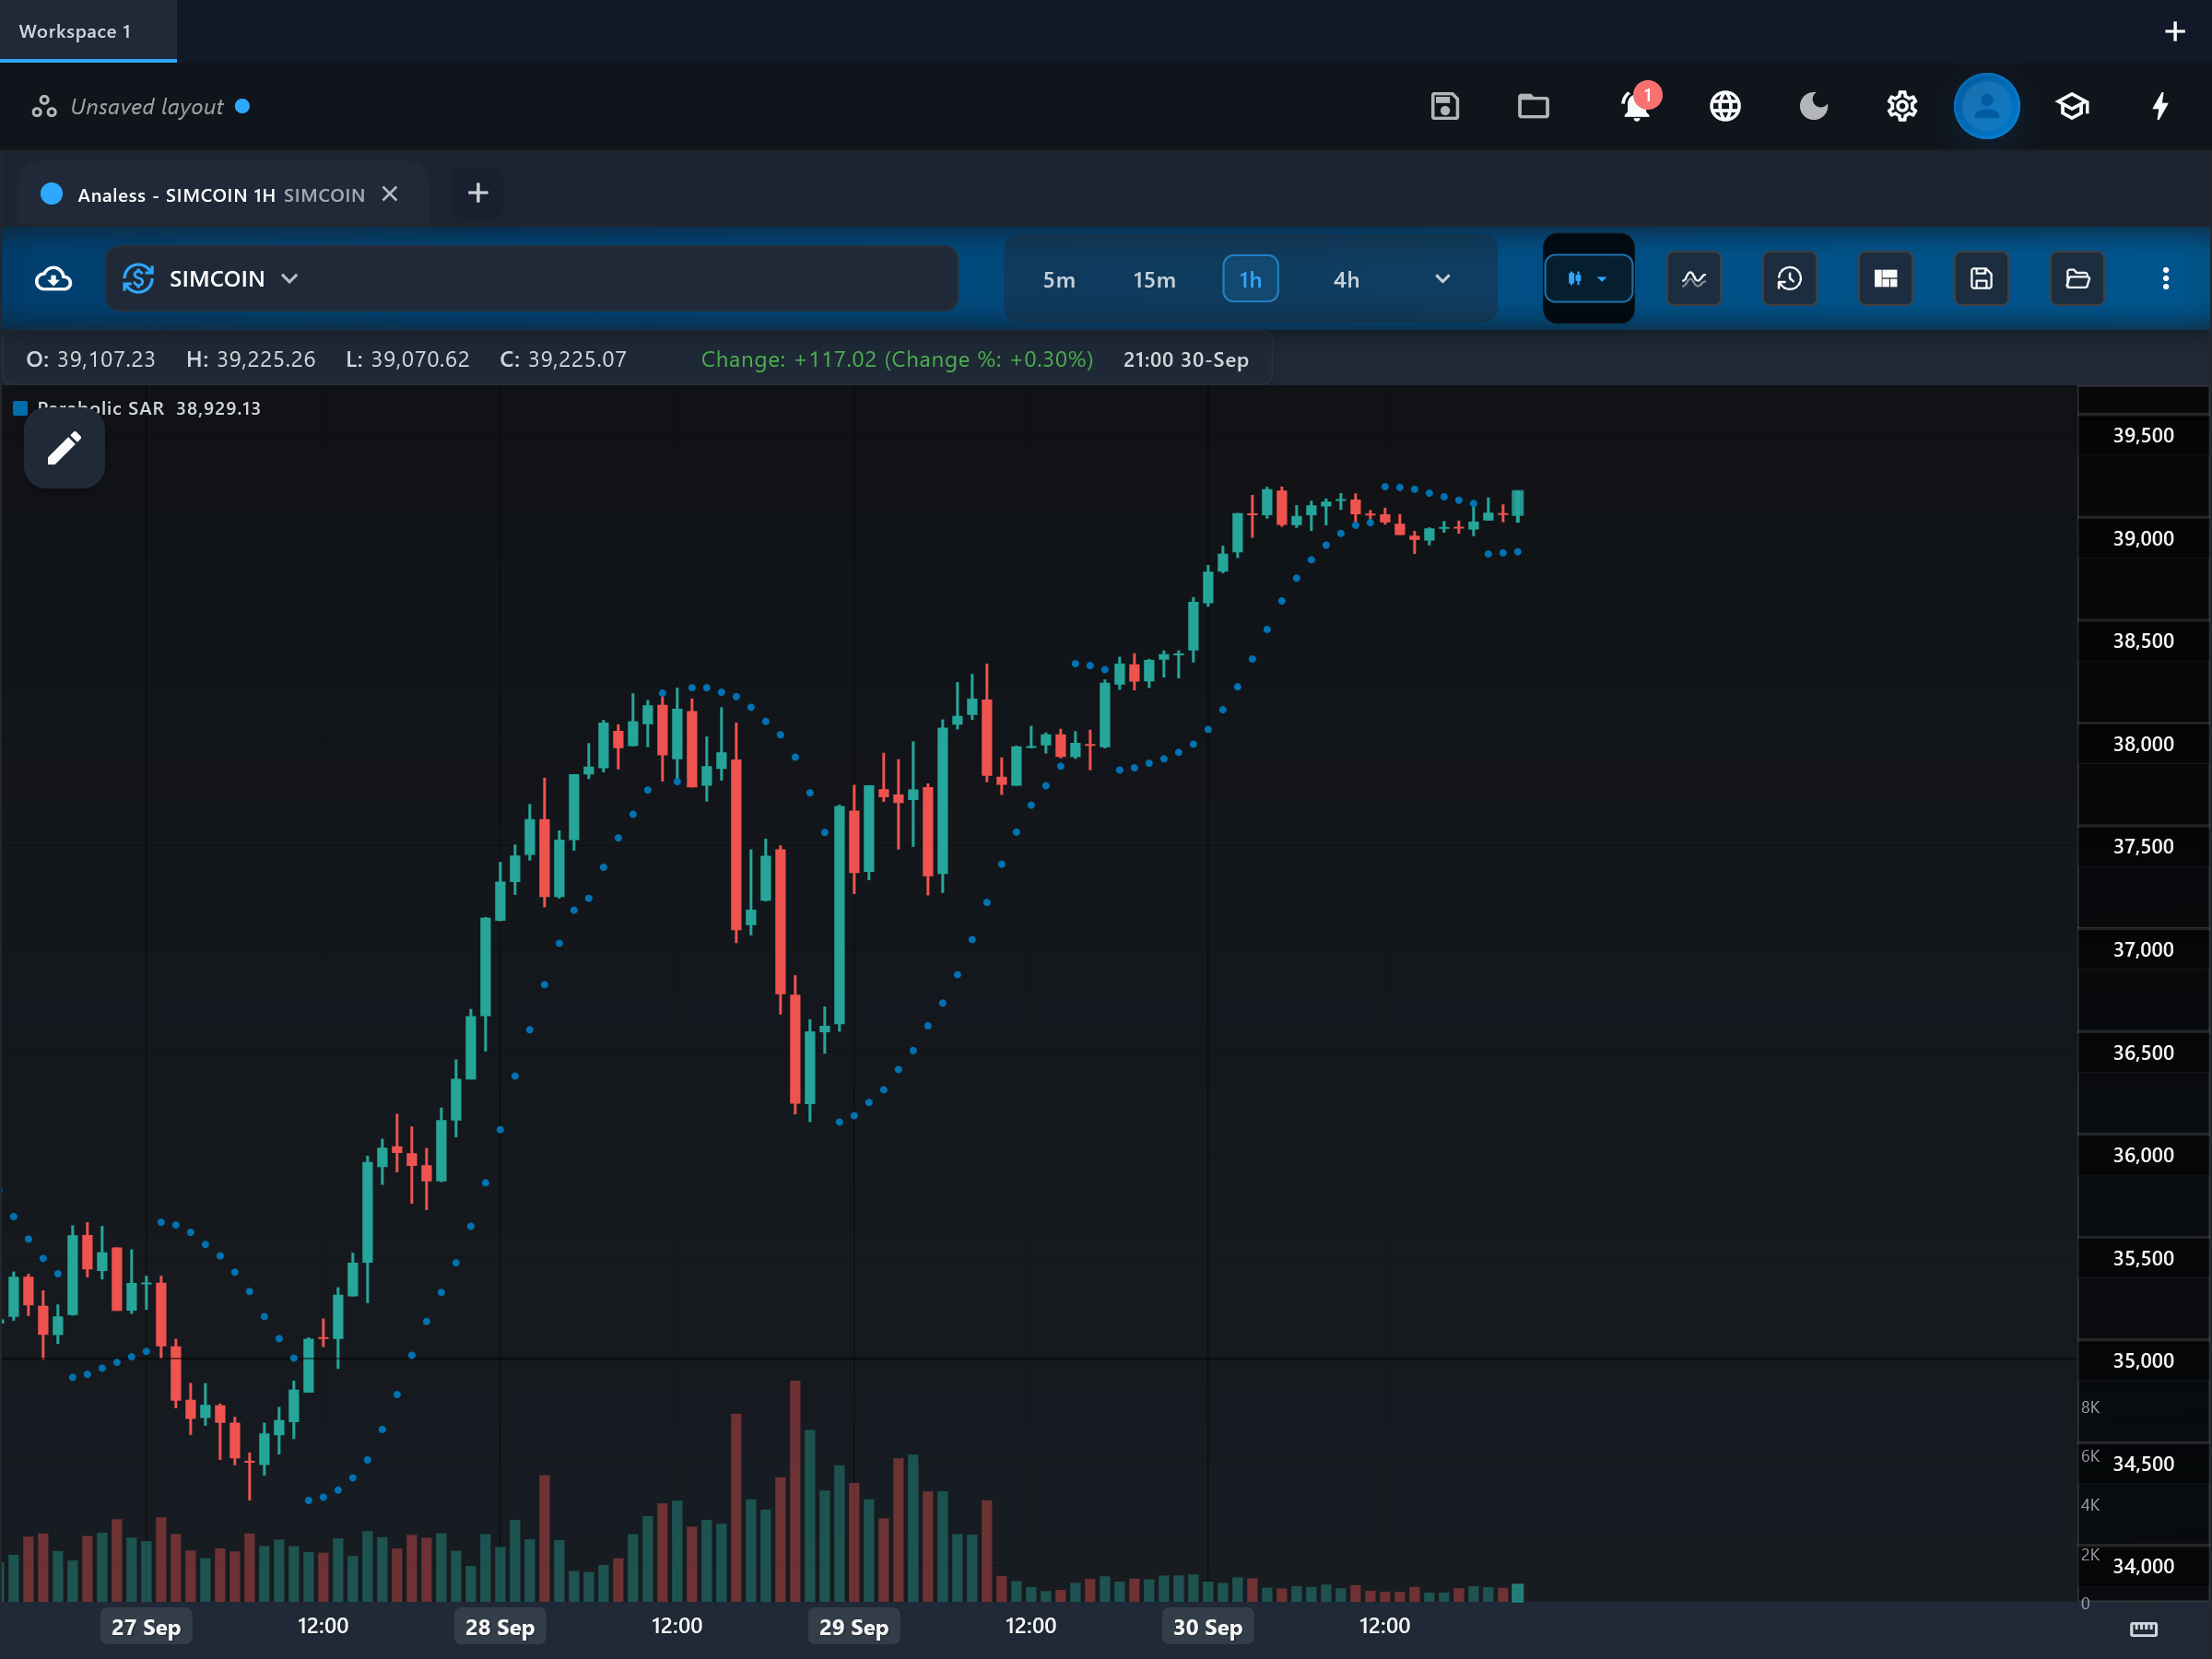
Parabolic SAR ("stop and reverse") plots a trail of dots that follows a trend like a tightening stop: below price in uptrends, above price in downtrends. When price touches the dots, the system flips to the other side - hence stop AND reverse.
How it is calculated
Each bar, the SAR value moves toward the trend's extreme point (the highest high of the up-move, or lowest low of the down-move) by a fraction called the acceleration factor. The factor starts small and increases every time a new extreme is made, up to a cap - so the dots trail loosely at first, then curve in parabolically as the trend matures. A close through the dots flips the SAR to the opposite side and resets the acceleration.
How to read it
The indicator draws a single dotted series, sar, directly on the price chart. Dots below the candles mean the system is in a long stance and each dot is the trailing stop level for that bar; dots above the candles mean a short stance. The flip - the first dot printing on the opposite side of price - is the signal event. Dots accelerating toward price show a maturing trend whose stop is tightening; dots far from price show a young or gentle trend with room to breathe.
What to look for
- Price crossUpside
sar dots flipping from above to below price signal a switch to an up-stance - the classic PSAR buy flip.
- Price crossDownside
sar dots flipping from below to above price signal a switch to a down-stance.
- ConfirmationContext
Using the current dot as a trailing-stop level is the indicator's original purpose - many traders use PSAR only for exits, not entries.
- Trend filterContext
Dots curving in rapidly toward price show the stop tightening as the trend matures; a flip far from the recent extreme comes earlier in a move than one close to it.
When to use it
PSAR is built for markets that trend cleanly - commodities, forex majors on 4-hour/daily charts, and strong momentum phases in stocks or crypto. Wilder designed it explicitly for trending conditions and recommended first establishing that a trend exists (e.g. with ADX). Do NOT use it in sideways markets: the always-in-the-market flip logic reverses on every wiggle and bleeds losses in chop.
Works well with
Settings explained
afStart- Default 0.02 (Wilder's original). The initial acceleration factor when a new trend begins. Raising it makes the dots hug price sooner after a flip; lowering it gives new trends more initial breathing room.
afIncrement- Default 0.02. How much the acceleration factor grows each time the trend makes a new extreme. Larger increments tighten the stop faster in strong trends (earlier exits); smaller ones let trends run with a looser trail.
afMax- Default 0.2. The cap on the acceleration factor. A lower cap prevents the dots from ever tracking price too tightly (fewer premature flips); a higher cap makes mature trends exit closer to their peak but flip more easily.
Limitations and common mistakes
- PSAR is always in the market - in ranges it flips relentlessly and is one of the worst-performing tools you can apply to chop.
- It assumes the trend continues until stopped; it gives no early warning of reversals, only a mechanical trailing exit.
- Flip signals lag at sharp reversals, and a single volatile bar can trigger a flip that immediately reverses.
References
- Origin: J. Welles Wilder, 1978.
- Parabolic SAR — Wikipedia (opens in a new tab)
This page explains how an indicator is calculated and read. It describes past data, not what price will do next, and it is not a recommendation to trade. Read the disclaimers.
Try it in Analess
Add Parabolic SAR to any chart, adjust its settings, and open this explainer from the indicator itself.