















Indicators · Trend
Aroon
Tracks how recently price set its highest high and lowest low to gauge trend strength and change.
Origin: Tushar Chande, 1995
- Best suited to
- Trending markets
- Responsiveness
- Lagging
- Family
- Trend
What it is
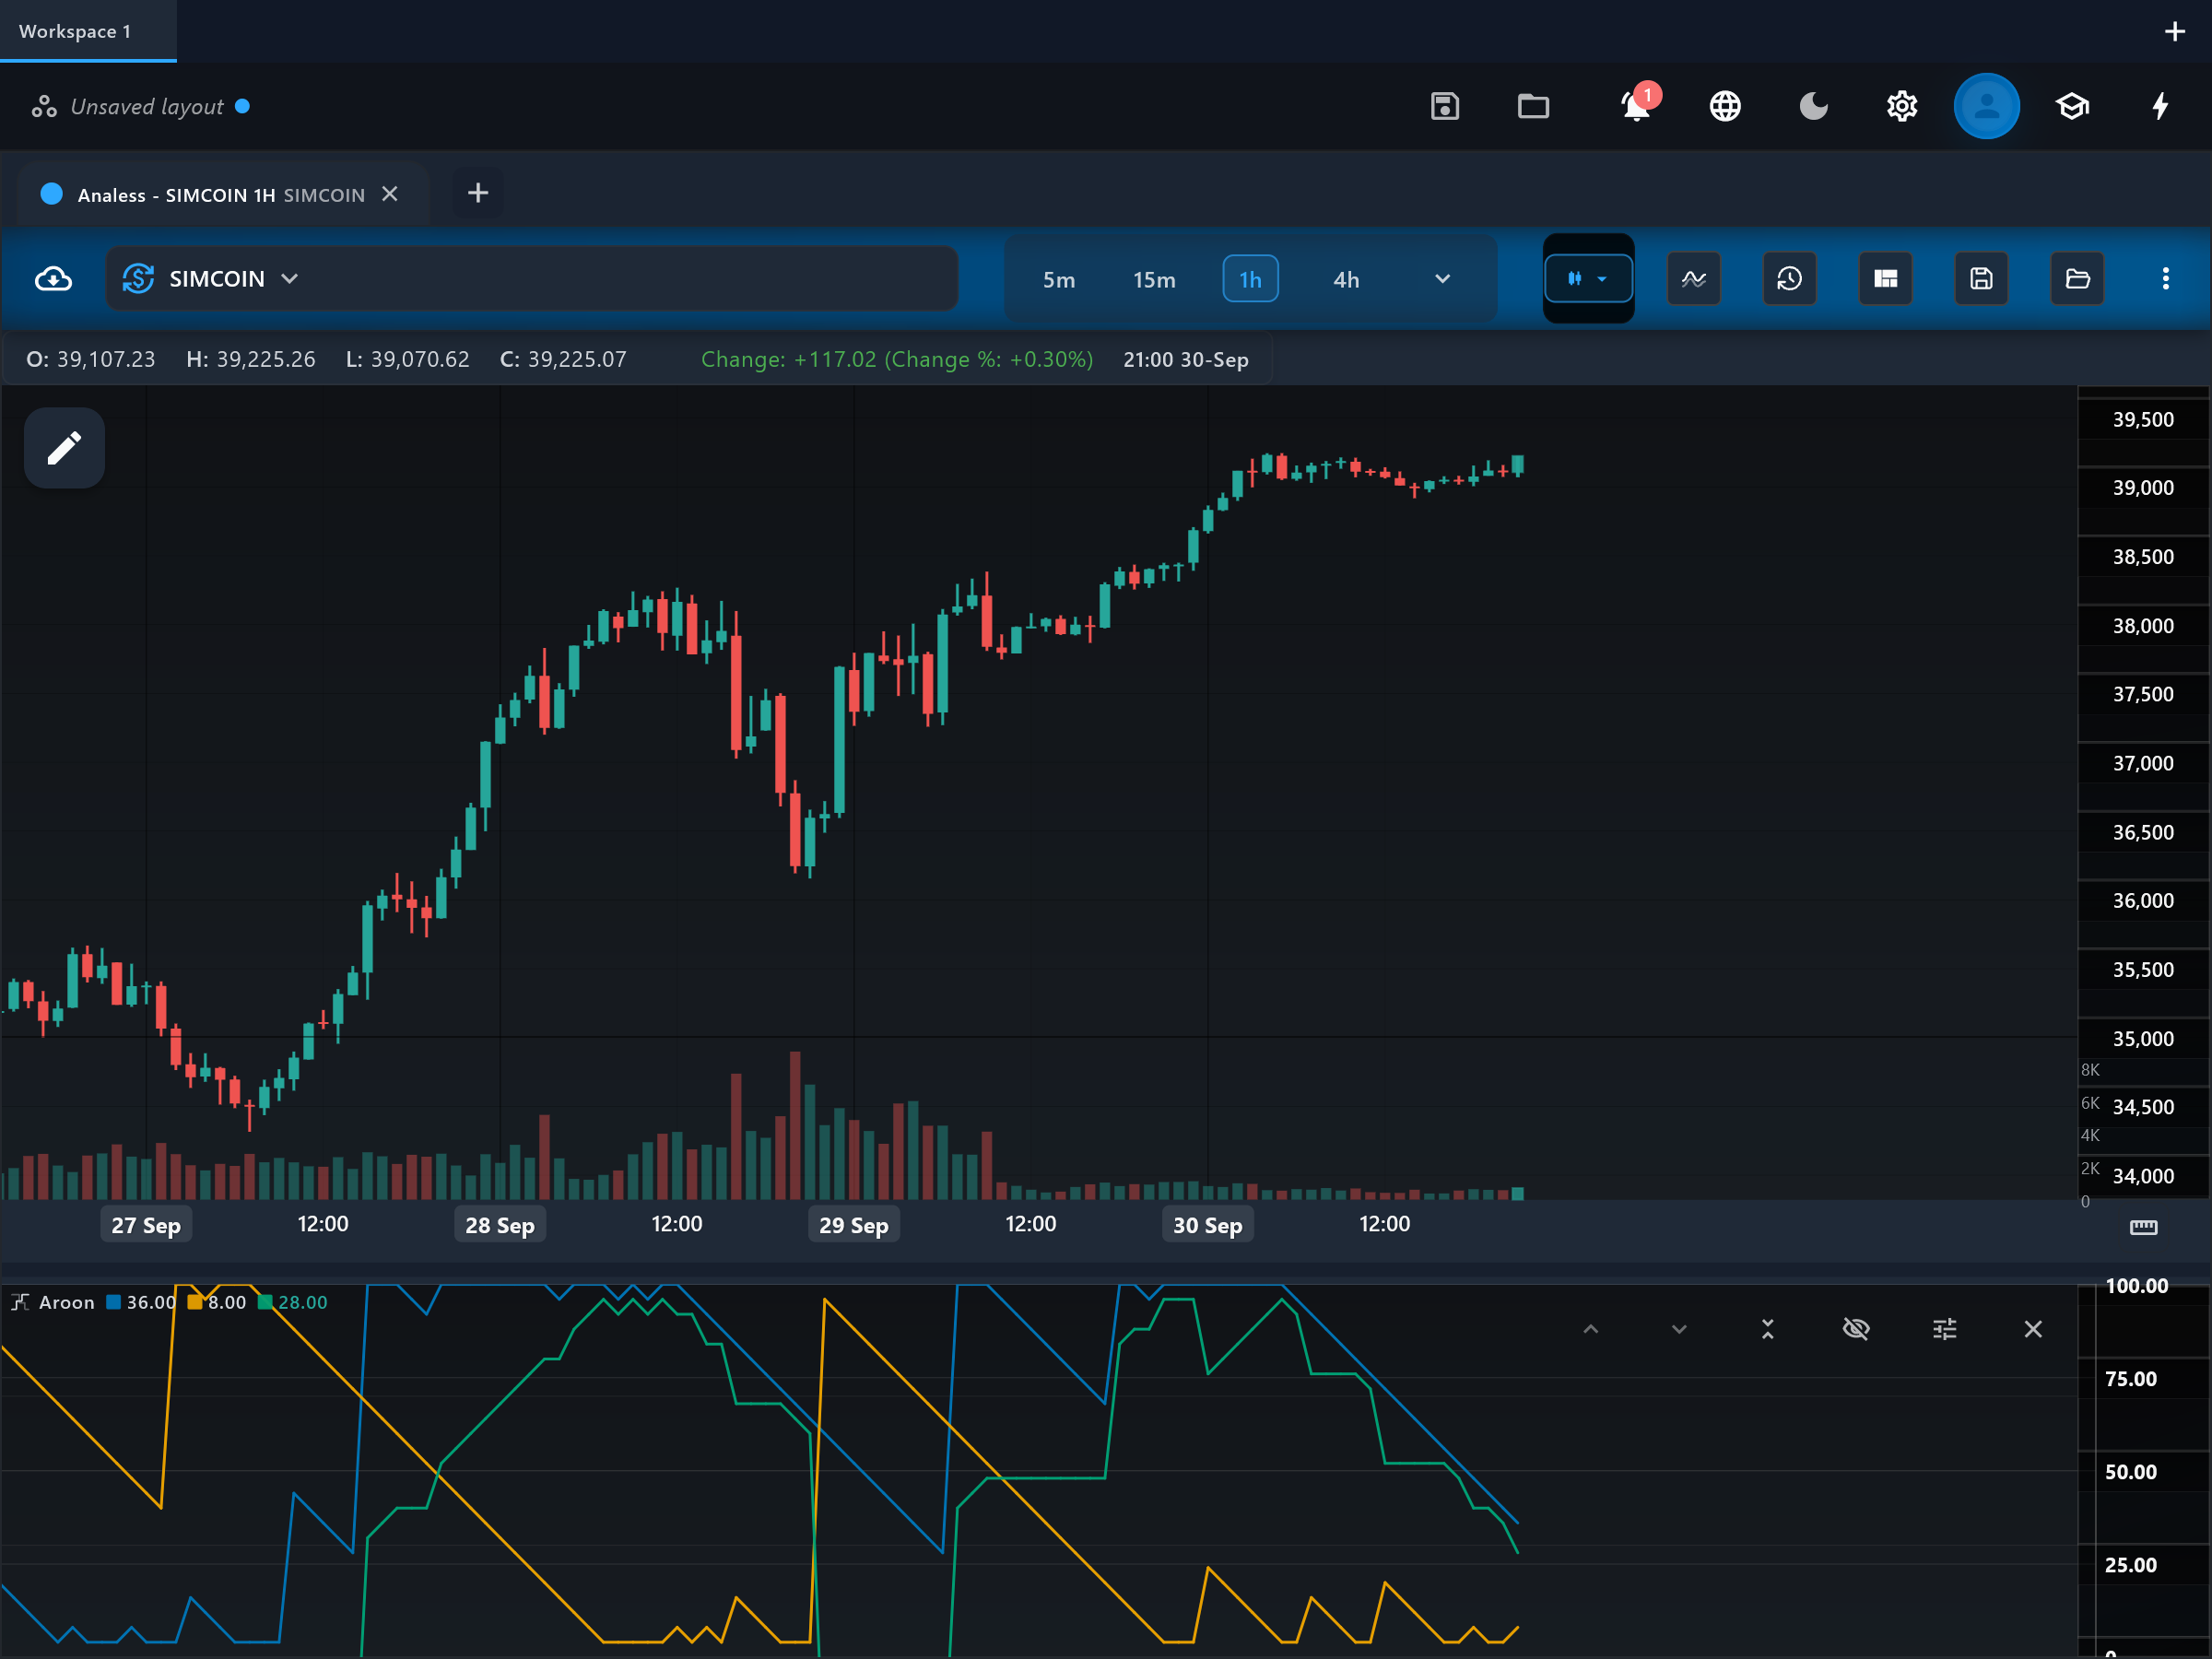
Aroon measures how recently price made its highest high and lowest low inside a lookback window, turning "freshness" of extremes into two 0-100 lines. The idea: in an uptrend new highs keep arriving, so the up line stays pinned near 100.
How it is calculated
Aroon Up counts how many bars have passed since the highest high of the last N bars and rescales that to 0-100 (a high on the current bar reads 100; a high N bars ago reads 0). Aroon Down does the same for the lowest low. The oscillator is simply Aroon Up minus Aroon Down, ranging from -100 to +100. No prices are averaged - only elapsed time since the extremes.
How to read it
The pane shows aroon_up and aroon_down on a 0-100 scale, plus aroon_oscillator in its own pane centered on zero. aroon_up near 100 with aroon_down near 0 signals a fresh, persistent uptrend; the mirror image signals a downtrend. Both lines meandering in the middle (roughly 30-70) means neither extreme is fresh - a consolidation. The oscillator condenses this: strongly positive favors the upside, strongly negative the downside, near zero means indecision.
What to look for
- Signal-line crossUpside
aroon_up crossing above aroon_down suggests recent highs are now fresher than recent lows - an early sign of upside control.
- Signal-line crossDownside
aroon_down crossing above aroon_up suggests sellers are setting the fresher extremes.
- Trend filterUpside
aroon_up holding above 70 while aroon_down stays below 30 characterizes an established uptrend.
- Trend filterDownside
aroon_down holding above 70 while aroon_up stays below 30 characterizes an established downtrend.
- Centre-line crossContext
aroon_oscillator crossing zero marks the handover between up-dominance and down-dominance; sustained readings beyond +50 or -50 mark strong one-sided trends.
When to use it
Aroon suits swing timeframes (4-hour to weekly) on instruments that form clean swing highs and lows - equities, index futures, major forex pairs. It is useful for spotting the START of a trend earlier than moving-average systems, because a single new extreme immediately pins a line to 100. Avoid it in choppy, news-driven markets where extremes alternate rapidly: both lines will whip between 0 and 100 with no follow-through.
Works well with
Settings explained
period- Default 25 (Chande's original). The lookback window for the highest high / lowest low. Shorter windows (e.g. 14) catch trend starts sooner but flip on minor swings; longer windows only register durable trends.
Limitations and common mistakes
- Aroon only measures TIME since extremes, not their size - a marginal one-tick high resets aroon_up to 100 just as a huge breakout does.
- In sideways markets both lines oscillate wildly and crossovers are mostly noise.
- A line pinned at 100 tells you the trend is fresh, not that it will continue - late in a move it can stay at 100 right up to the reversal.
References
- Origin: Tushar Chande, 1995.
This page explains how an indicator is calculated and read. It describes past data, not what price will do next, and it is not a recommendation to trade. Read the disclaimers.
Try it in Analess
Add Aroon to any chart, adjust its settings, and open this explainer from the indicator itself.