















Indicators · Momentum & oscillators
Accelerator Oscillator
Measures whether momentum itself is speeding up or slowing down.
Origin: Bill Williams, 1990s
- Best suited to
- Trending markets
- Responsiveness
- Leading
- Family
- Momentum & oscillators
What it is
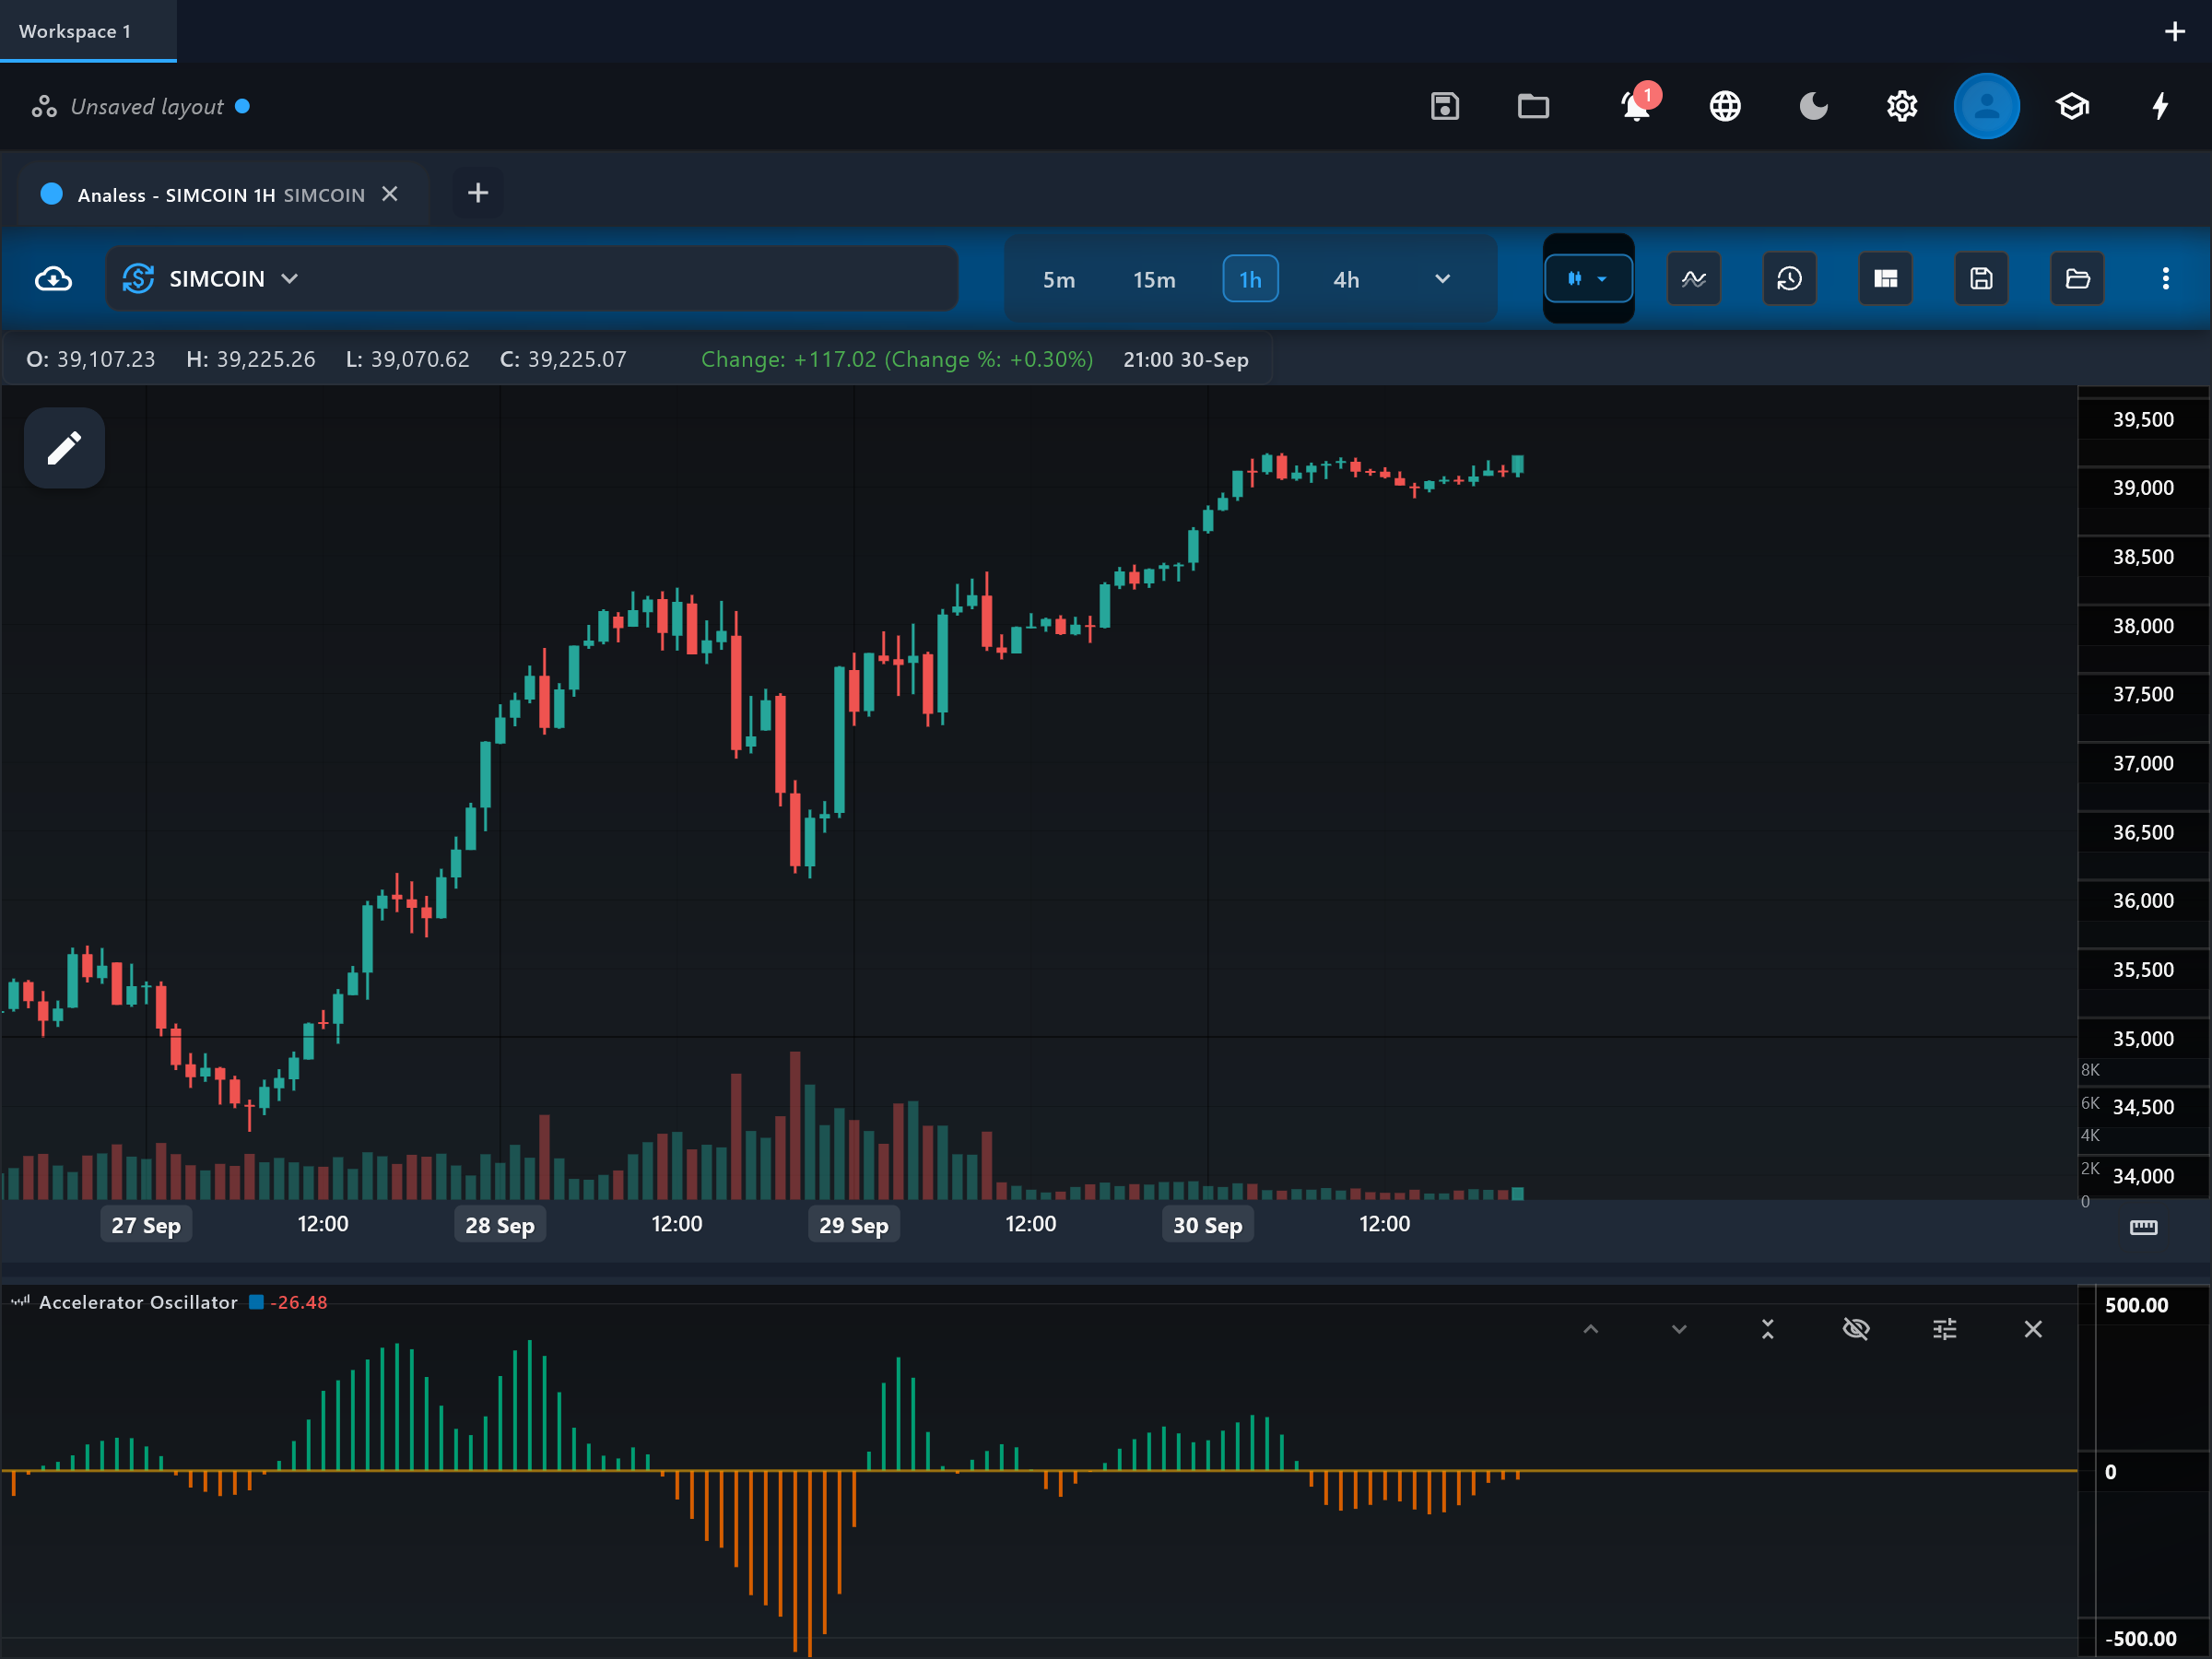
The Accelerator Oscillator (AC) measures the acceleration or deceleration of market momentum — the change in the driving force rather than the force itself. Bill Williams designed it as an early warning: in his framework, momentum changes direction before price, and acceleration changes direction before momentum. It is plotted as a histogram around a zero line.
How it is calculated
AC is the Awesome Oscillator minus a 5-period simple moving average of the Awesome Oscillator, where AO itself is the 5-period minus 34-period SMA of median price ((high + low) / 2). All of these periods (5, 34, and the 5-bar smoothing) are fixed by definition — the indicator has no adjustable parameters in this app, matching Williams' original formulation.
How to read it
The "ac" histogram shows whether momentum is speeding up or slowing down relative to its own recent average, with the "zero" line as the neutral level. Bars above zero mean momentum is accelerating; bars below zero mean it is decelerating. Williams read AC through consecutive bar sequences: a run of rising bars is bullish acceleration, a run of falling bars is bearish deceleration, and which side of zero you are on decides how many confirming bars he required. Because AC reacts a step earlier than AO, it also flips earlier — and more often.
What to look for
- ConfirmationUpside
Above zero, two consecutive rising "ac" bars signal bullish acceleration; below zero, Williams required three rising bars before treating it as a buy-side signal.
- ConfirmationDownside
Below zero, two consecutive falling "ac" bars signal bearish deceleration turning into downside acceleration; above zero, three falling bars are required.
- Turning patternContext
A shrinking histogram while price keeps trending warns that the move is losing acceleration and may stall or reverse.
- Centre-line crossContext
A zero-line cross marks the point where momentum flips from accelerating to decelerating (or back) — context, not a stand-alone entry, in Williams' method.
When to use it
AC suits the same markets as AO — liquid stocks, forex, crypto, and futures on intraday to daily timeframes — and is typically read alongside AO and the Alligator rather than alone. It is most useful when a trend exists and you want the earliest hint that its force is changing. Avoid it in quiet, ranging markets: as a difference of a difference it is one of the noisiest Williams tools, and near zero its bar flips are mostly noise.
Works well with
Limitations and common mistakes
- AC is deliberately fast and therefore noisy — single-bar color flips are frequent and mean little on their own.
- It is unbounded and instrument-relative, so bar heights cannot be compared across symbols or timeframes.
- It measures acceleration, not direction: AC can rise while price falls (downmove decelerating), which beginners often misread as a turn in price.
References
- Origin: Bill Williams, 1990s.
- Bill Williams (trader) — Wikipedia (opens in a new tab)
This page explains how an indicator is calculated and read. It describes past data, not what price will do next, and it is not a recommendation to trade. Read the disclaimers.
Try it in Analess
Add Accelerator Oscillator to any chart, adjust its settings, and open this explainer from the indicator itself.