















Indicators · Momentum & oscillators
CCI
Commodity Channel Index — measures how far price sits from its statistical average.
Origin: Donald Lambert, 1980
- Best suited to
- Any market condition
- Responsiveness
- Leading
- Family
- Momentum & oscillators
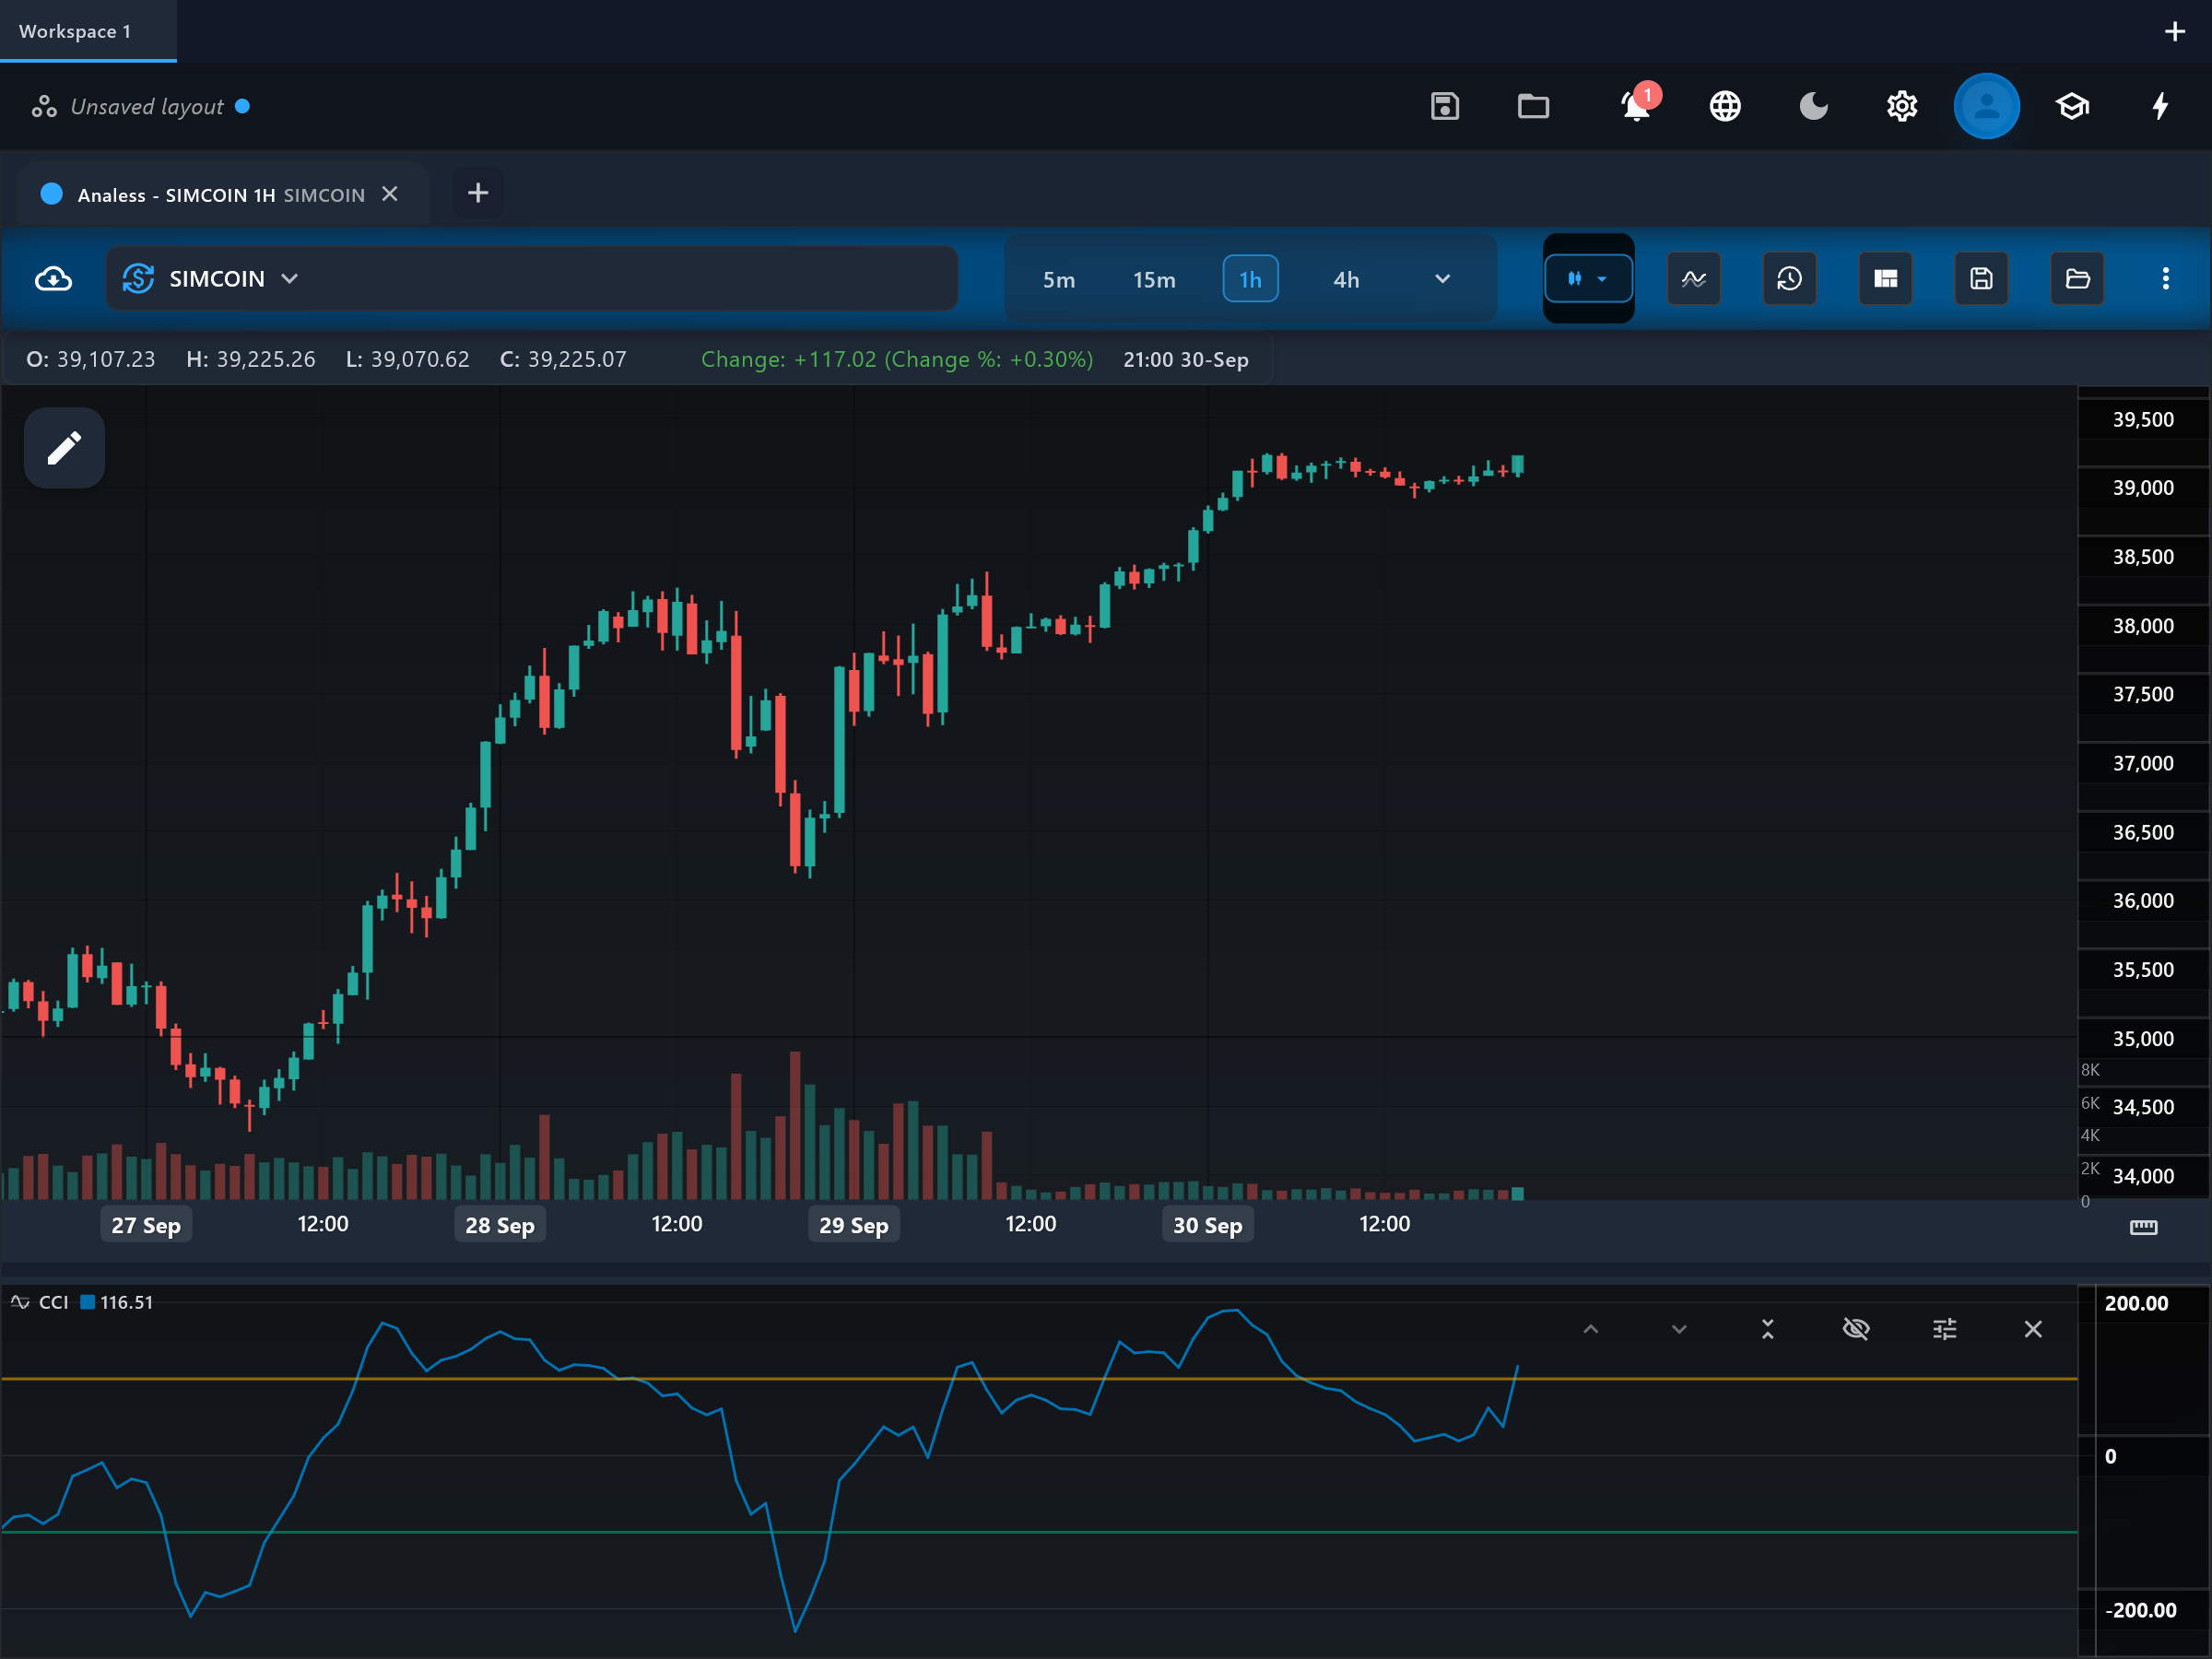
What it is
The Commodity Channel Index (CCI) measures how far the typical price has strayed from its own average, scaled by the average size of those deviations. Despite the name it works on any market, not just commodities. Most readings fall between -100 and +100, with moves beyond those levels marking unusual strength or weakness.
How it is calculated
CCI = (typical price - SMA of typical price) / (constant x mean deviation), where typical price is (high + low + close) / 3 and the constant defaults to 0.015. Lambert chose 0.015 so roughly 70-80 percent of values land inside the -100 to +100 band. The further price sits from its average, relative to normal deviation, the larger the reading.
How to read it
The pane shows the "cci" line with "overbought" (default +100) and "oversold" (default -100) guide lines. Readings inside the band are ordinary fluctuation; a push above +100 marks unusual upside strength and below -100 unusual downside weakness. Trend-followers treat a break above +100 as the start of strength and its return inside the band as the end; mean-reversion traders instead fade extreme readings back toward zero. The zero line marks price sitting exactly at its recent average.
What to look for
- Overbought / oversoldContext
Beyond +100 or -100 the deviation from the average price is unusually large — strength to trend-followers, an extreme to faders. Context decides which reading applies.
- Centre-line crossContext
A zero cross means the typical price has crossed its own moving average — a basic direction gauge.
- DivergenceContext
New price extremes without new CCI extremes signal the move is stretching on weakening deviation.
When to use it
CCI is popular on commodities, futures, and volatile crypto, and works on any timeframe with enough movement for the deviation math to be meaningful. In strong trends the oversold/overbought reading misleads just like other oscillators — CCI can hold above +100 for the length of a rally, and fading every extreme fights the move. Decide up front whether you are using it as a breakout tool or a mean-reversion tool; the two readings of the same level are opposite.
Works well with
Settings explained
period- Default 20 — the SMA and mean-deviation lookback. Shorter periods (10-14) reach the outer levels far more often; longer ones (30+) keep CCI inside the band except at genuine extremes.
constantFactor- Default 0.015 — Lambert's scaling constant that places roughly 70-80 percent of readings inside the -100/+100 band. Lowering it stretches readings outward (more extreme values); raising it compresses them. Rarely changed.
overboughtLevel- Default +100 — the upper guide level drawn on the pane. Tighten it for choppier markets, loosen it (e.g. +200) for strong trends where +100 breaks are routine.
oversoldLevel- Default -100 — the lower guide level drawn on the pane. Tighten it for choppier markets, loosen it (e.g. -200) for strong downtrends.
Limitations and common mistakes
- Unbounded: extreme values have no ceiling, so "overbought" is relative, not absolute.
- The same +100 break is read oppositely by breakout and mean-reversion styles — the indicator does not tell you which regime you are in.
- Short lookbacks generate constant zone crossings in choppy markets.
References
- Origin: Donald Lambert, 1980.
- Commodity channel index — Wikipedia (opens in a new tab)
This page explains how an indicator is calculated and read. It describes past data, not what price will do next, and it is not a recommendation to trade. Read the disclaimers.
Try it in Analess
Add CCI to any chart, adjust its settings, and open this explainer from the indicator itself.