















Indicators · Momentum & oscillators
Accumulative Swing Index
A running total of swing values that tracks longer-term price trend and structure.
Origin: J. Welles Wilder, 1978
- Best suited to
- Trending markets
- Responsiveness
- Coincident
- Family
- Momentum & oscillators
What it is
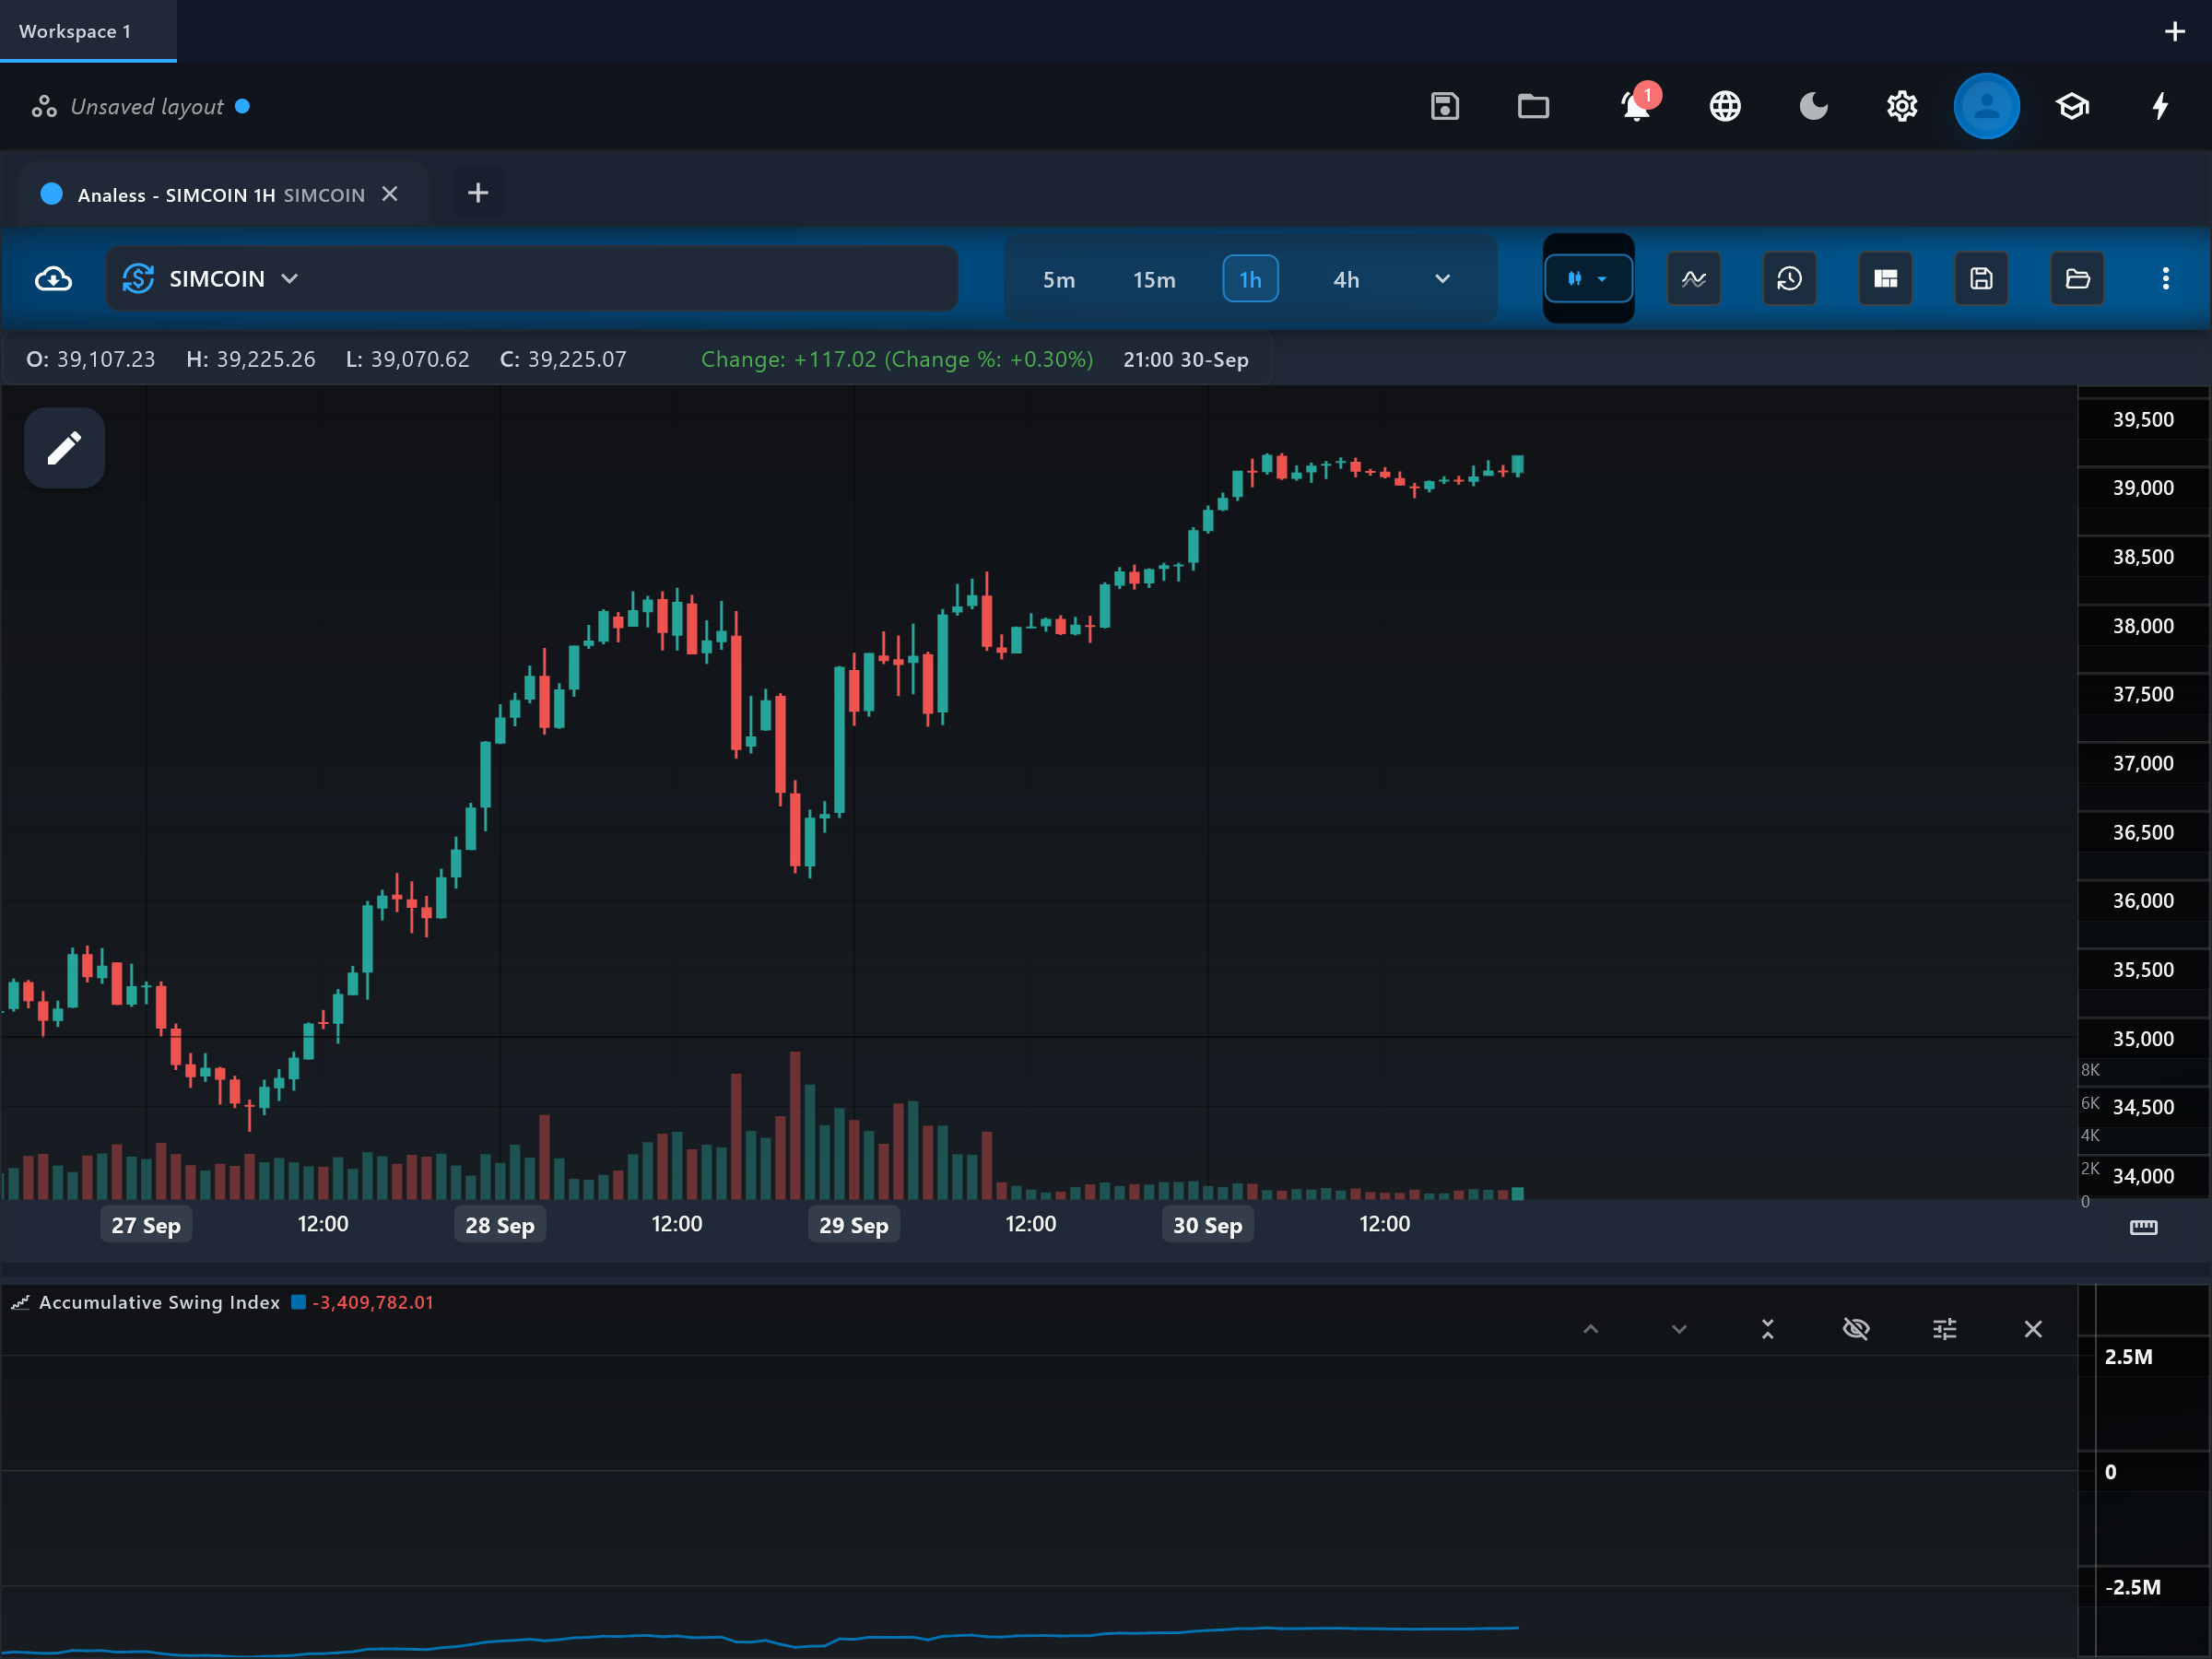
The Accumulative Swing Index (ASI) is a running total of Wilder's Swing Index — a per-bar score that distils each bar's open, high, low, and close (and the previous bar's) into a single number for the "real" swing strength of that bar. Accumulated over time, it forms a line that behaves like a cleaner shadow of price, designed so that trendlines and breakouts on the ASI can confirm or question the same features on the price chart.
How it is calculated
Each bar, the Swing Index compares the current and previous open/high/low/close through Wilder's formula, which weighs the close-to-close change, the gap versus the prior close, and the bar's own range, all scaled by a limit-move constant (Wilder wrote it for 1970s futures with daily price-move limits). The ASI plotted here is the cumulative sum of those per-bar Swing Index values.
How to read it
The single "asi" line rises when swing pressure is bullish and falls when bearish, mirroring price's swing structure with the noise of intra-bar wicks partly filtered. Wilder's intended use is comparative: draw the same trendlines, support/resistance, and swing points on the ASI as on price. A breakout that appears on both charts is considered genuine; a price breakout that the ASI does not echo is suspect. The absolute level of the line means little — its shape and its agreement with price are the message.
What to look for
- Range expansionUpside
The "asi" line breaks above its own trendline or a prior swing high in step with a price breakout — Wilder's confirmation that the upside break is real.
- Range expansionDownside
The ASI breaks below its trendline or a prior swing low alongside a downside price break.
- ConfirmationContext
Price breaks a level but the ASI does not break its matching level — a warning that the price move lacks swing support and may be a false breakout.
- DivergenceContext
Price sets a new high or low that the ASI fails to match, suggesting the swing pressure behind the trend is fading.
When to use it
ASI was created for daily futures charts and remains most natural on futures, commodities, and other gap-prone instruments where its gap-aware formula adds real information; it also serves on stocks and FX as a breakout-confirmation overlay. Use it when you trade trendline breaks and want a second, cleaner chart to confirm them. It has little to offer in flat ranges, and on markets without meaningful gaps or limit moves parts of its formula do less work.
Works well with
Settings explained
limitMove- Wilder's limit-move constant "T" — the maximum allowed price move used to scale each bar's Swing Index. On markets without exchange price limits it acts as a sensitivity scaler: a smaller value amplifies the line's swings, a larger one flattens them. The default 0.5 is a neutral starting point; the line's shape (not its scale) is what carries the signal.
Limitations and common mistakes
- The limit-move constant is an artifact of 1970s futures markets — on modern limit-free instruments its value is arbitrary and only affects scale.
- As a cumulative line it drifts with long trends; its absolute level is meaningless and only relative structure can be read.
- It requires you to do chartist work (trendlines, swing points) on the indicator itself — it produces no self-contained numeric signal.
References
- Origin: J. Welles Wilder, 1978.
- J. Welles Wilder Jr. — Wikipedia (opens in a new tab)
This page explains how an indicator is calculated and read. It describes past data, not what price will do next, and it is not a recommendation to trade. Read the disclaimers.
Try it in Analess
Add Accumulative Swing Index to any chart, adjust its settings, and open this explainer from the indicator itself.