















Indicators · Momentum & oscillators
CMO
Chande Momentum Oscillator — a pure measure of up-moves against down-moves.
Origin: Tushar Chande, 1994
- Best suited to
- Ranging markets
- Responsiveness
- Leading
- Family
- Momentum & oscillators
What it is
The Chande Momentum Oscillator (CMO) compares total gains to total losses over the lookback window and scales the result to a fixed -100 to +100 range. Unlike RSI it uses unsmoothed sums, which makes it snappier, and it is symmetric around zero rather than centered on 50.
How it is calculated
CMO = 100 x (sum of up-moves - sum of down-moves) / (sum of up-moves + sum of down-moves) over the period (default 9) on the chosen source. If every bar closed higher, CMO reads +100; if every bar closed lower, -100; equal buying and selling pressure gives 0.
How to read it
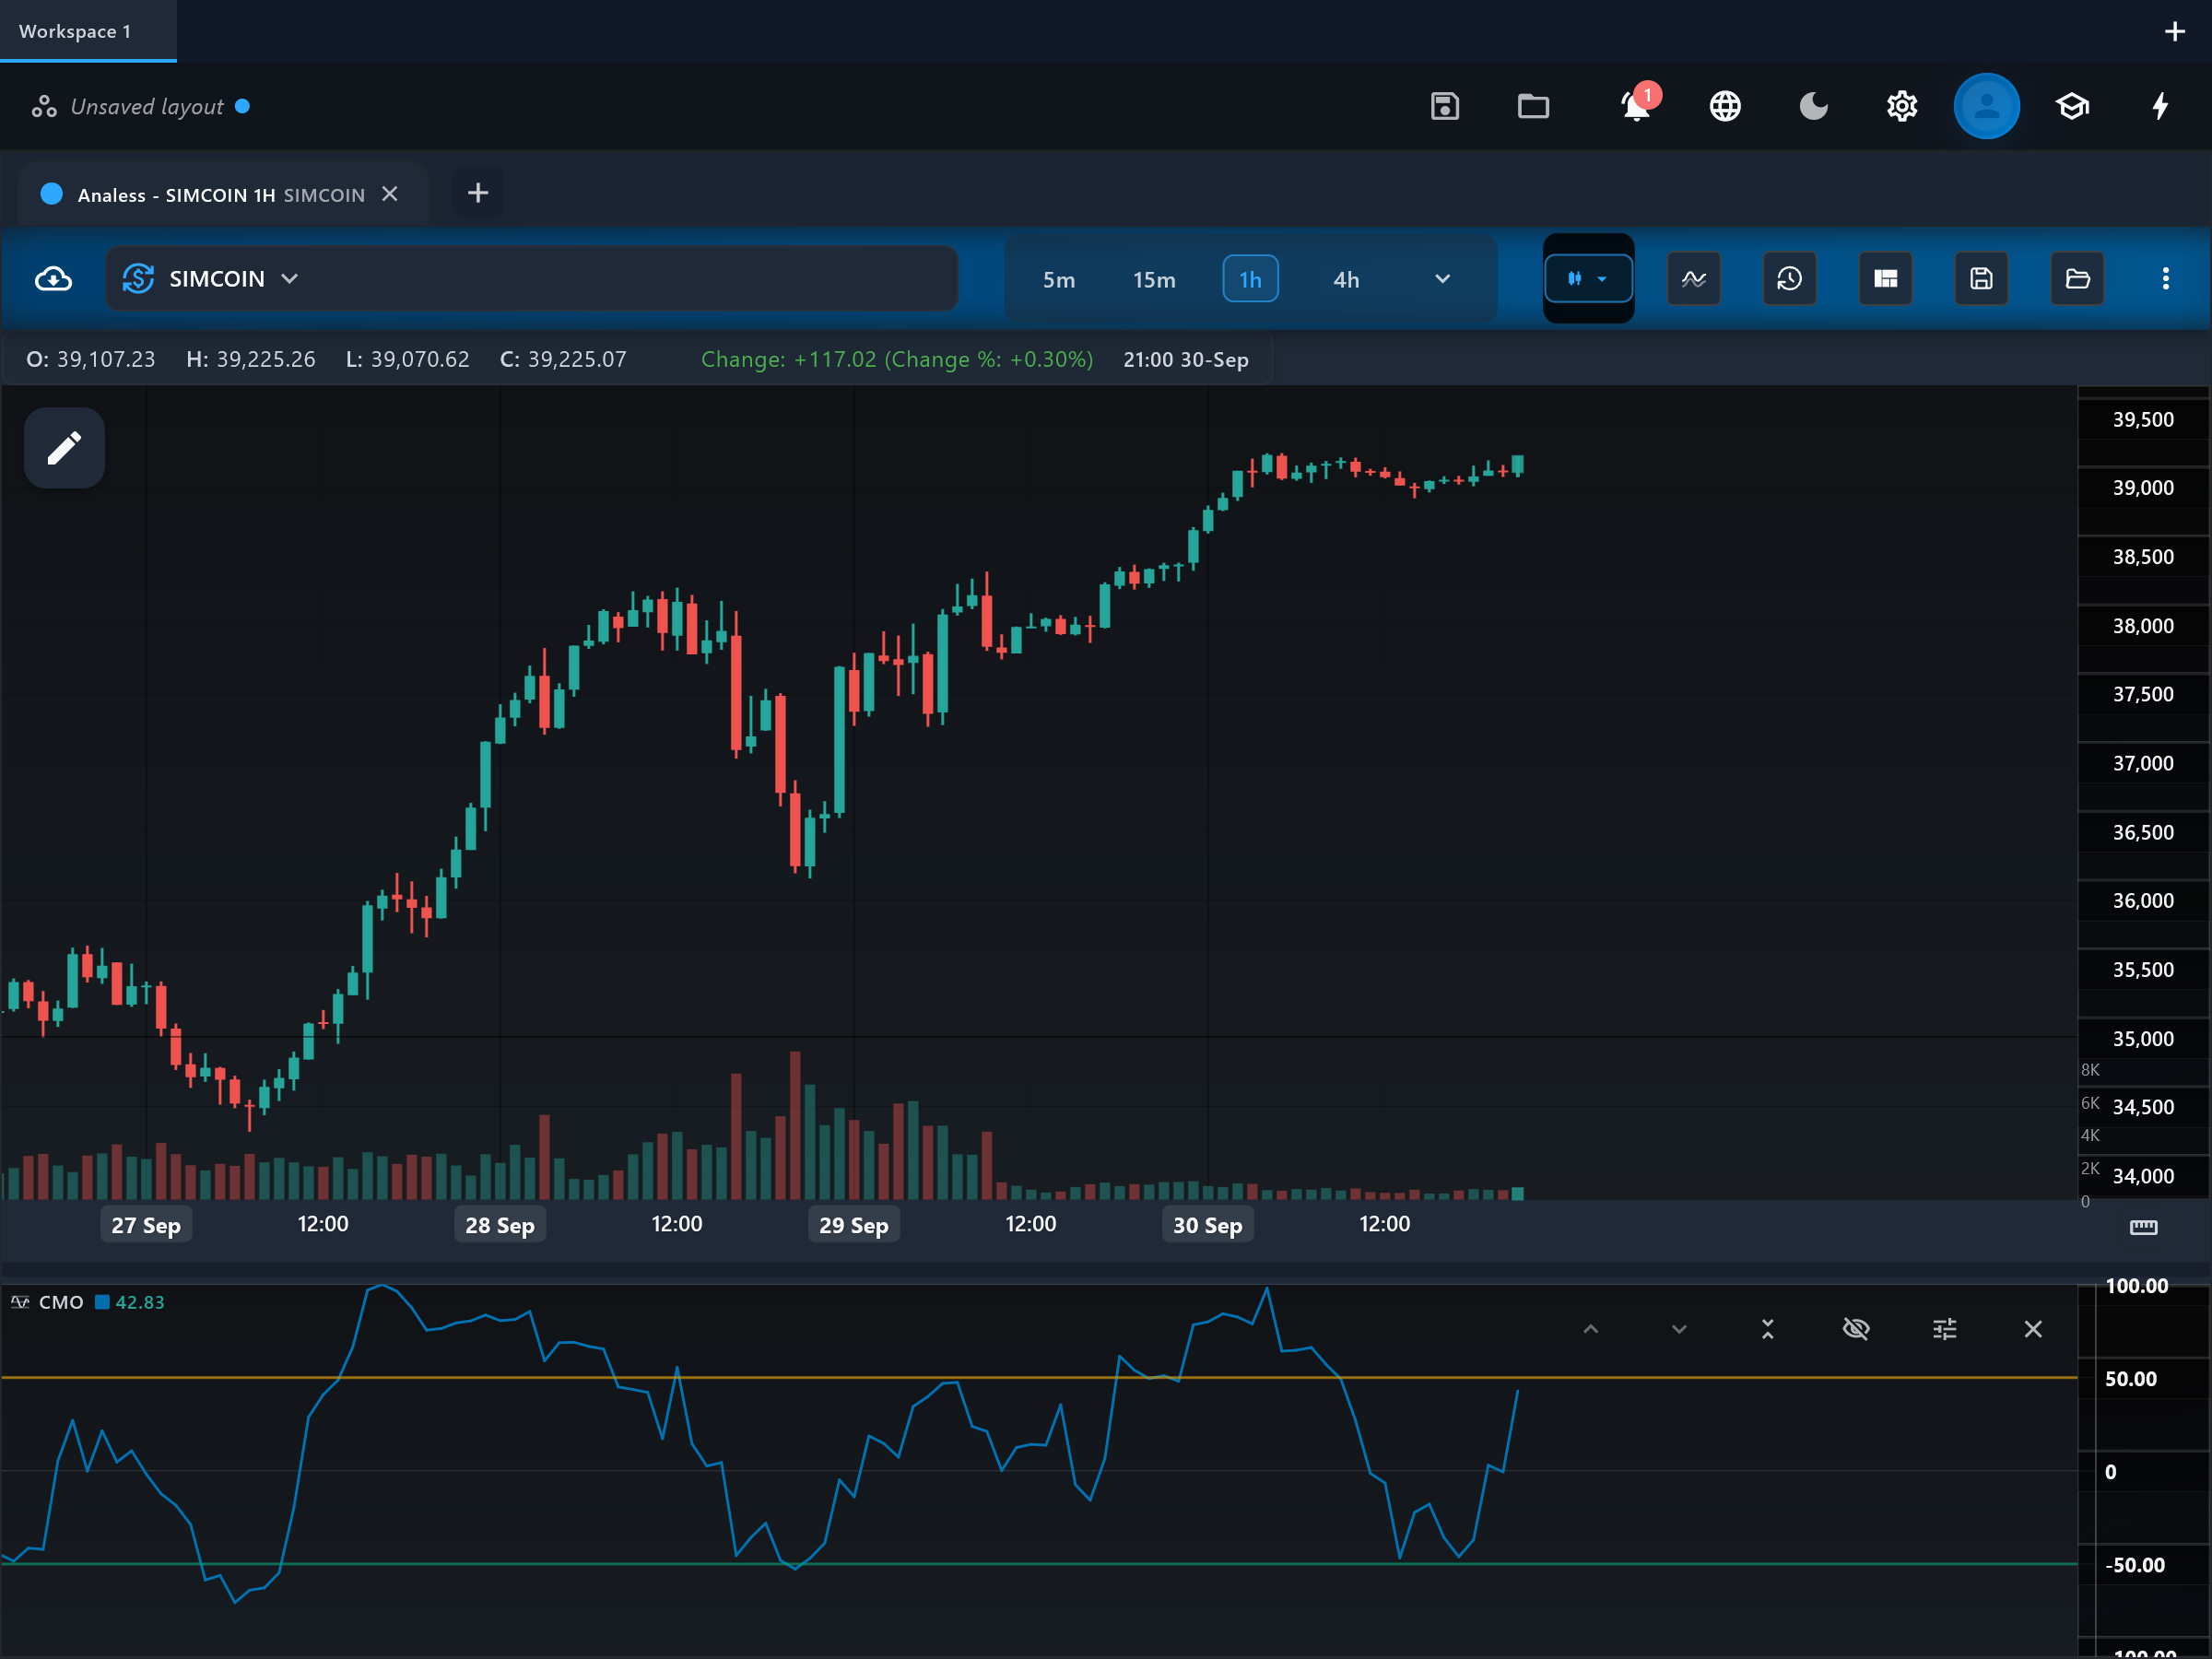
The pane shows the "cmo" line with "overbought" (+50) and "oversold" (-50) guide lines around an implicit zero midpoint. Above +50, gains have dominated heavily over the window; below -50, losses have. The zero line separates net-bullish from net-bearish pressure and can serve as a simple direction filter. Because the sums are unsmoothed, the line moves faster and hits its extremes more often than RSI.
What to look for
- Overbought / oversoldContext
Beyond +50 or -50 the window is dominated by one side — stretched conditions in a range, persistence in a trend.
- Centre-line crossContext
Zero crosses mark the balance of gains versus losses flipping — a quick momentum-direction gauge.
- DivergenceContext
Price extremes not matched by CMO extremes indicate weakening one-sided pressure.
When to use it
CMO fits short-term traders who want a faster, symmetric alternative to RSI on liquid markets, and Chande also proposed using its absolute value as a trendiness gauge. As a bounded oscillator it misleads in strong trends — it will pin near an extreme while the move runs on, so do not fade +50/-50 readings against a confirmed trend. The short default period makes it noisy on very quiet instruments.
Works well with
Settings explained
period- Default 9 — the gain/loss summation window. Lower values make an already fast oscillator faster still; raising it toward 14-20 slows it closer to RSI-like behavior.
source- Default close — the price series whose bar-to-bar changes are summed.
Limitations and common mistakes
- Unsmoothed sums make it noticeably noisier than RSI at the same period.
- Pins at extremes during strong trends, like every bounded oscillator.
- The +50/-50 zones are conventions, not calibrated probabilities.
References
- Origin: Tushar Chande, 1994.
This page explains how an indicator is calculated and read. It describes past data, not what price will do next, and it is not a recommendation to trade. Read the disclaimers.
Try it in Analess
Add CMO to any chart, adjust its settings, and open this explainer from the indicator itself.