















Indicators · Momentum & oscillators
Connors RSI
A composite of RSI, streak length, and rate-of-change built for short-term mean-reversion study.
Origin: Larry Connors and Cesar Alvarez, 2012
- Best suited to
- Ranging markets
- Responsiveness
- Leading
- Family
- Momentum & oscillators
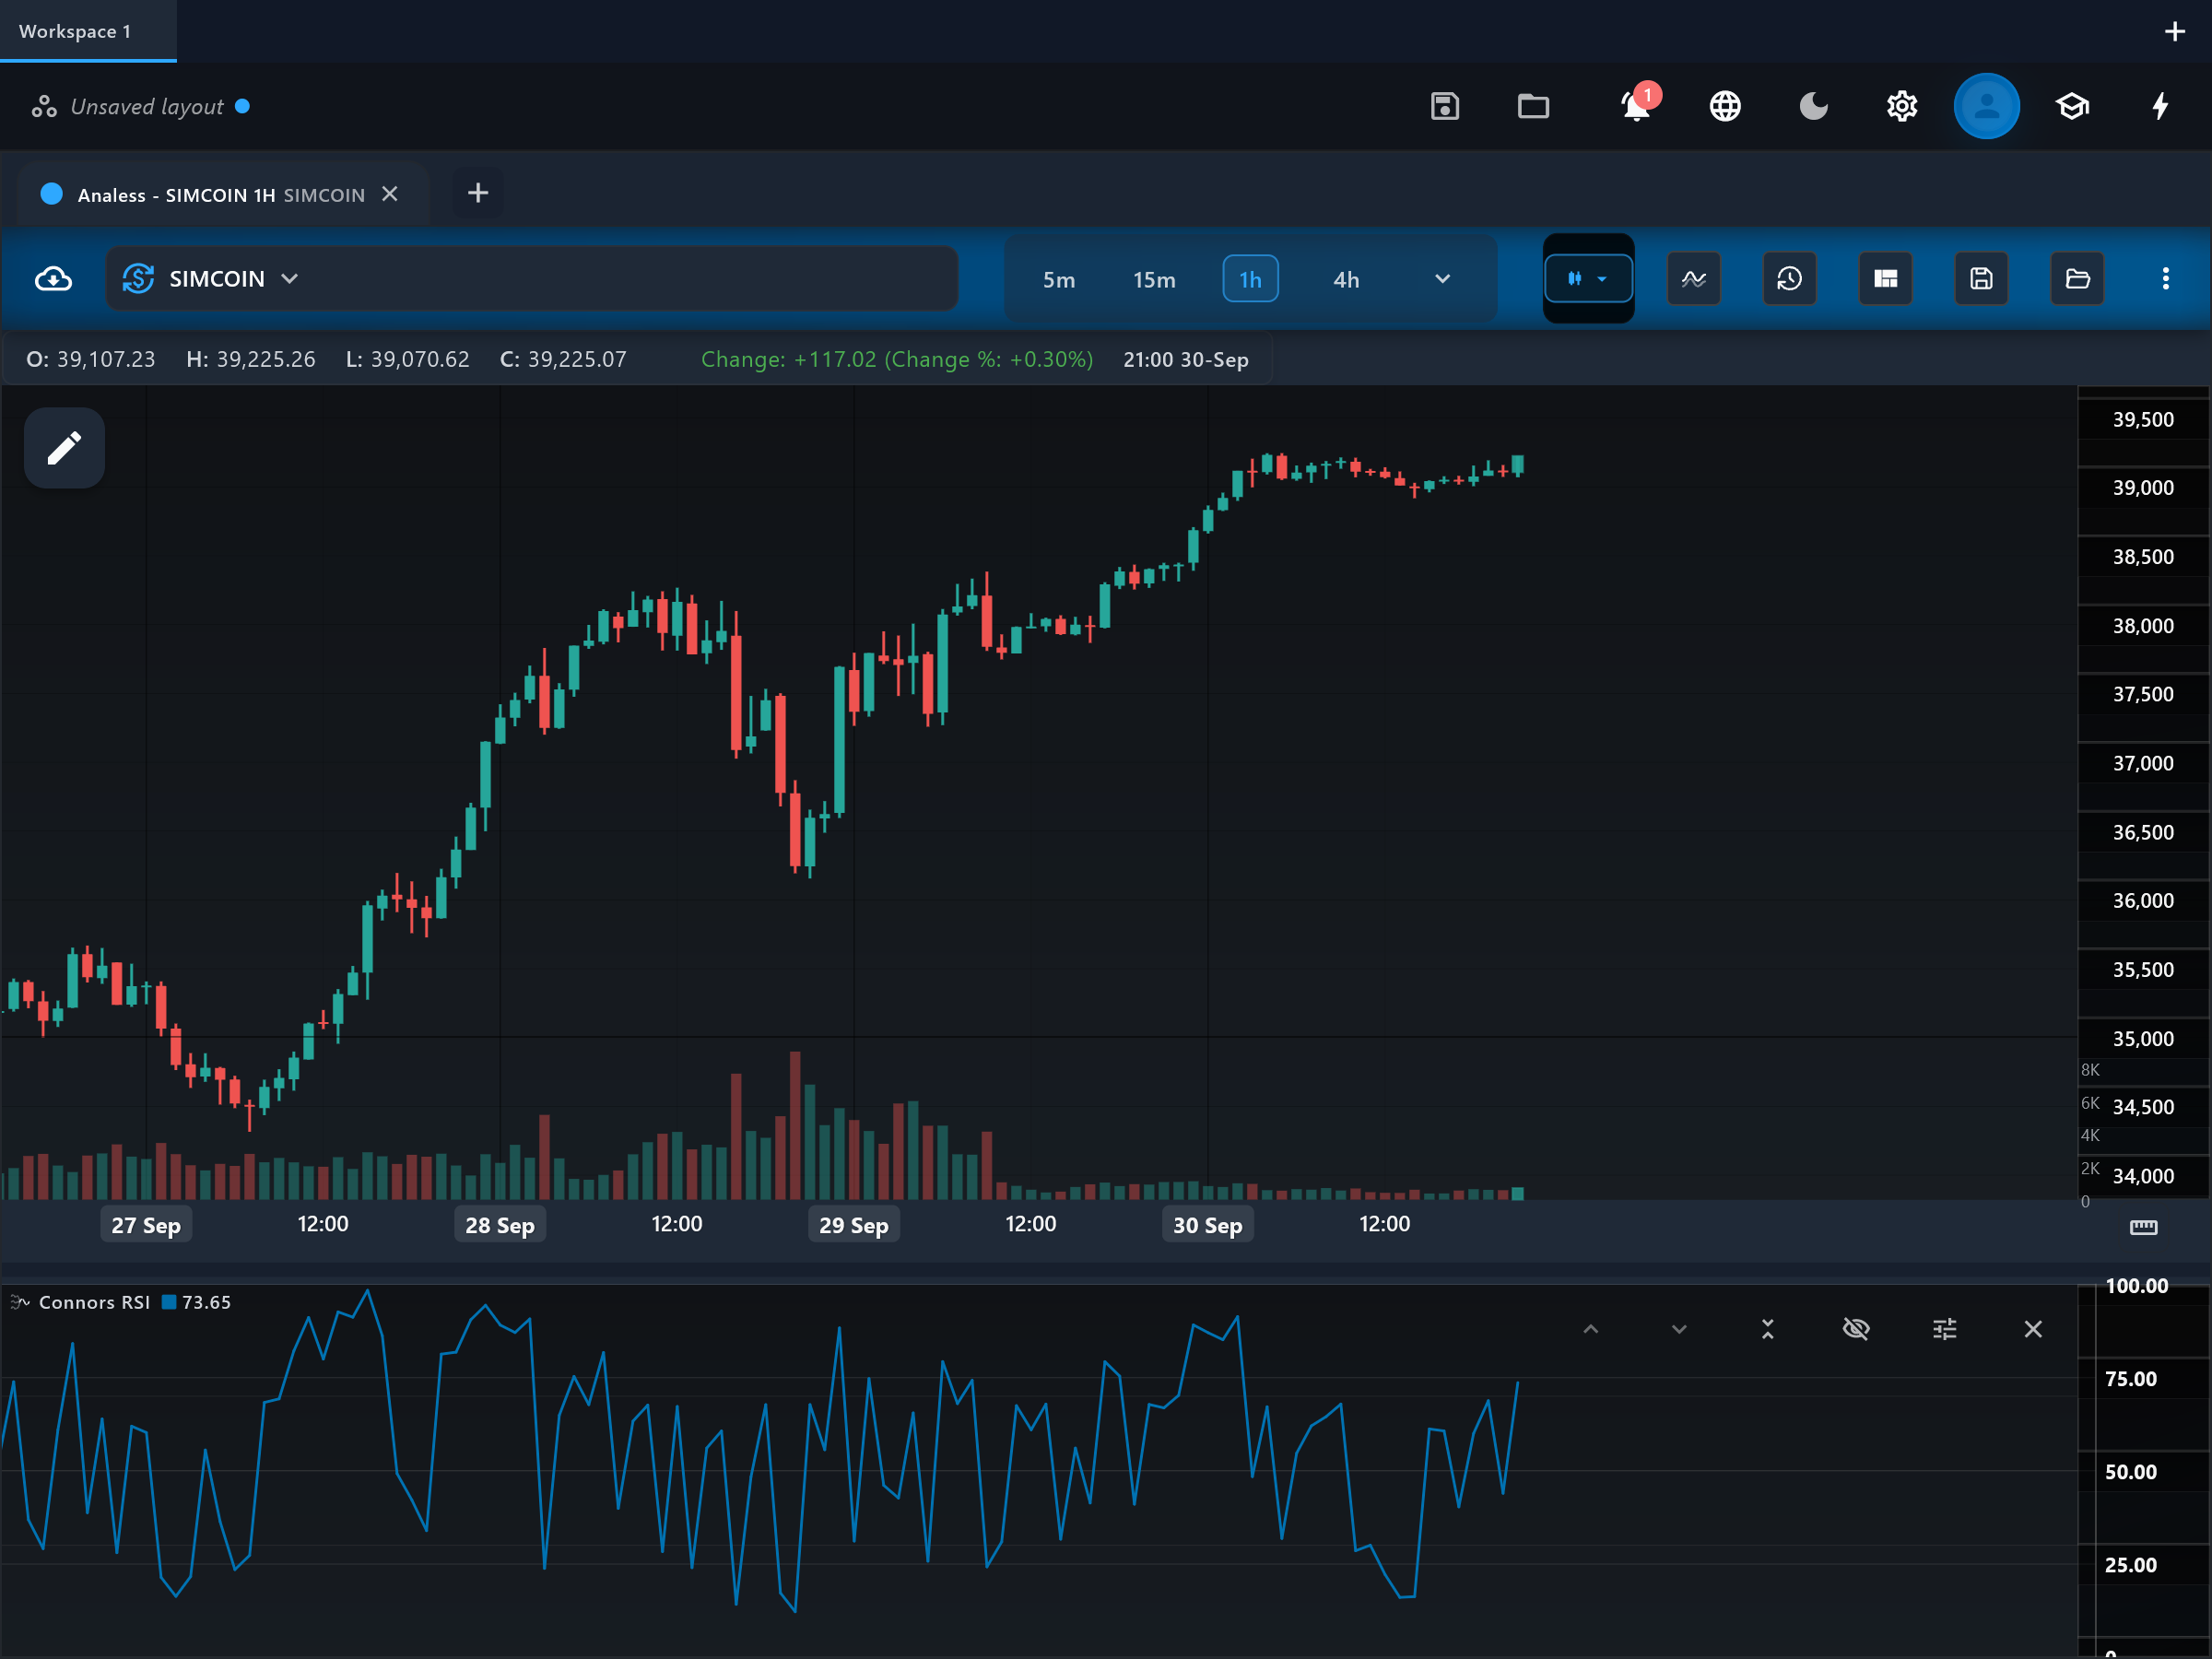
What it is
Connors RSI is a composite short-term oscillator built for mean-reversion trading — spotting moments when price has stretched so far, so fast, that a snap-back is statistically likely. It blends three separate measurements of "stretched" into one 0–100 reading. Compared with the classic 14-period RSI, it is far more sensitive and reaches extremes far more often.
How it is calculated
Three components are averaged with equal weight: a short RSI of closing price (default 3 periods); an RSI of the up/down streak — the running count of consecutive higher or lower closes (default 2 periods); and the percent rank of the latest one-bar rate of change within its trailing window (default 100 bars), which asks "how extreme was today's move versus the last 100 days?". The equal-weight average of the three is the Connors RSI line.
How to read it
The single "connors_rsi_line" plot moves between 0 and 100. Readings above roughly 90 mean price is short-term overbought — stretched to the upside across all three components — while readings below roughly 10 mean it is short-term oversold; Connors and Alvarez often used even stricter 95/5 thresholds. Because the components are so short, the line spikes and mean-reverts quickly: extremes are meant to be acted on within a few bars, not tracked for weeks. Mid-range readings carry little information.
What to look for
- Overbought / oversoldUpside
The line drops below 10 (or a stricter 5), flagging a short-term oversold stretch that mean-reversion strategies treat as a potential bounce zone.
- Overbought / oversoldDownside
The line rises above 90 (or 95), flagging a short-term overbought stretch that often precedes a pause or pullback.
- ConfirmationContext
The line exiting an extreme (e.g. crossing back above 10 after an oversold spike) confirms that the snap-back has started rather than anticipating it.
When to use it
Connors RSI was designed and tested on liquid US equities and ETFs on daily bars, in the context of a longer-term uptrend filter — the original strategies bought oversold readings only above the 200-day moving average. It carries over reasonably to other liquid, mean-reverting instruments. Do not use it as a trend-following tool, and be careful in strong one-way trends or crashes: an oversold reading can stay oversold while price keeps falling.
Works well with
Settings explained
rsiPeriod- Period of the price RSI component. The default 3 is the published value and is intentionally very short. Raising it slows the whole composite and reduces the number of extreme readings; lowering it (to 2) makes it even more hair-trigger.
streakRSIPeriod- Period of the RSI applied to the up/down close streak. The default 2 is the published value. A longer period dampens the streak component's influence on quick runs of consecutive closes.
percentRankPeriod- Lookback window for ranking the latest one-bar move. The default 100 asks how today's move compares with the last 100 bars. A shorter window makes the rank react to recent volatility regimes; a longer one gives a more stable notion of "extreme".
Limitations and common mistakes
- It is a mean-reversion tool by construction — in a strong trend it generates counter-trend extremes early and often.
- The percent-rank component needs its full lookback (default 100 bars) of history before readings are meaningful.
- Extreme thresholds (90/10 or 95/5) are strategy conventions, not guarantees; an instrument can pin at an extreme during news-driven moves.
- Its published edge came from daily equity data — behaviour on very short intraday timeframes or thin markets is not comparable.
References
- Origin: Larry Connors and Cesar Alvarez, 2012.
- Relative strength index — Wikipedia (opens in a new tab)
This page explains how an indicator is calculated and read. It describes past data, not what price will do next, and it is not a recommendation to trade. Read the disclaimers.
Try it in Analess
Add Connors RSI to any chart, adjust its settings, and open this explainer from the indicator itself.