















Indicators · Momentum & oscillators
Balance Of Power
Compares buying and selling strength within each bar’s range.
Origin: Igor Livshin, 2001
- Best suited to
- Any market condition
- Responsiveness
- Coincident
- Family
- Momentum & oscillators
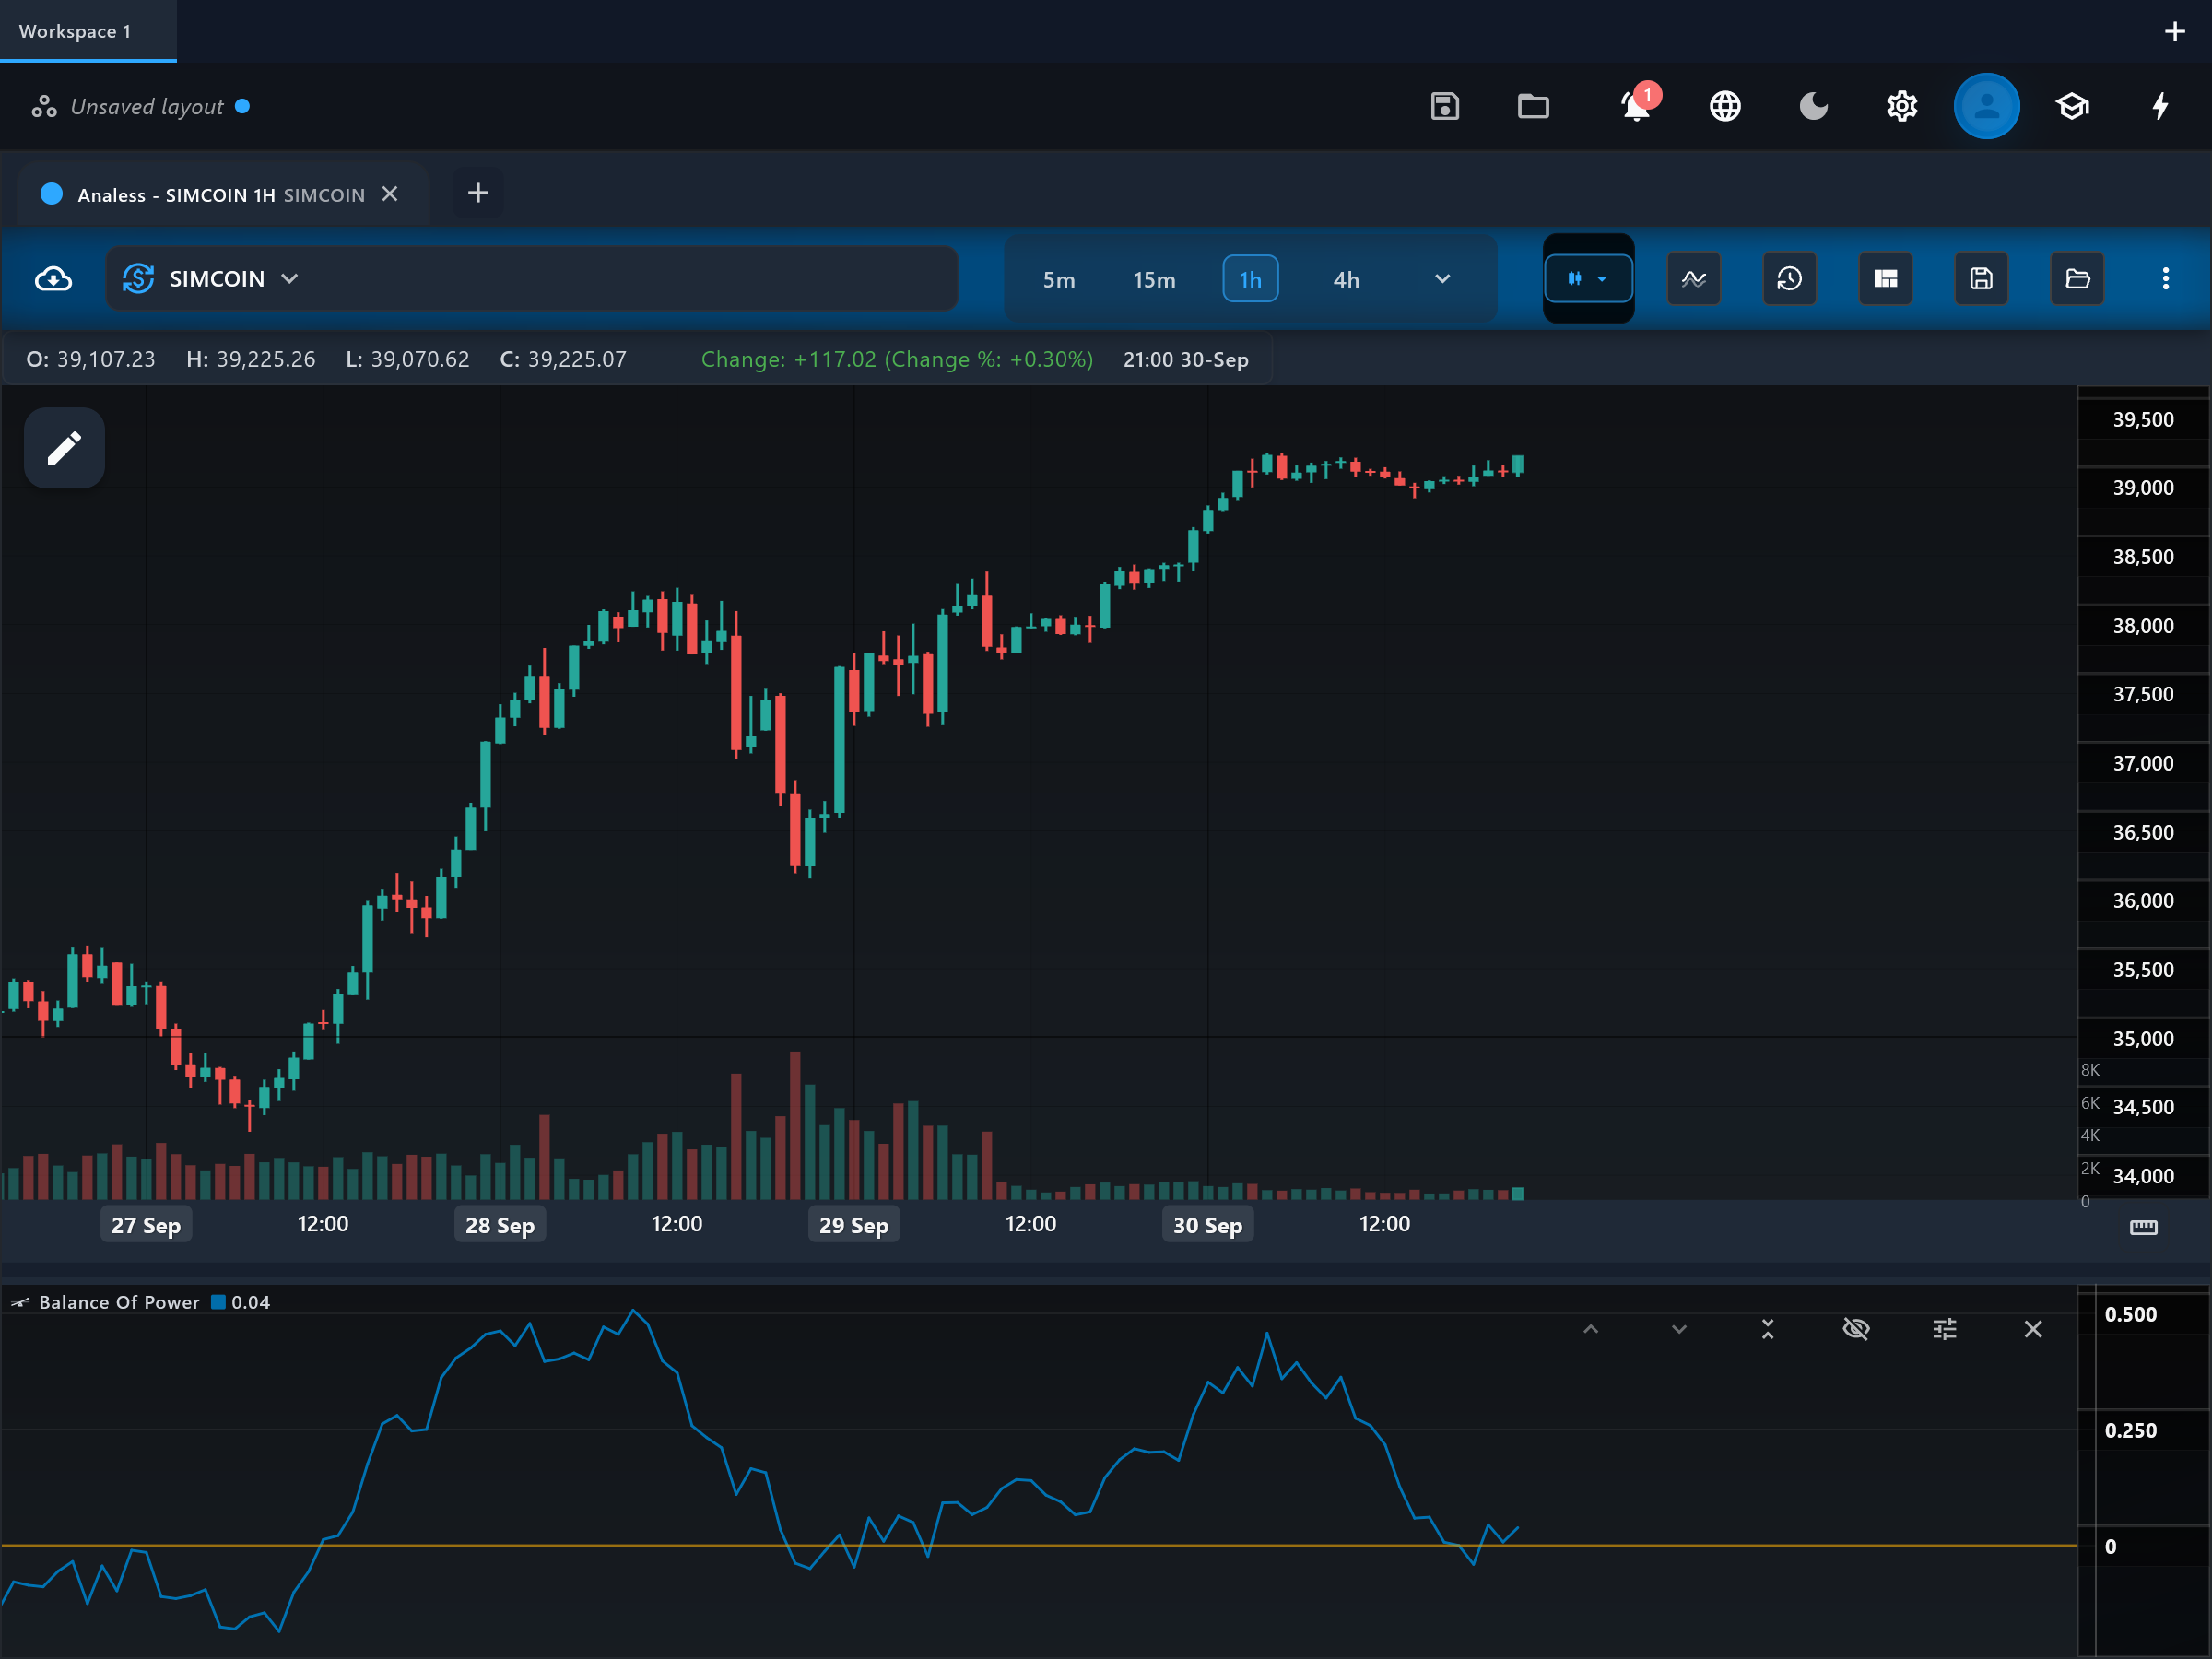
What it is
Balance of Power (BOP) gauges the ongoing tug-of-war between buyers and sellers by asking, bar by bar, how much of the range the winning side actually captured. A close near the high after a wide bar shows buyers in control; a close near the low shows sellers. Smoothed over time, it becomes a gentle oscillator of who is winning.
How it is calculated
For each bar the raw value (close - open) / (high - low) is computed — the fraction of the bar's range that the session's net move covered, between -1 and +1. Because the raw series is extremely noisy, this app plots its simple moving average over the chosen period (default 14) rather than the raw values, which is the common charting-platform treatment.
How to read it
The single "bop" line oscillates around the "zero" level within roughly -1 to +1. Sustained readings above zero mean buyers have consistently closed bars nearer the highs — accumulation-style control — while sustained readings below zero show seller control. The level rarely reaches the extremes once smoothed; direction and side-of-zero are the meaningful reads. Divergences, where price trends on but BOP drifts back toward zero, warn that control is quietly changing hands.
What to look for
- Centre-line crossUpside
The "bop" line crosses above zero, indicating buyers have taken net control of the recent bars.
- Centre-line crossDownside
The "bop" line crosses below zero, indicating sellers are closing bars nearer the lows.
- Trend filterContext
BOP holding persistently on one side of zero acts as a control filter — trade setups aligned with the controlling side tend to be cleaner.
- DivergenceContext
Price makes a new extreme while BOP weakens toward zero, suggesting the controlling side is losing its grip.
When to use it
BOP works on any bar-based market but is most informative where the open is meaningful — stocks, futures, and session-based FX — and on timeframes from hourly to daily. It serves best as a supporting read on who controls the tape while another indicator defines the setup. Avoid leaning on it in 24/7 markets during dead hours (open and close converge, muting the numerator) and on doji-heavy, narrow-range charts where the ratio is erratic.
Works well with
Settings explained
period- The SMA length applied to the raw per-bar ratio, default 14. The raw series is nearly unreadable unsmoothed; a longer period gives a steadier control reading, a shorter one tracks shifts in control faster but jitters more.
Limitations and common mistakes
- The raw per-bar values are extremely noisy — every reading here is already an average, so expect lag proportional to the period.
- Bars where high equals low (or nearly so) make the ratio unstable; illiquid instruments produce spiky, unreliable readings.
- BOP ignores volume entirely — "power" here is a price-position metaphor, not a measure of traded size.
References
- Origin: Igor Livshin, 2001.
This page explains how an indicator is calculated and read. It describes past data, not what price will do next, and it is not a recommendation to trade. Read the disclaimers.
Try it in Analess
Add Balance Of Power to any chart, adjust its settings, and open this explainer from the indicator itself.