















Indicators · Volume
Accumulation Distribution
A running total that weights volume by where price closes in its range, tracking accumulation and distribution.
Origin: Marc Chaikin
- Best suited to
- Trending markets
- Responsiveness
- Leading
- Family
- Volume
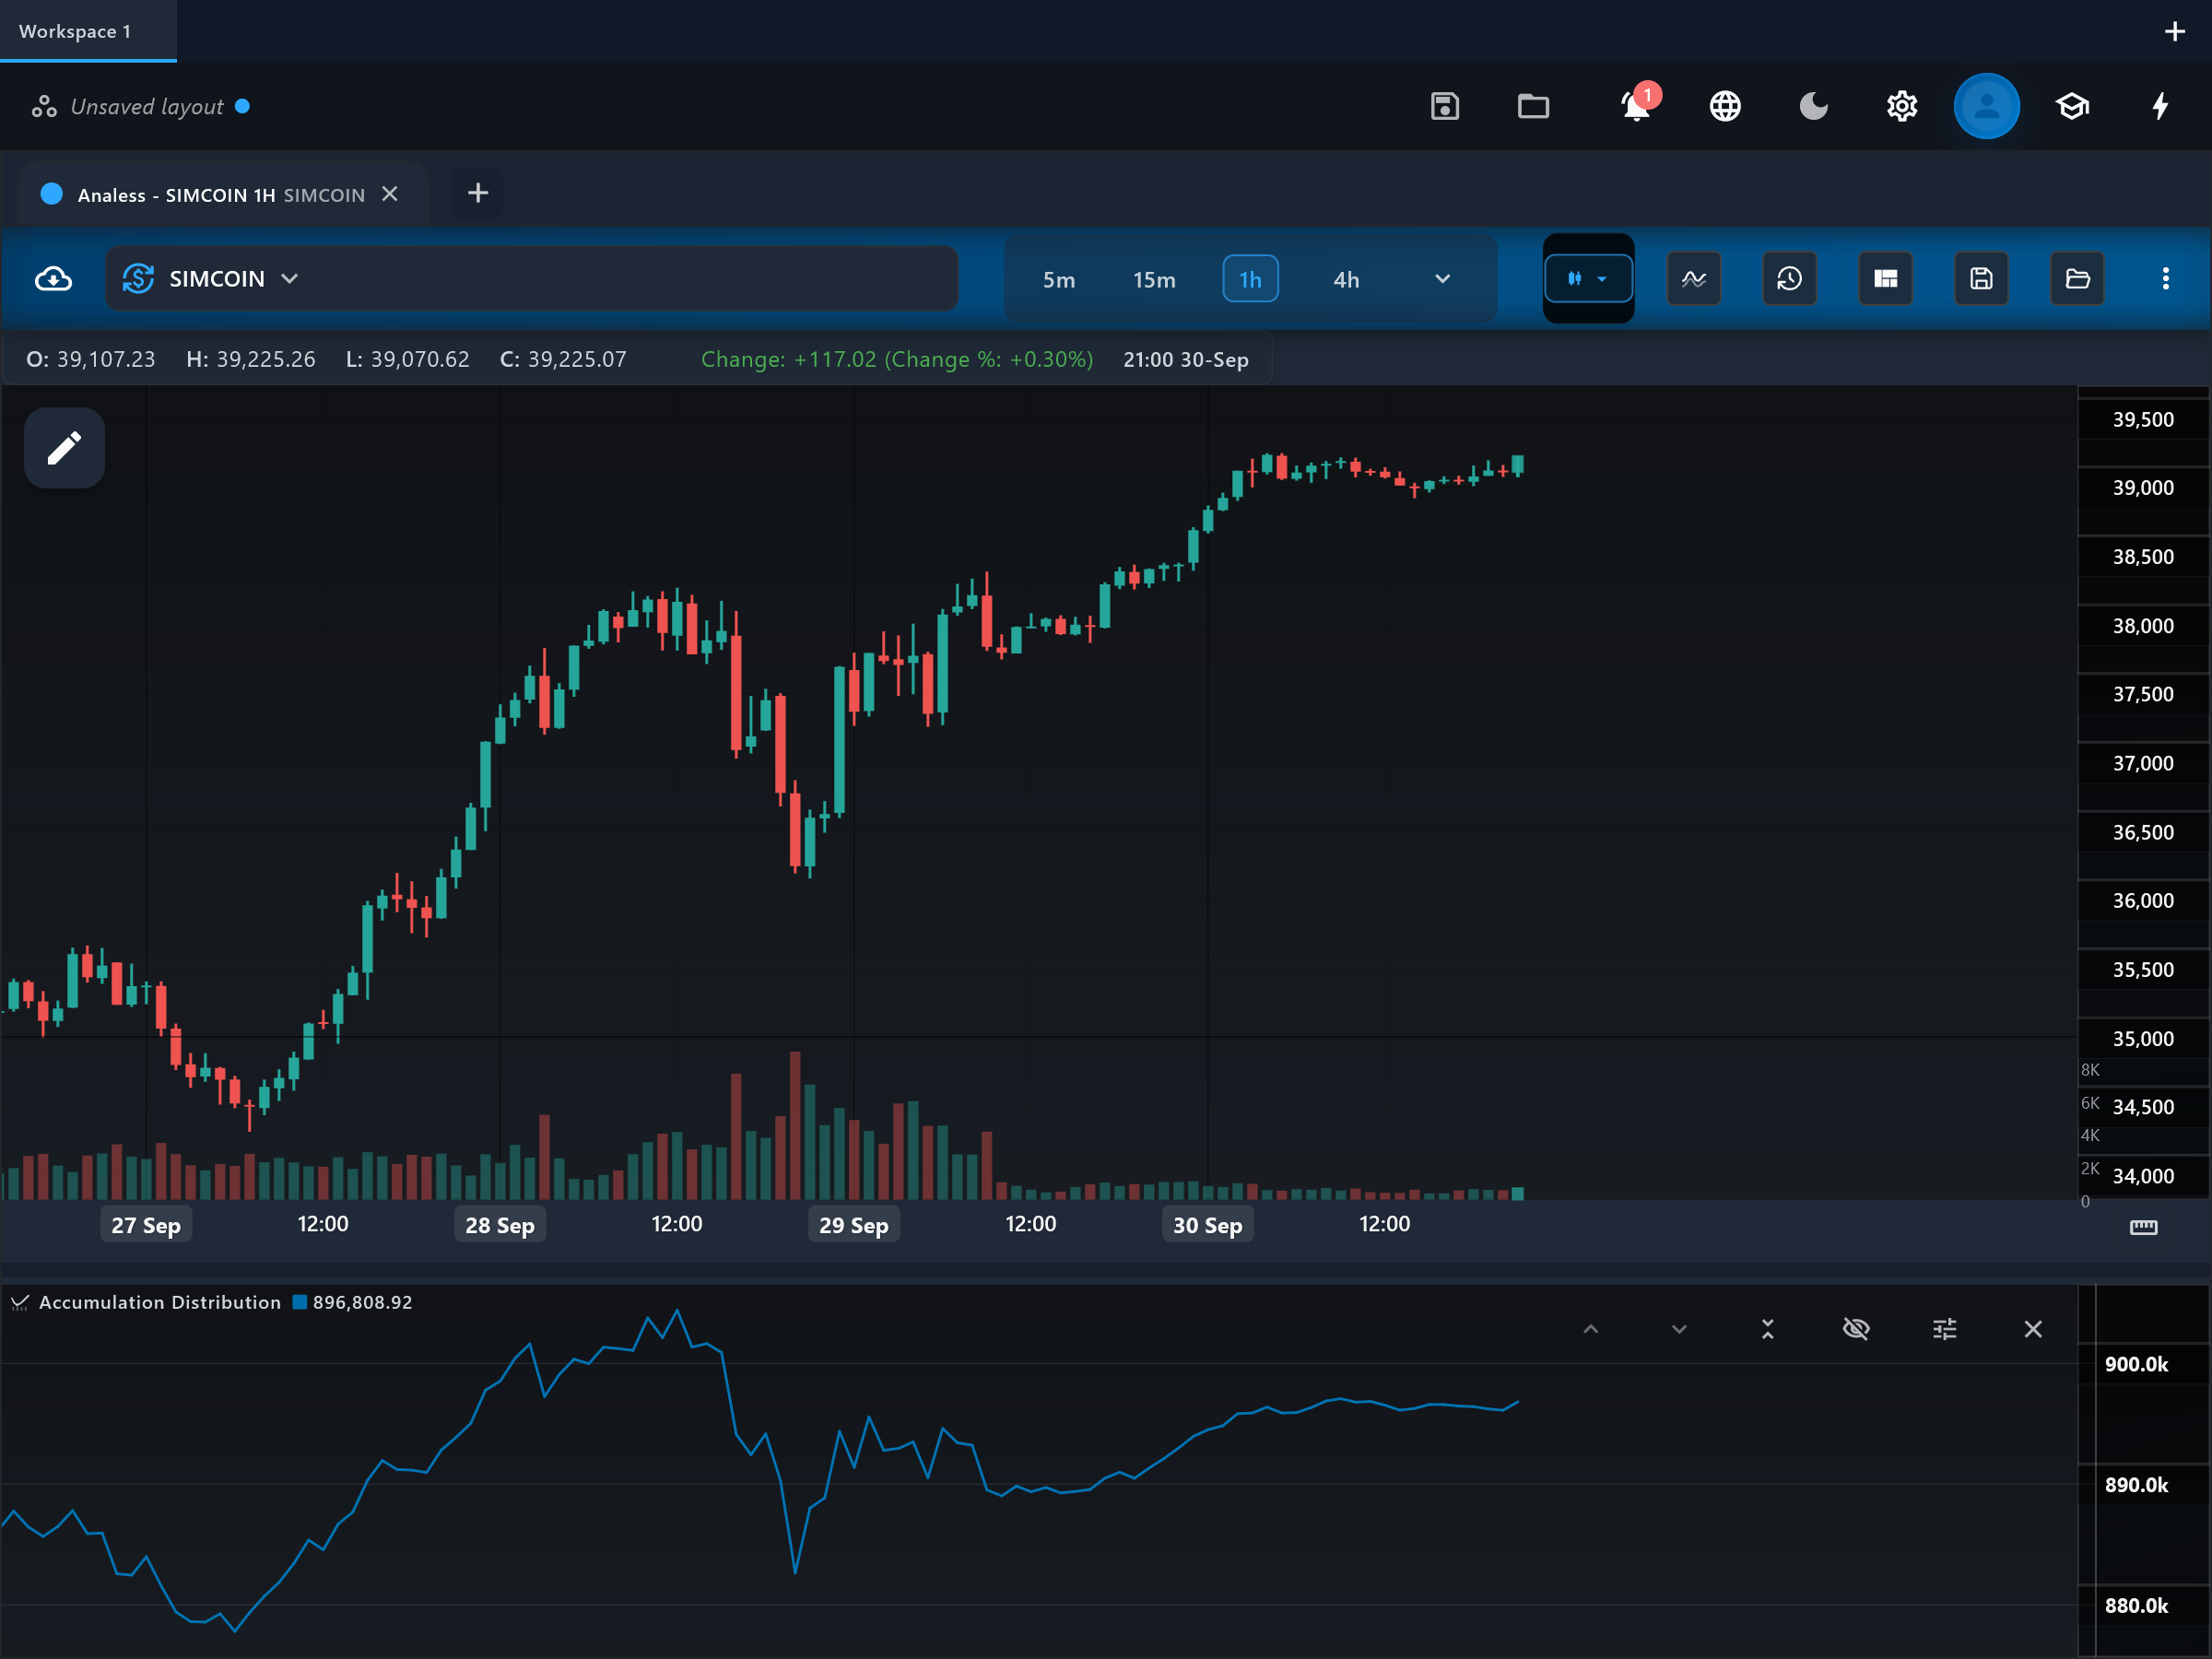
What it is
The Accumulation/Distribution line (A/D) is a cumulative volume indicator that weights each bar's volume by where the close sits inside the bar's high-low range. Closes near the high count as accumulation (buying pressure); closes near the low count as distribution (selling pressure).
How it is calculated
For each bar this app computes the money-flow multiplier ((close - low) - (high - close)) / (high - low), which runs from +1 (close at the high) to -1 (close at the low), multiplies it by the bar's volume to get money-flow volume, and keeps a running cumulative sum. There are no parameters.
How to read it
The "ad_line" is read by direction and by comparison with price, not by its absolute value. A rising ad_line means bars are consistently closing in the upper part of their ranges on meaningful volume — conventional accumulation. A falling ad_line means closes keep landing near the lows — distribution. The highest-value reads come from divergences: price trending one way while the ad_line trends the other. Unlike OBV, which uses only the close-to-close direction, A/D uses intrabar position, so the two lines can tell different stories on the same chart.
What to look for
- ConfirmationUpside
The ad_line making new highs together with price confirms that the advance is backed by closes near bar highs on real volume.
- DivergenceDownside
Price at a new high while the ad_line fails to make one suggests the rally bars are closing weakly within their ranges — quiet distribution.
- DivergenceUpside
Price at a new low while the ad_line holds higher suggests sellers are no longer finishing bars near the lows.
When to use it
Best on liquid stocks, ETFs, and major crypto pairs, on daily and intraday timeframes. Avoid thin or illiquid symbols, where one print can swing the multiplier, and note that on spot forex the volume input is tick volume, not real size.
Works well with
Limitations and common mistakes
- A/D is gap-blind: the multiplier only looks at where the close sits inside the bar's own range, so a stock that gaps down hard but closes mid-range can still add to the line — OBV, which compares close to previous close, catches gaps that A/D ignores.
- The absolute value depends on where the loaded history starts; only the slope and divergences are meaningful.
- Bars with tiny high-low ranges make the multiplier unstable.
- Like all cumulative lines, one extreme-volume bar can permanently offset it.
References
- Origin: Marc Chaikin.
- Accumulation/distribution index — Wikipedia (opens in a new tab)
This page explains how an indicator is calculated and read. It describes past data, not what price will do next, and it is not a recommendation to trade. Read the disclaimers.
Try it in Analess
Add Accumulation Distribution to any chart, adjust its settings, and open this explainer from the indicator itself.