















Indicators · Volume
CMF
Chaikin Money Flow — measures money flow over a period using volume and where price closes.
Origin: Marc Chaikin
- Best suited to
- Any market condition
- Responsiveness
- Coincident
- Family
- Volume
What it is
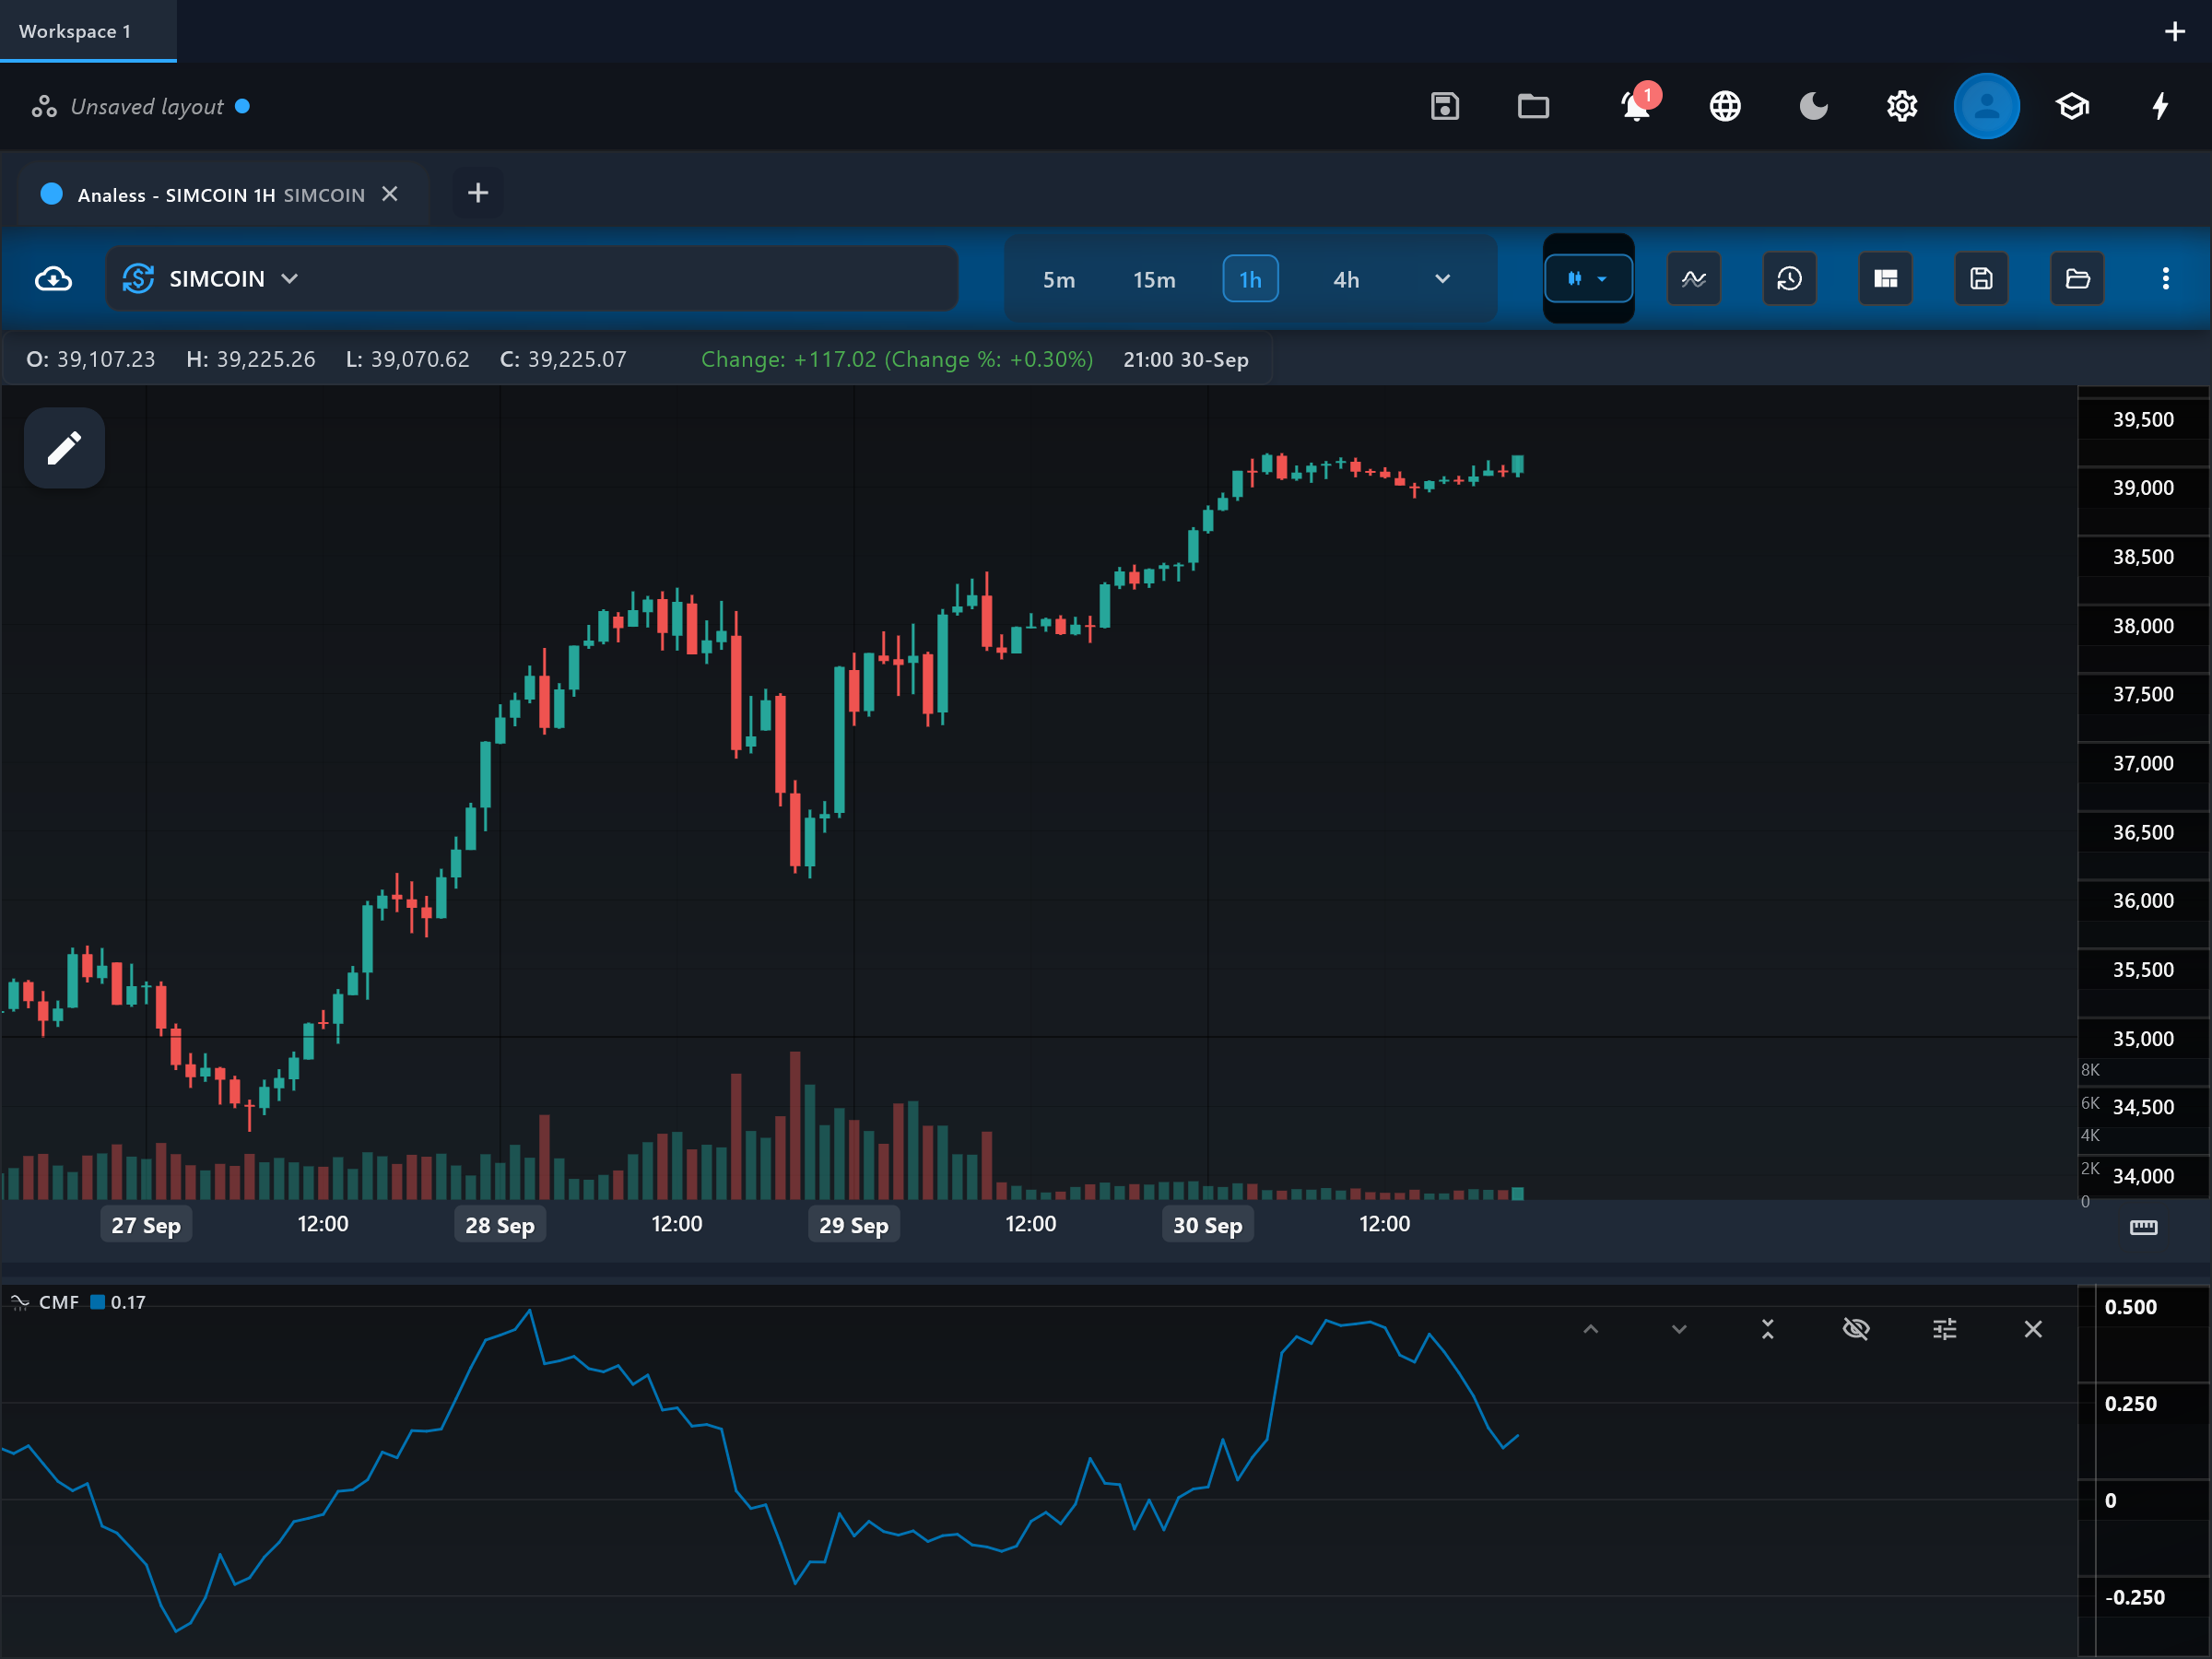
Chaikin Money Flow (CMF) measures buying versus selling pressure over a rolling window. It is the windowed, bounded cousin of the Accumulation/Distribution line: instead of a cumulative total, it shows the balance of money flow over the last N bars as a value between -1 and +1.
How it is calculated
This app sums money-flow volume (the A/D multiplier times volume) over the chosen period and divides it by the sum of raw volume over the same period. The result is bounded between -1 and +1, with 0 meaning buying and selling pressure balanced out over the window.
How to read it
The "cmf" line oscillates around zero. Sustained readings above zero mean bars in the window are mostly closing in their upper ranges on volume — net buying pressure; sustained readings below zero mean net selling pressure. Values are conventionally graded: beyond roughly +/-0.05 the pressure is considered mild but real, and beyond roughly +/-0.25 it is considered strong. Brief flickers across zero matter less than the side of zero the line lives on.
What to look for
- Centre-line crossContext
The cmf line crossing zero marks the rolling balance of money flow flipping between net buying and net selling; sustained crosses matter more than one-bar pokes.
- ConfirmationUpside
CMF holding above roughly +0.05 to +0.25 during an uptrend or breakout is conventionally read as volume-backed buying pressure supporting the move.
- DivergenceDownside
Price making higher highs while cmf weakens toward or below zero suggests the advance lacks money-flow support.
When to use it
Suits liquid stocks, ETFs, and major crypto pairs on intraday to daily timeframes. Thin or illiquid symbols distort the ratio because a few prints dominate both sums, and on spot forex the volume input is tick-based, so treat readings there as approximate.
Works well with
Settings explained
period- The rolling window over which money-flow volume and raw volume are summed (default 20, with 21 also traditional). Shorter windows react faster but whipsaw around zero; longer windows give smoother, slower readings of sustained pressure.
Limitations and common mistakes
- CMF inherits A/D's gap blindness — the multiplier ignores gaps between bars.
- A single extreme-volume bar influences the reading for the entire window and then drops out abruptly, which can jerk the line.
- The +/-0.05 and +/-0.25 guide levels are conventions, not statistics, and behave differently across symbols.
- Near-zero readings are ambiguous and best treated as no-signal.
References
- Origin: Marc Chaikin.
- Accumulation/distribution index — Wikipedia (opens in a new tab)
This page explains how an indicator is calculated and read. It describes past data, not what price will do next, and it is not a recommendation to trade. Read the disclaimers.
Try it in Analess
Add CMF to any chart, adjust its settings, and open this explainer from the indicator itself.