















Indicators · Volume
MFI
Money Flow Index — a volume-weighted RSI on a 0–100 scale.
Origin: Gene Quong & Avrum Soudack
- Best suited to
- Ranging markets
- Responsiveness
- Leading
- Family
- Volume
What it is
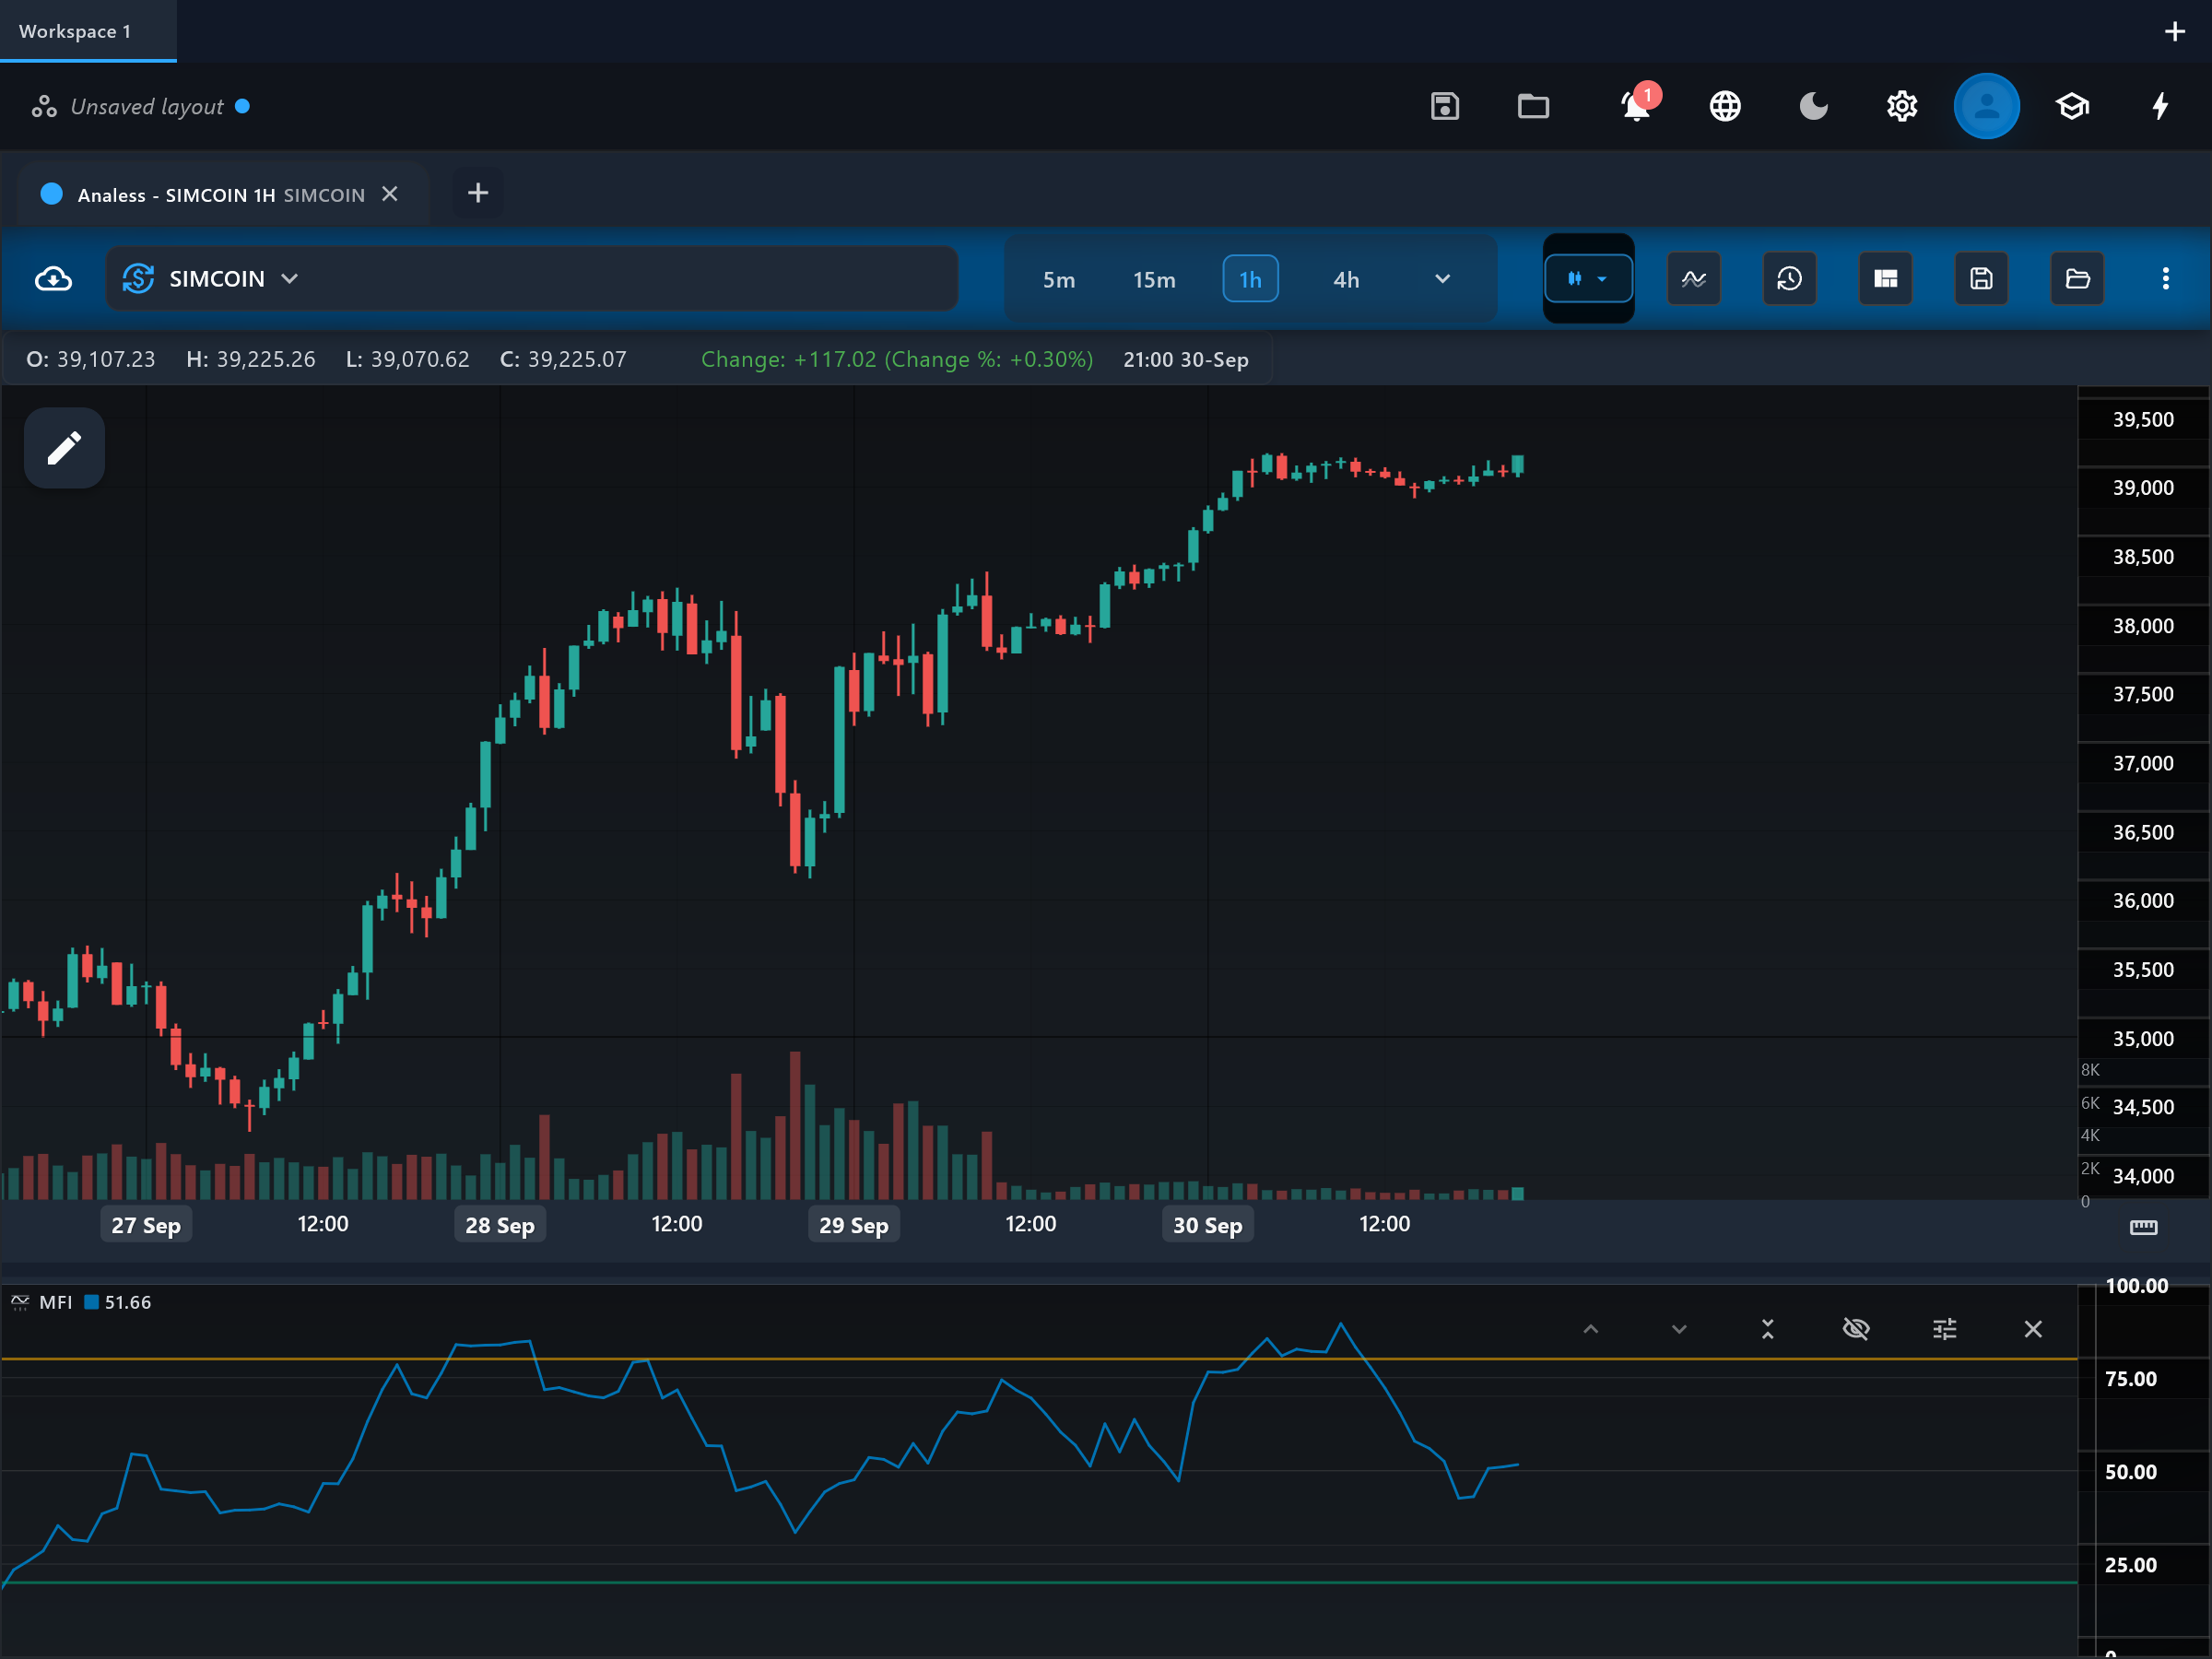
The Money Flow Index (MFI) is often called a volume-weighted RSI. It measures buying and selling pressure by combining price movement with volume, producing a bounded 0-100 oscillator where high readings suggest overheated buying and low readings suggest overdone selling.
How it is calculated
For each bar this app computes the typical price ((high + low + close) / 3) times volume — raw money flow. Money flow counts as positive when typical price rises and negative when it falls; the ratio of positive to negative money flow over the period is then scaled into 0-100 exactly like RSI, with volume as the weight.
How to read it
The "mfi" line moves between 0 and 100, with the "overbought" guide at 80 and the "oversold" guide at 20. Readings above 80 mean recent bars have carried heavily one-sided positive money flow; below 20, heavily negative. Because volume amplifies the reading, MFI can reach extremes faster than RSI on the same chart. In strong trends the line can pin above 80 or below 20 for extended stretches, so extremes are best read as stretched conditions, not automatic reversal points. Divergences between mfi and price at extremes are the classic higher-quality read.
What to look for
- Overbought / oversoldDownside
MFI above the overbought level (80, or 90 for a stricter read) flags stretched, volume-backed buying; conventionally traders wait for it to fall back below the level rather than acting on the touch.
- Overbought / oversoldUpside
MFI below the oversold level (20, or 10 for a stricter read) flags stretched selling pressure.
- DivergenceUpside
Price making a lower low while mfi makes a higher low from oversold territory is the classic bullish divergence described by Quong and Soudack.
- DivergenceDownside
Price making a higher high while mfi posts a lower high from overbought territory is the bearish counterpart.
When to use it
Best in ranging or gently trending markets on liquid stocks and major crypto pairs, where volume is real and the 80/20 extremes mean something. In strong trends it pins at extremes and generates premature reversal reads. Thin symbols distort the volume weighting, and on spot forex the tick-volume input makes MFI only an approximation.
Works well with
Settings explained
period- The lookback over which positive and negative money flow are accumulated (default 14). Shorter periods reach the extremes more often and whipsaw more; longer periods smooth the line and make extreme readings rarer but more significant.
overboughtLevel- The upper guide line (default 80). Raise it (e.g. to 90) to only flag the most stretched conditions in strongly trending markets; lower it for earlier but noisier overbought reads.
oversoldLevel- The lower guide line (default 20). Lower it (e.g. to 10) for stricter oversold reads; raise it for earlier but noisier ones.
Limitations and common mistakes
- In strong trends MFI stays pinned at extremes, so an extreme reading describes how strong the flow has been, not when it will end.
- It depends on trustworthy volume — thin symbols and tick-volume markets weaken it.
- Like RSI, it can diverge from price for a long time before anything happens.
- A single huge-volume bar dominates the window until it rolls out.
References
- Origin: Gene Quong & Avrum Soudack.
- Money flow index — Wikipedia (opens in a new tab)
This page explains how an indicator is calculated and read. It describes past data, not what price will do next, and it is not a recommendation to trade. Read the disclaimers.
Try it in Analess
Add MFI to any chart, adjust its settings, and open this explainer from the indicator itself.