















Indicators · Volume
Klinger Oscillator
Compares volume to price movement to track longer-term money flow, with a signal line.
Origin: Stephen Klinger, 1977
- Best suited to
- Trending markets
- Responsiveness
- Lagging
- Family
- Volume
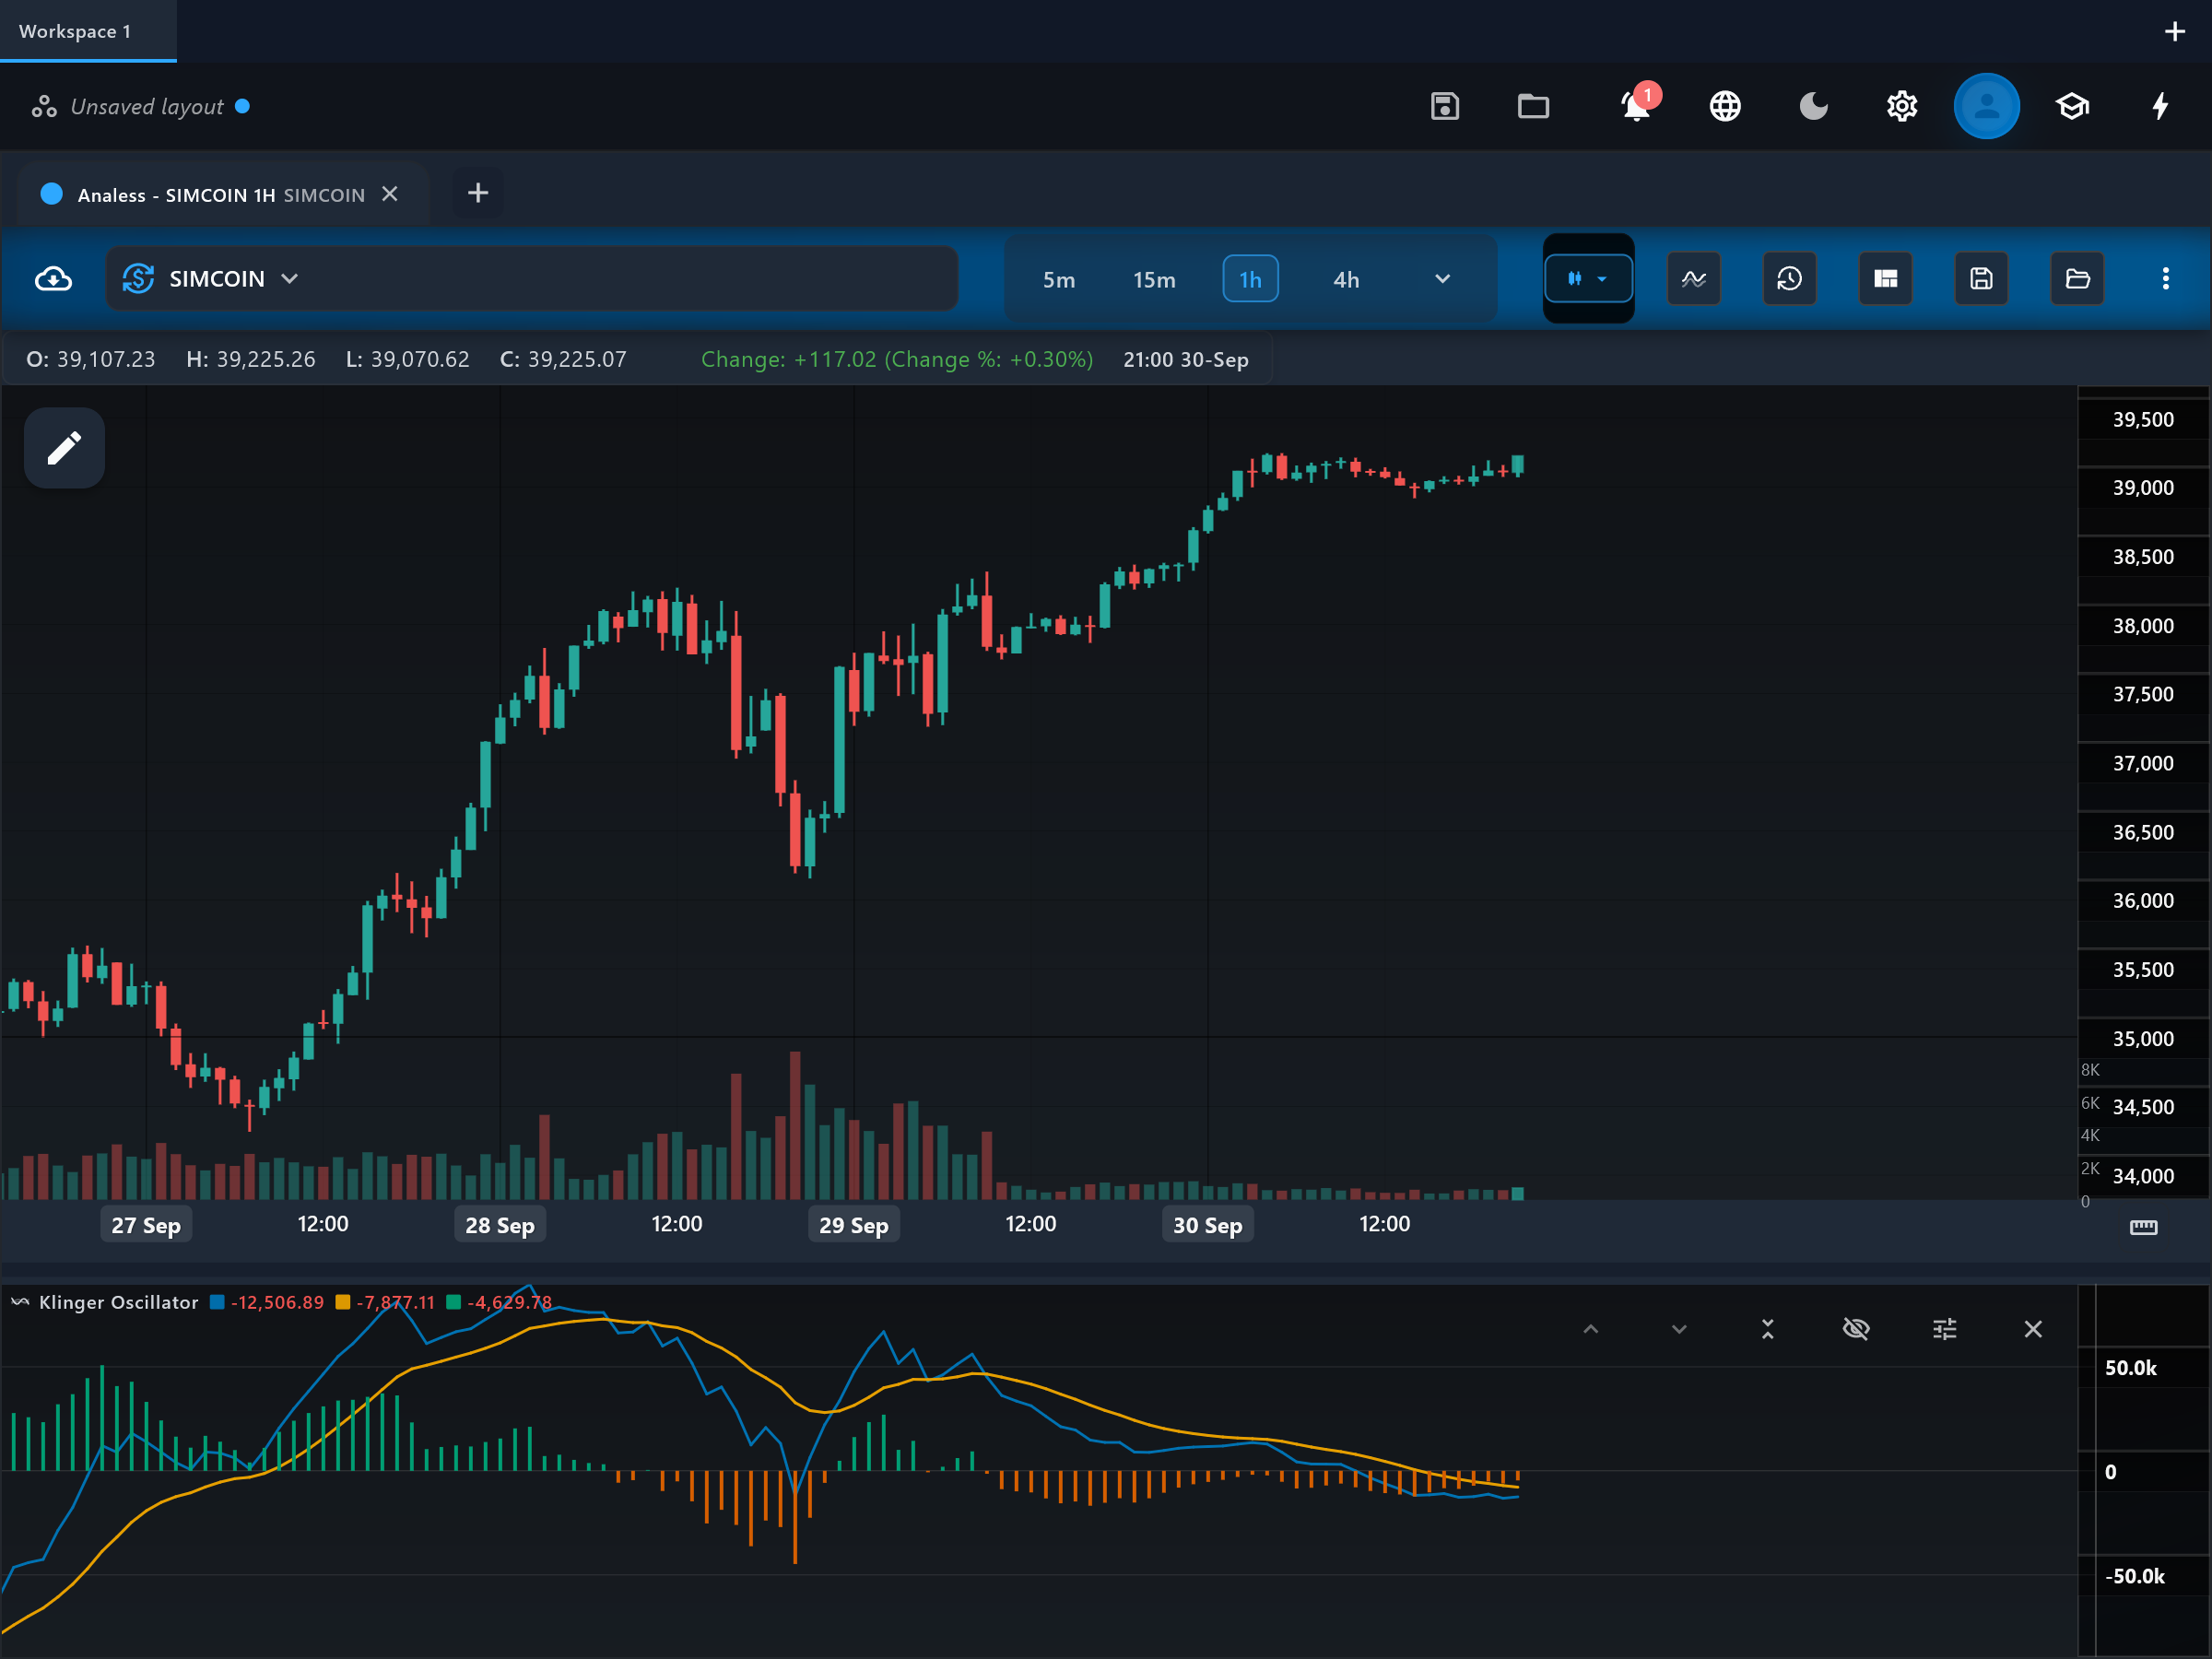
What it is
The Klinger Volume Oscillator (KVO) tries to capture the long-term trend of money flow while staying sensitive enough to catch shorter-term reversals. It converts volume into a signed "volume force" based on trend, range, and volume, then compares a fast and a slow EMA of that force.
How it is calculated
This app computes Klinger's volume-force series per bar, then subtracts a slow EMA of it (default 55) from a fast EMA (default 34) to form the oscillator. A signal line — an EMA of the oscillator itself (default 13) — and a histogram of the difference between the two are plotted alongside.
How to read it
The "klinger" line oscillates around zero: positive means the fast view of volume force is above the slow one (net accumulation pressure), negative means distribution pressure. The "signal_line" smooths the oscillator, and crosses between the two are the classic trigger. The "histogram" shows the gap between klinger and signal_line, so shrinking bars warn that a cross is approaching. Divergences between the oscillator's extremes and price extremes, especially when they occur far from zero, are the reads Klinger emphasized.
What to look for
- Signal-line crossUpside
The klinger line crossing above its signal_line, particularly while both are below zero, is the conventional bullish trigger.
- Signal-line crossDownside
The klinger line crossing below its signal_line, particularly from above zero, is the bearish counterpart.
- Centre-line crossContext
Zero-line crosses of the oscillator mark the balance of longer-term volume force flipping between accumulation and distribution.
- DivergenceContext
Price making a new extreme while the klinger line fails to follow is the divergence read Klinger designed the tool around.
When to use it
Best on liquid stocks, futures, and major crypto pairs on daily and higher-intraday timeframes, where its long EMAs have enough data to mean something. The 34/55/13 structure makes it slow and whipsaw-prone in choppy ranges; thin symbols and tick-volume forex undermine the volume-force input.
Works well with
Settings explained
shortPeriod- Length of the fast EMA of volume force (default 34). Lowering it makes the oscillator more responsive to recent volume thrust at the cost of more false crosses.
longPeriod- Length of the slow EMA of volume force (default 55). Raising it anchors the oscillator to the longer money-flow trend; it should stay above the short period.
signalPeriod- Length of the EMA drawn over the oscillator as the signal_line (default 13). Shorter values trigger crosses earlier but more often; longer values filter to bigger swings.
Limitations and common mistakes
- Many moving parts (volume-force formula plus three EMAs) make it harder to reason about than simpler volume tools.
- It whipsaws badly in sideways markets — most practitioners filter its crosses with the price trend.
- The long default EMAs need substantial history before readings stabilize.
- It depends on real volume; tick-volume markets weaken it.
References
- Origin: Stephen Klinger, 1977.
This page explains how an indicator is calculated and read. It describes past data, not what price will do next, and it is not a recommendation to trade. Read the disclaimers.
Try it in Analess
Add Klinger Oscillator to any chart, adjust its settings, and open this explainer from the indicator itself.