















Indicators · Volume
Chaikin Oscillator
The momentum of the Accumulation/Distribution line.
Origin: Marc Chaikin
- Best suited to
- Trending markets
- Responsiveness
- Leading
- Family
- Volume
What it is
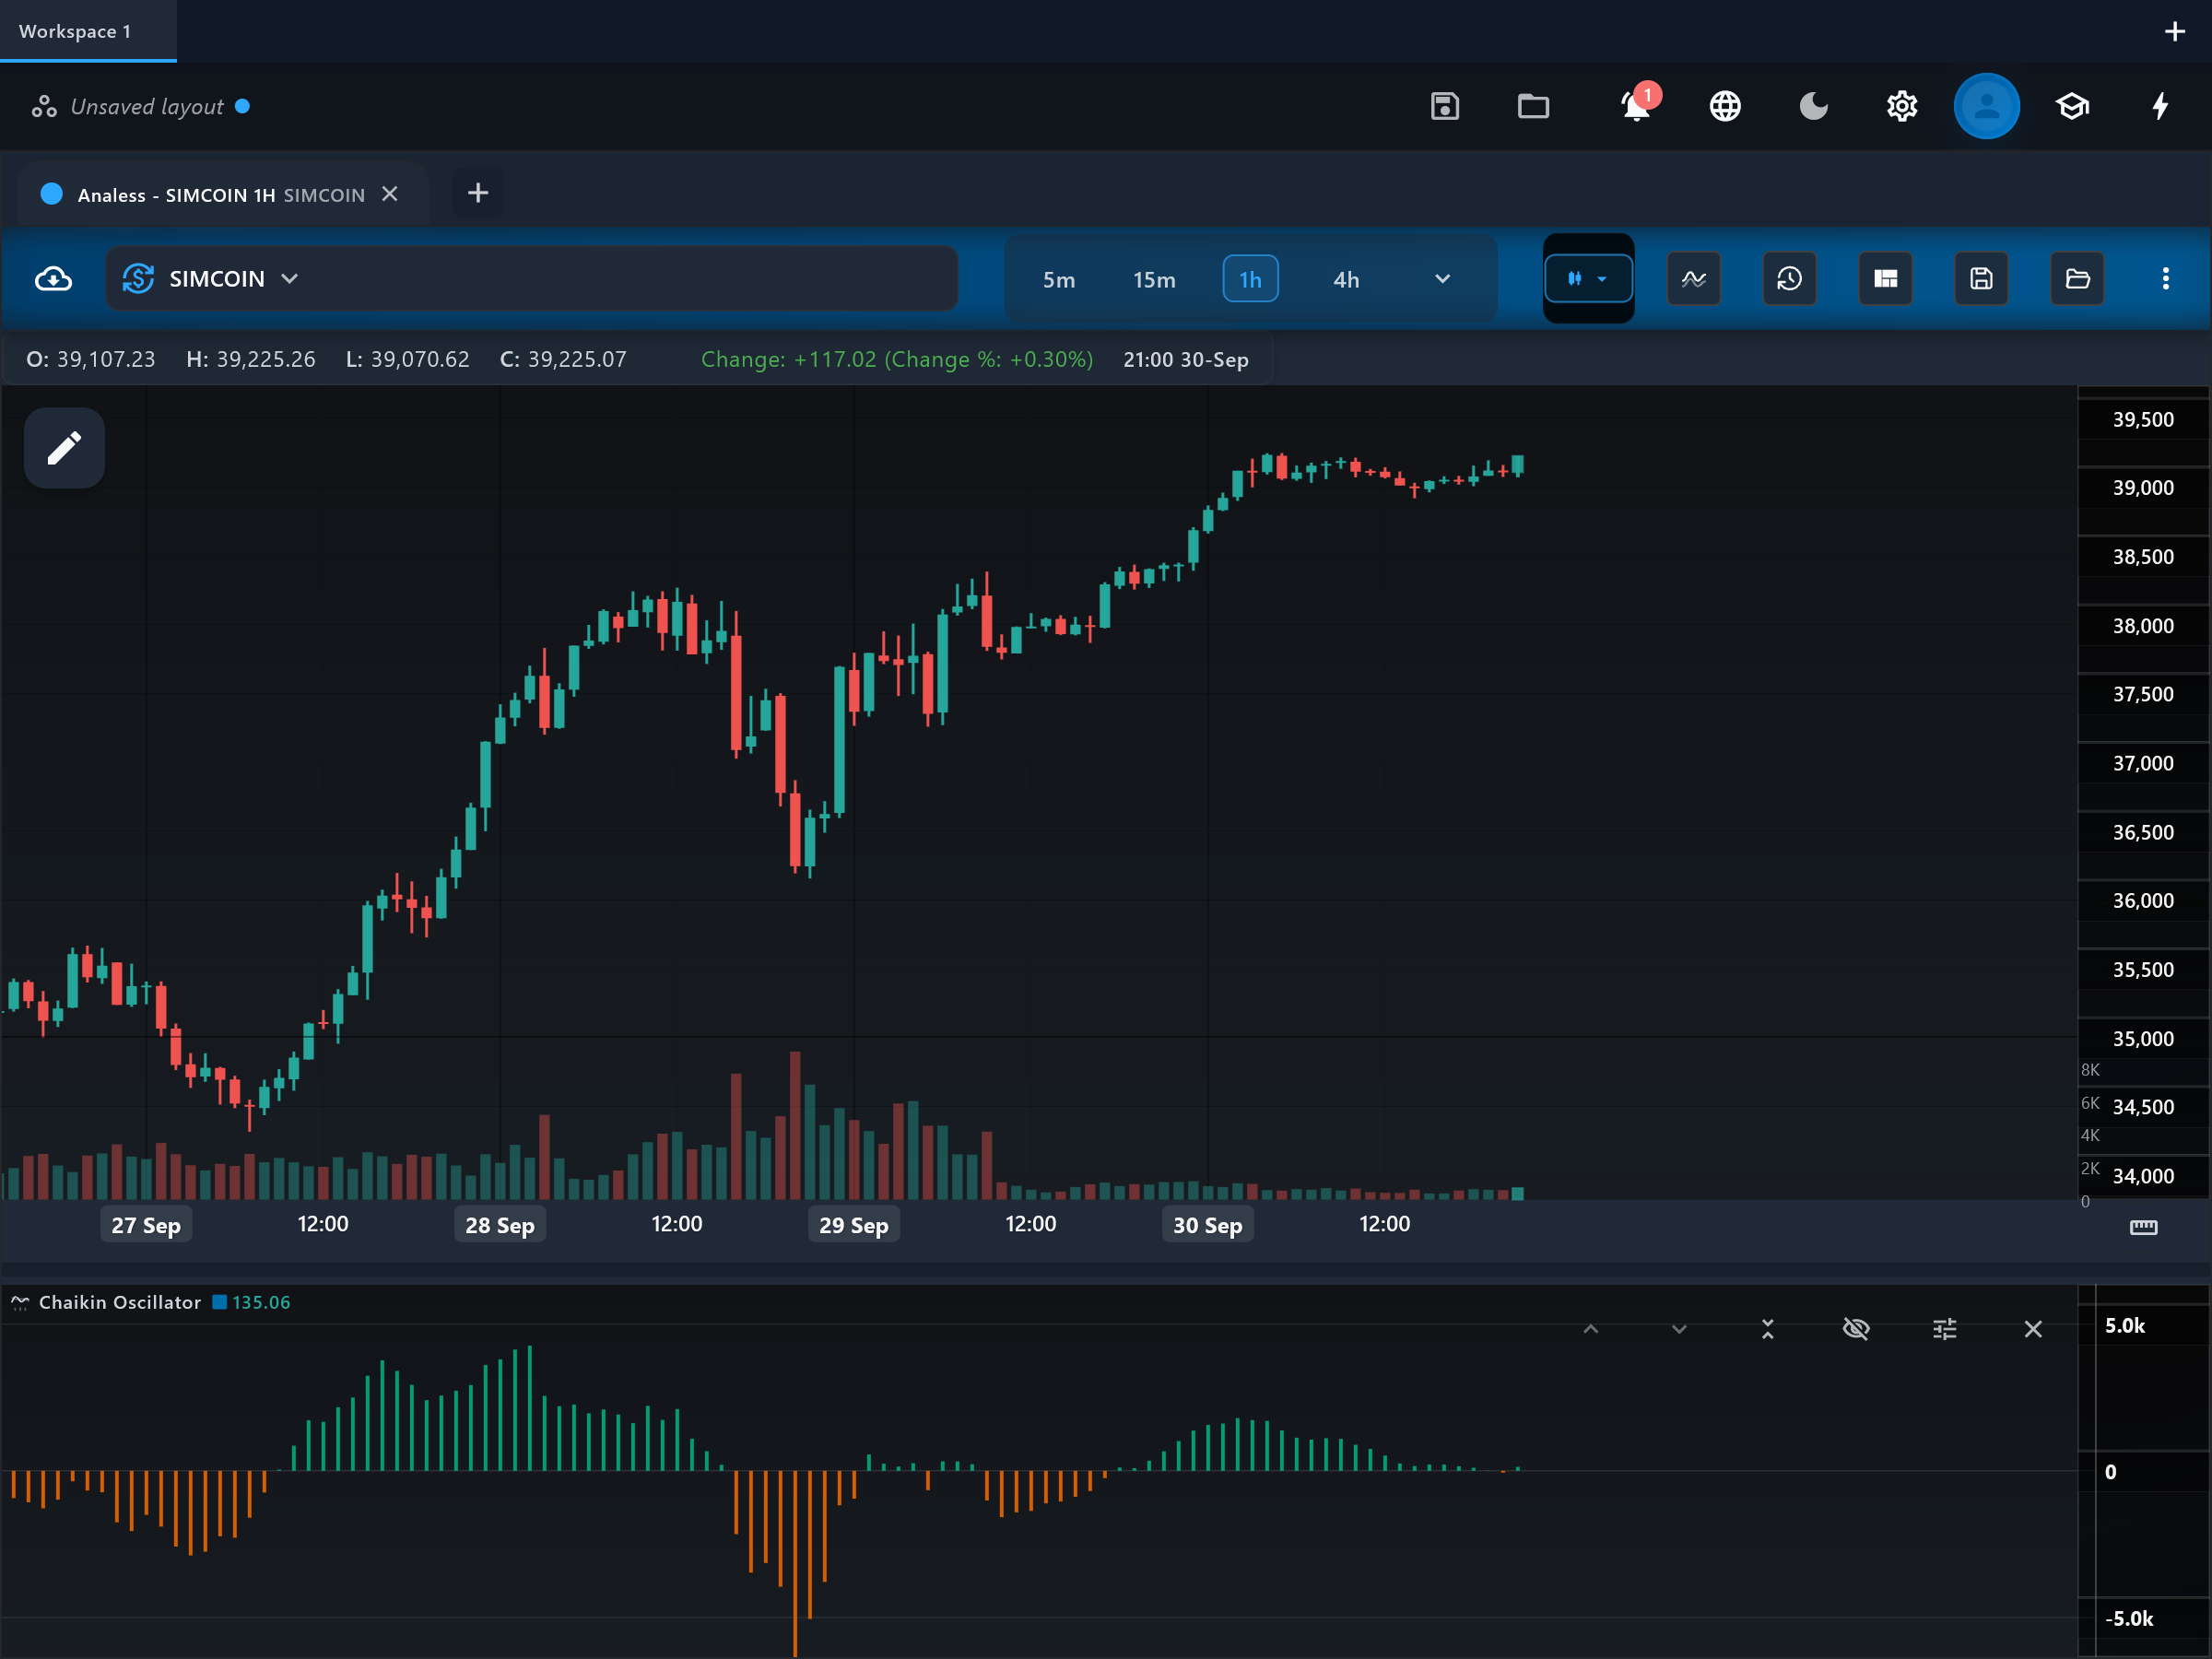
The Chaikin Oscillator measures the momentum of the Accumulation/Distribution line. Just as MACD applies two moving averages to price, this applies a fast and a slow EMA to the A/D line and plots their difference, showing whether money flow is accelerating or decelerating.
How it is calculated
This app first builds the cumulative A/D line (money-flow multiplier times volume, summed), then subtracts a slow EMA of that line from a fast EMA of it (defaults 3 and 10). The result is drawn as a histogram around zero.
How to read it
The "oscillator" histogram is positive when the A/D line is rising faster than its recent average — money-flow momentum to the upside — and negative when money flow is deteriorating. Zero crossings mark changes in money-flow momentum, not in price direction, so they often lead or disagree with price briefly. Growing histogram bars show accelerating pressure; shrinking bars toward zero show the current pressure fading. Divergences between the histogram's extremes and price extremes are the classic application.
What to look for
- Centre-line crossContext
The oscillator crossing zero marks a shift in the momentum of accumulation versus distribution.
- DivergenceUpside
Price making a lower low while the oscillator makes a higher low suggests selling momentum is fading despite the new price low.
- DivergenceDownside
Price making a higher high while the oscillator posts a lower high warns that buying momentum is not keeping pace.
When to use it
Best on liquid stocks and major crypto pairs, daily or intraday. Because it is a derivative of a derivative (an EMA difference of a cumulative line), it is noisy on thin symbols and on very short timeframes; forex tick volume weakens its meaning further.
Works well with
Settings explained
fastPeriod- Length of the fast EMA applied to the A/D line (default 3). Lowering it makes the oscillator twitchier; raising it smooths the fast side and reduces zero-cross noise.
slowPeriod- Length of the slow EMA applied to the A/D line (default 10). Raising it widens the gap between fast and slow, emphasizing larger money-flow swings; it should stay longer than the fast period.
Limitations and common mistakes
- It inherits the A/D line's gap blindness.
- Zero-line crosses are frequent in ranging markets and many are noise.
- It measures money-flow momentum, not price momentum — the two can disagree for extended stretches.
- Short default EMAs (3/10) make it fast but jumpy; treat single-bar flips skeptically.
References
- Origin: Marc Chaikin.
- Accumulation/distribution index — Wikipedia (opens in a new tab)
This page explains how an indicator is calculated and read. It describes past data, not what price will do next, and it is not a recommendation to trade. Read the disclaimers.
Try it in Analess
Add Chaikin Oscillator to any chart, adjust its settings, and open this explainer from the indicator itself.