















Indicators · Volume
Force Index
Combines price change and volume to measure the power behind a move.
Origin: Alexander Elder, 1993
- Best suited to
- Trending markets
- Responsiveness
- Coincident
- Family
- Volume
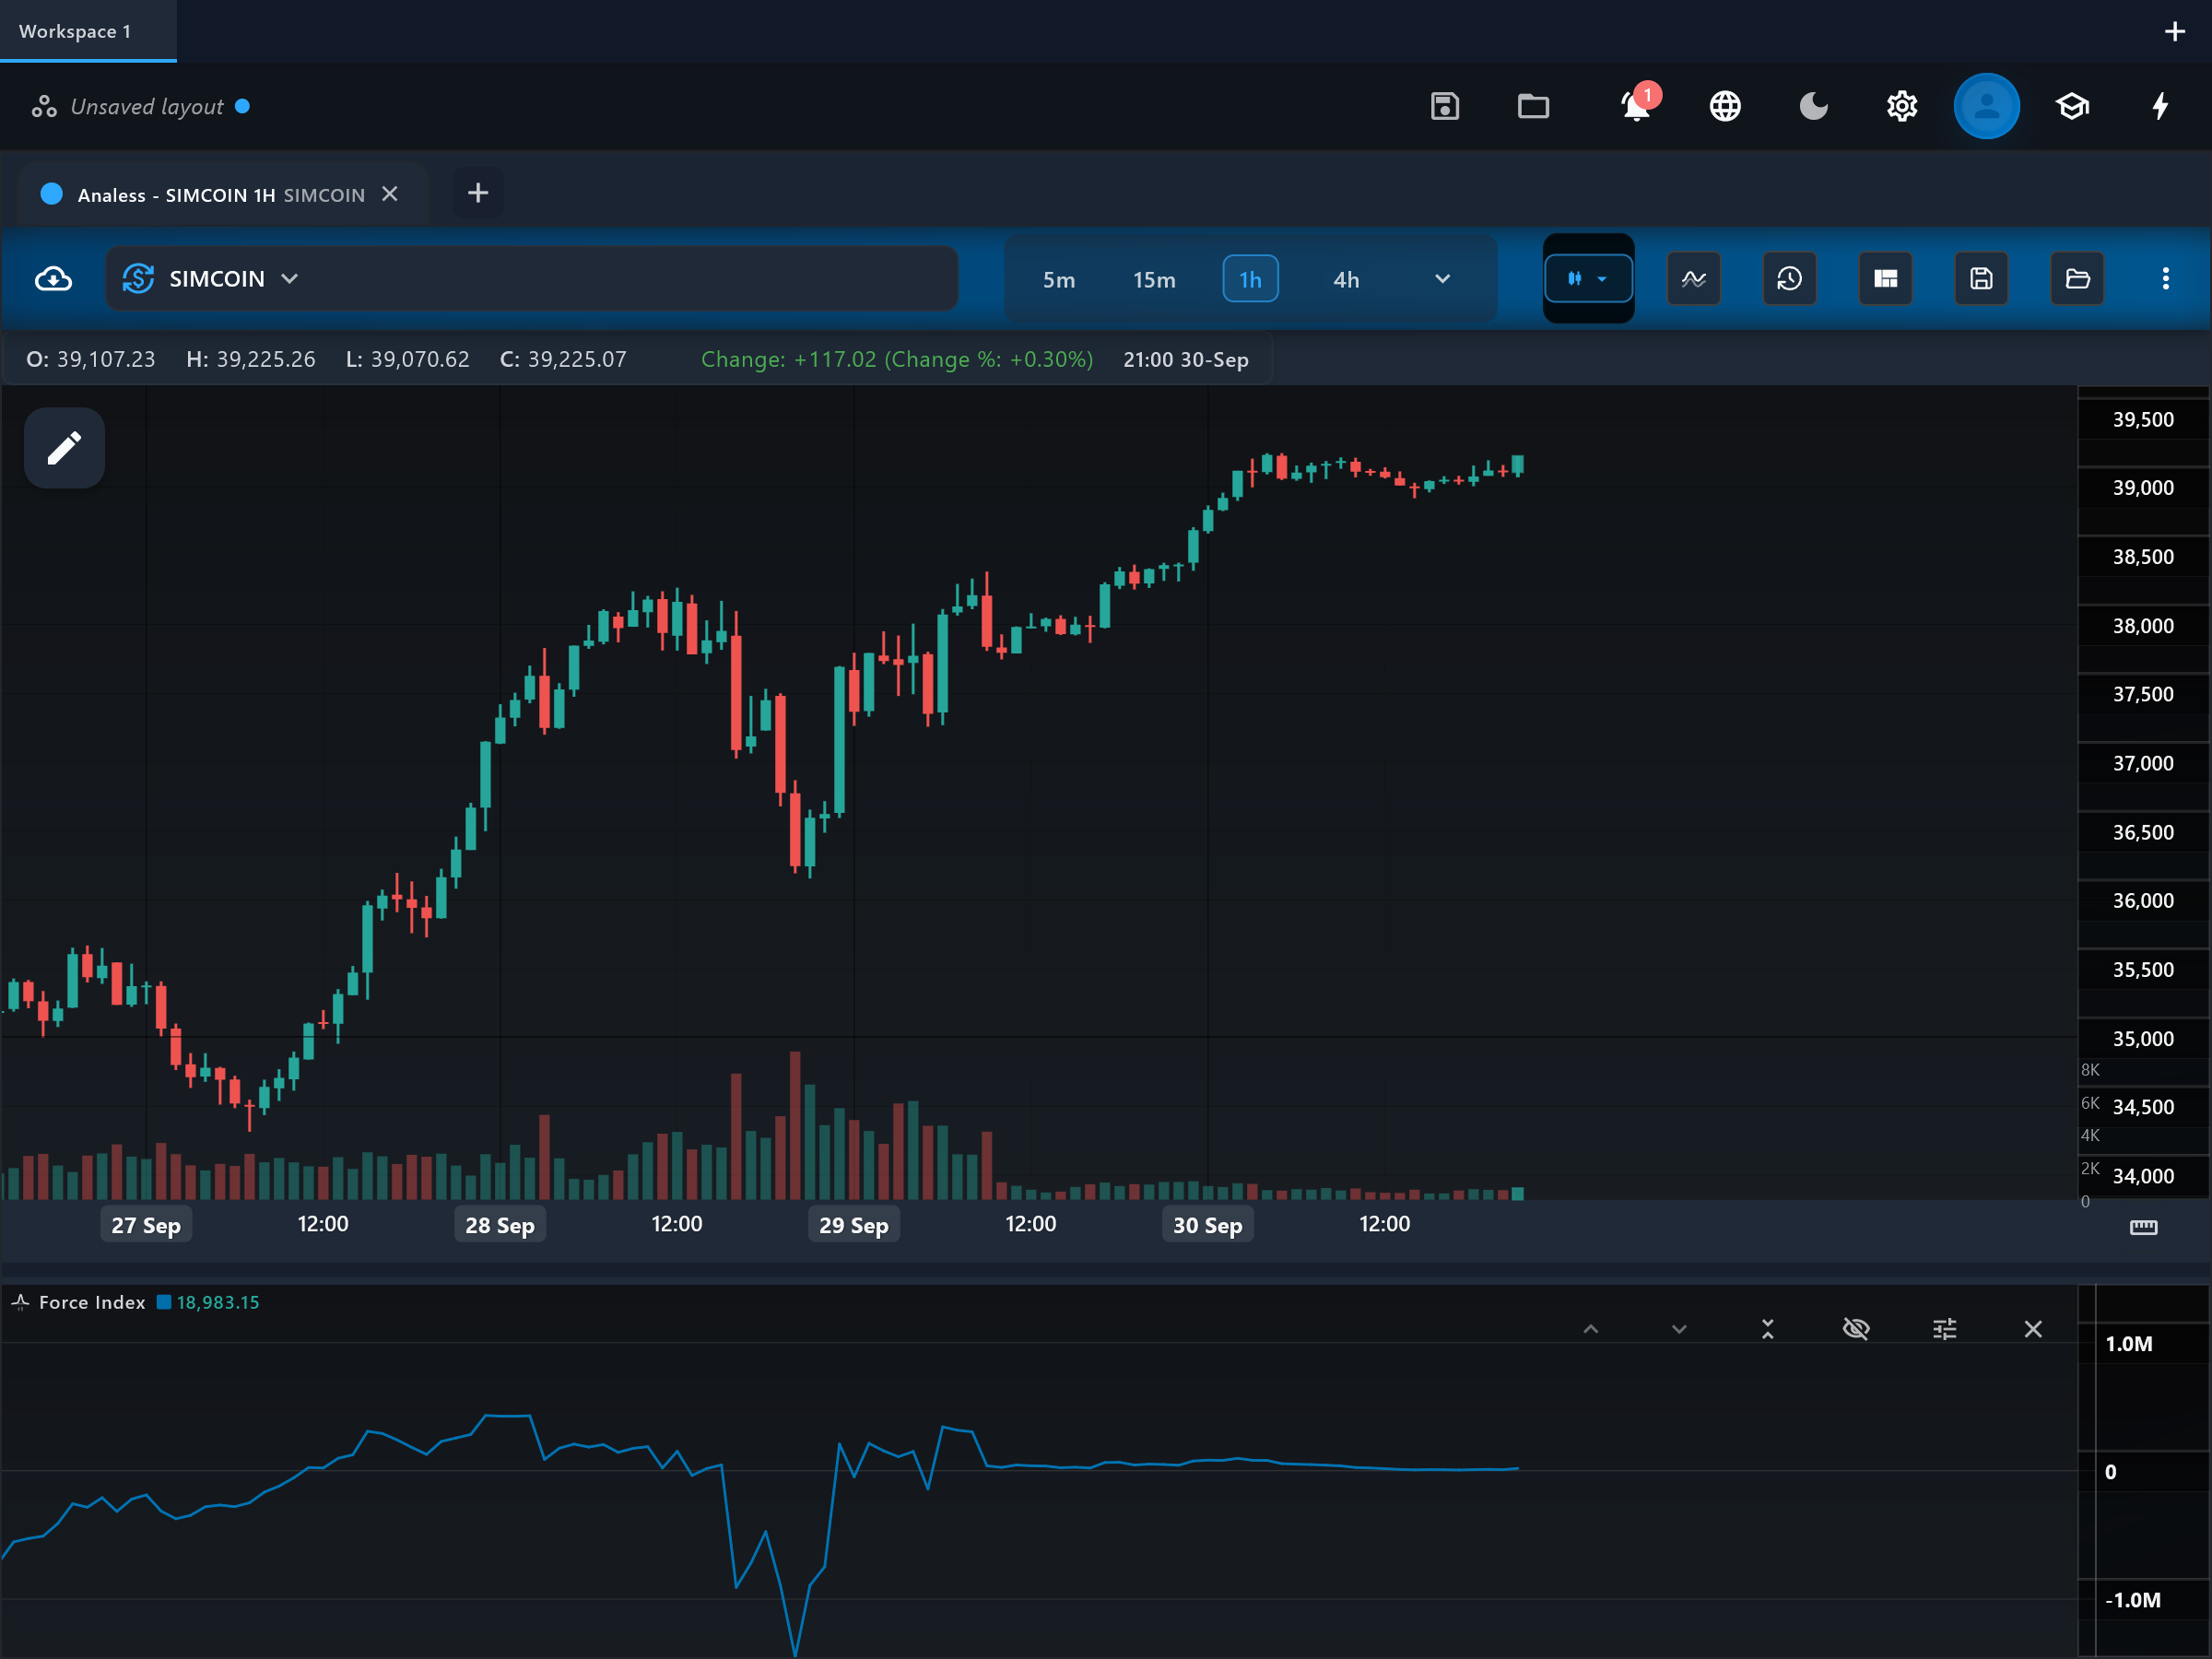
What it is
The Force Index measures the power behind each price move by combining three elements: direction (did price close up or down), extent (by how much), and volume (on how much participation). Alexander Elder introduced it in "Trading for a Living".
How it is calculated
For each bar this app multiplies the close-to-close change by the bar's volume, then smooths the result with an exponential moving average over the chosen period (default 13). Elder used a 2-period EMA for short-term timing and a 13-period EMA for gauging the trend of force.
How to read it
The "force_index" line oscillates around zero. Positive readings mean bulls controlled the smoothed window — up closes on volume outweighed down closes; negative readings mean bears did. The magnitude matters: a spike several times its usual amplitude marks an unusually forceful move, while a trend whose force readings shrink with each push is running on less conviction. Zero-line crosses of the 13-period version are conventionally read as shifts in medium-term control.
What to look for
- Centre-line crossContext
The force_index crossing zero marks control shifting between buyers and sellers over the smoothed window.
- DivergenceUpside
Price making a lower low while force_index makes a higher (less negative) low suggests the decline is losing power.
- DivergenceDownside
Price at a higher high with a weaker force_index peak suggests the advance carries less volume-backed strength than the prior push.
- ConfirmationContext
A breakout with a force_index spike far beyond its recent amplitude is conventionally read as a powerful, participated move.
When to use it
Works on liquid stocks, futures, and crypto on intraday to daily timeframes, particularly as a pullback filter inside an established trend. It is distorted on thin symbols, where one print dominates, and weakened on spot forex, where volume is tick-based.
Works well with
Settings explained
period- Length of the EMA applied to the raw (price change x volume) series (default 13). Elder's convention: 2 for a fast, twitchy timing tool; 13 for the intermediate trend of force. Longer periods emphasize sustained pressure over single bars.
Limitations and common mistakes
- The raw series is dominated by whichever bar had the largest (change x volume) product; short EMAs stay very jumpy.
- Its scale depends on the symbol's price and volume, so levels are not comparable across markets.
- Zero-line whipsaws are common in ranges.
- It needs genuine volume — tick-volume markets dilute its meaning.
References
- Origin: Alexander Elder, 1993.
- Force index — Wikipedia (opens in a new tab)
This page explains how an indicator is calculated and read. It describes past data, not what price will do next, and it is not a recommendation to trade. Read the disclaimers.
Try it in Analess
Add Force Index to any chart, adjust its settings, and open this explainer from the indicator itself.