















Indicators · Volume
Ease Of Movement
Relates price change to volume to show how easily price is moving.
Origin: Richard W. Arms Jr.
- Best suited to
- Trending markets
- Responsiveness
- Coincident
- Family
- Volume
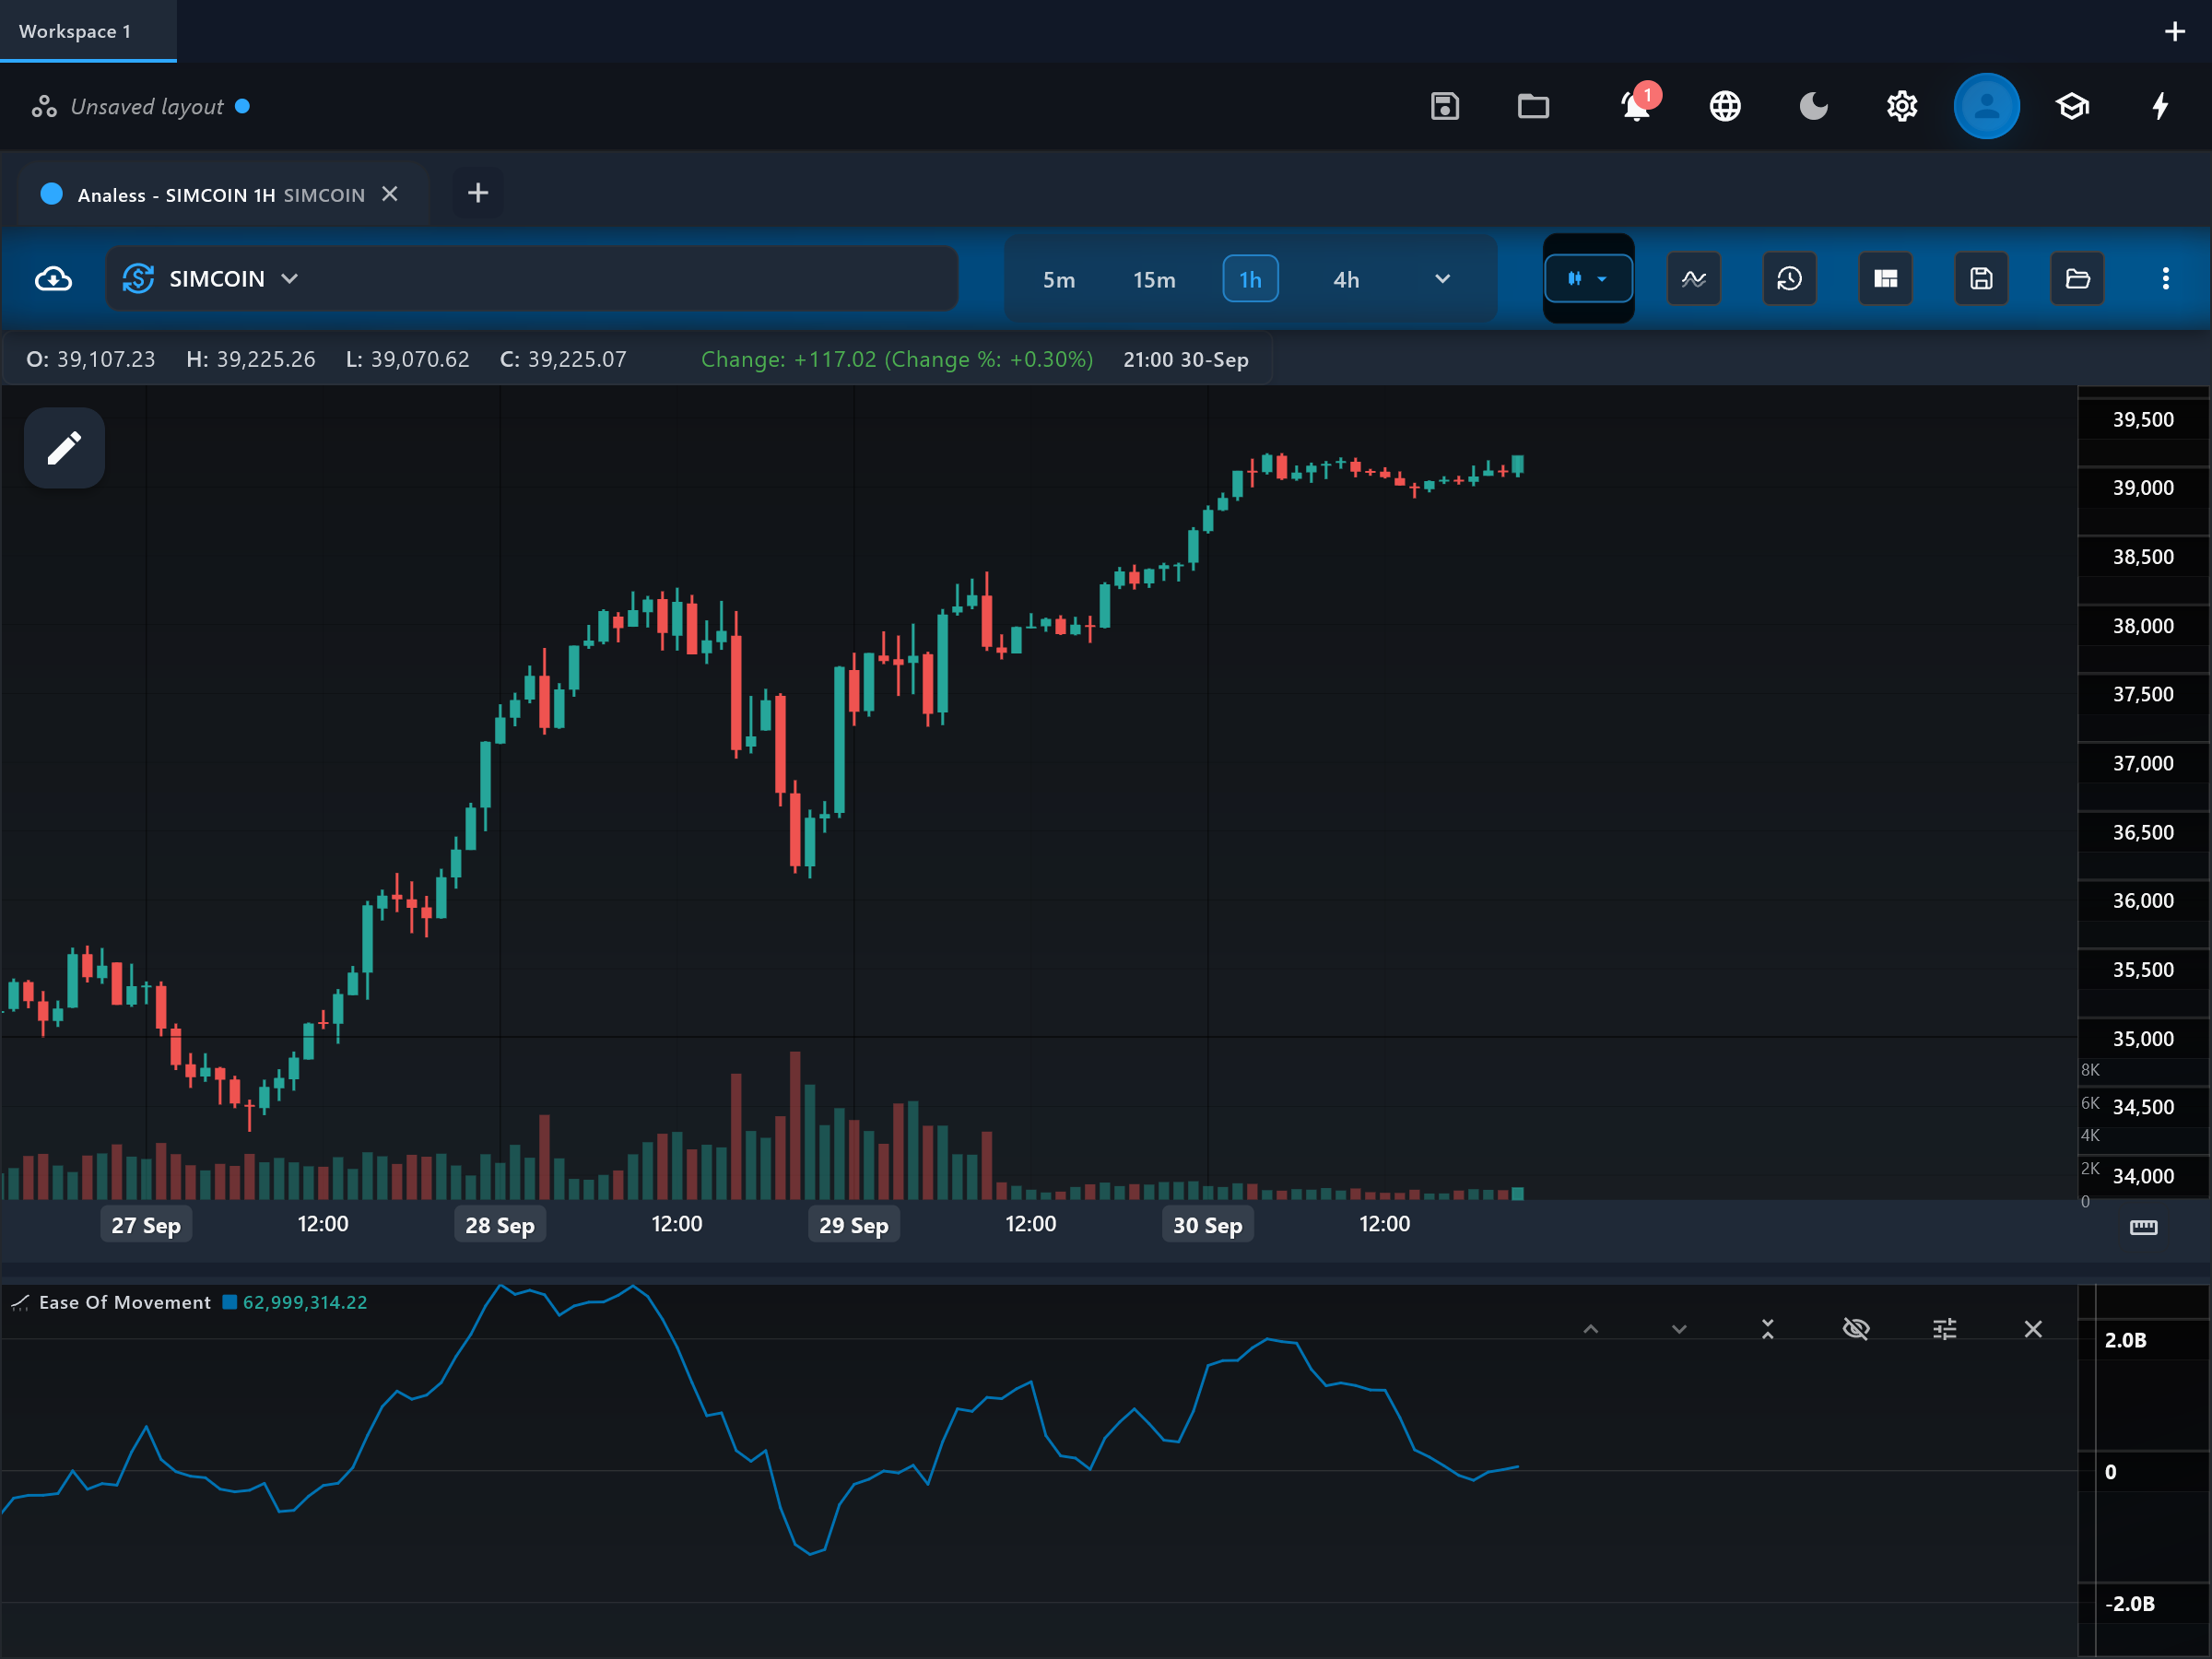
What it is
Ease of Movement (EOM) measures how easily price moves relative to the volume required to move it. Large price progress on light volume scores high (price is moving "easily"); small progress on heavy volume scores near zero (the move is being fought).
How it is calculated
Each bar's distance moved is the change in the bar midpoint ((high + low) / 2) from the previous bar. That is divided by a "box ratio" — volume scaled down by the volume-scale setting, divided by the bar's high-low range. This app then smooths the raw value with a simple moving average over the chosen period.
How to read it
The "eom" line oscillates around zero. Positive values mean price is advancing easily — upward progress without volume resistance; negative values mean price falls easily. Values hovering near zero mean either little price movement or movement that requires heavy volume, both signs of a contested market. The line is typically read for its side of zero and for how decisively it departs from zero, and it pairs naturally with a trend filter since it says nothing about support or resistance levels.
What to look for
- Centre-line crossContext
EOM crossing above zero indicates price has started advancing with relative ease; crossing below zero, falling with ease. Sustained excursions matter more than single-bar crosses.
- ConfirmationUpside
A breakout accompanied by strongly positive EOM suggests the advance is meeting little volume resistance.
- DivergenceContext
Price grinding to new highs while EOM fades toward zero suggests each new increment of progress is costing more volume — the move is getting harder.
When to use it
Designed for liquid stocks and indices on daily timeframes, and usable on major crypto pairs. It is unreliable on thin or illiquid symbols, where both the volume and range inputs are erratic, and on spot forex, where tick volume breaks the "effort" side of the calculation.
Works well with
Settings explained
period- Length of the simple moving average applied to the raw EOM value (default 14). The raw series is very noisy, so shorter periods whipsaw around zero; longer periods give a cleaner but slower line.
volumeScale- The divisor applied to volume in the box ratio (default 100,000,000). It only rescales the output so the numbers are readable for your symbol's typical volume — it does not change the line's shape, crosses, or timing. Lower it for low-volume symbols if the line looks flat.
Limitations and common mistakes
- The raw value is extremely noisy; everything depends on the smoothing period.
- The output scale is arbitrary (set by volumeScale), so absolute values cannot be compared across symbols.
- Bars with very small ranges or tiny volume produce unstable readings.
- It describes the ease of movement, not its destination — it has no concept of levels or targets.
References
- Origin: Richard W. Arms Jr..
- Ease of movement — Wikipedia (opens in a new tab)
This page explains how an indicator is calculated and read. It describes past data, not what price will do next, and it is not a recommendation to trade. Read the disclaimers.
Try it in Analess
Add Ease Of Movement to any chart, adjust its settings, and open this explainer from the indicator itself.