















Indicators · Momentum & oscillators
DPO
Detrended Price Oscillator — removes the trend to isolate shorter price cycles.
Origin: Attribution disputed—commonly credited to William Blau, 1991
- Best suited to
- Ranging markets
- Responsiveness
- Lagging
- Family
- Momentum & oscillators
What it is
The Detrended Price Oscillator (DPO) removes the longer-term trend from price so you can see the shorter cycles that ride on top of it. Rather than signalling momentum in real time, it is an analytical tool: it helps you estimate how long the instrument's typical swing cycle is and where price sits within it.
How it is calculated
A simple moving average of the chosen period (default 20) is computed, then shifted back in time by period / 2 + 1 bars (11 bars at the default). DPO is the close minus that displaced average. The displacement is the point of the indicator: by comparing each close to an average centred on the past, the trend component is subtracted out — but it also means the most recent bars have no DPO value and the line is not aligned with the current bar.
How to read it
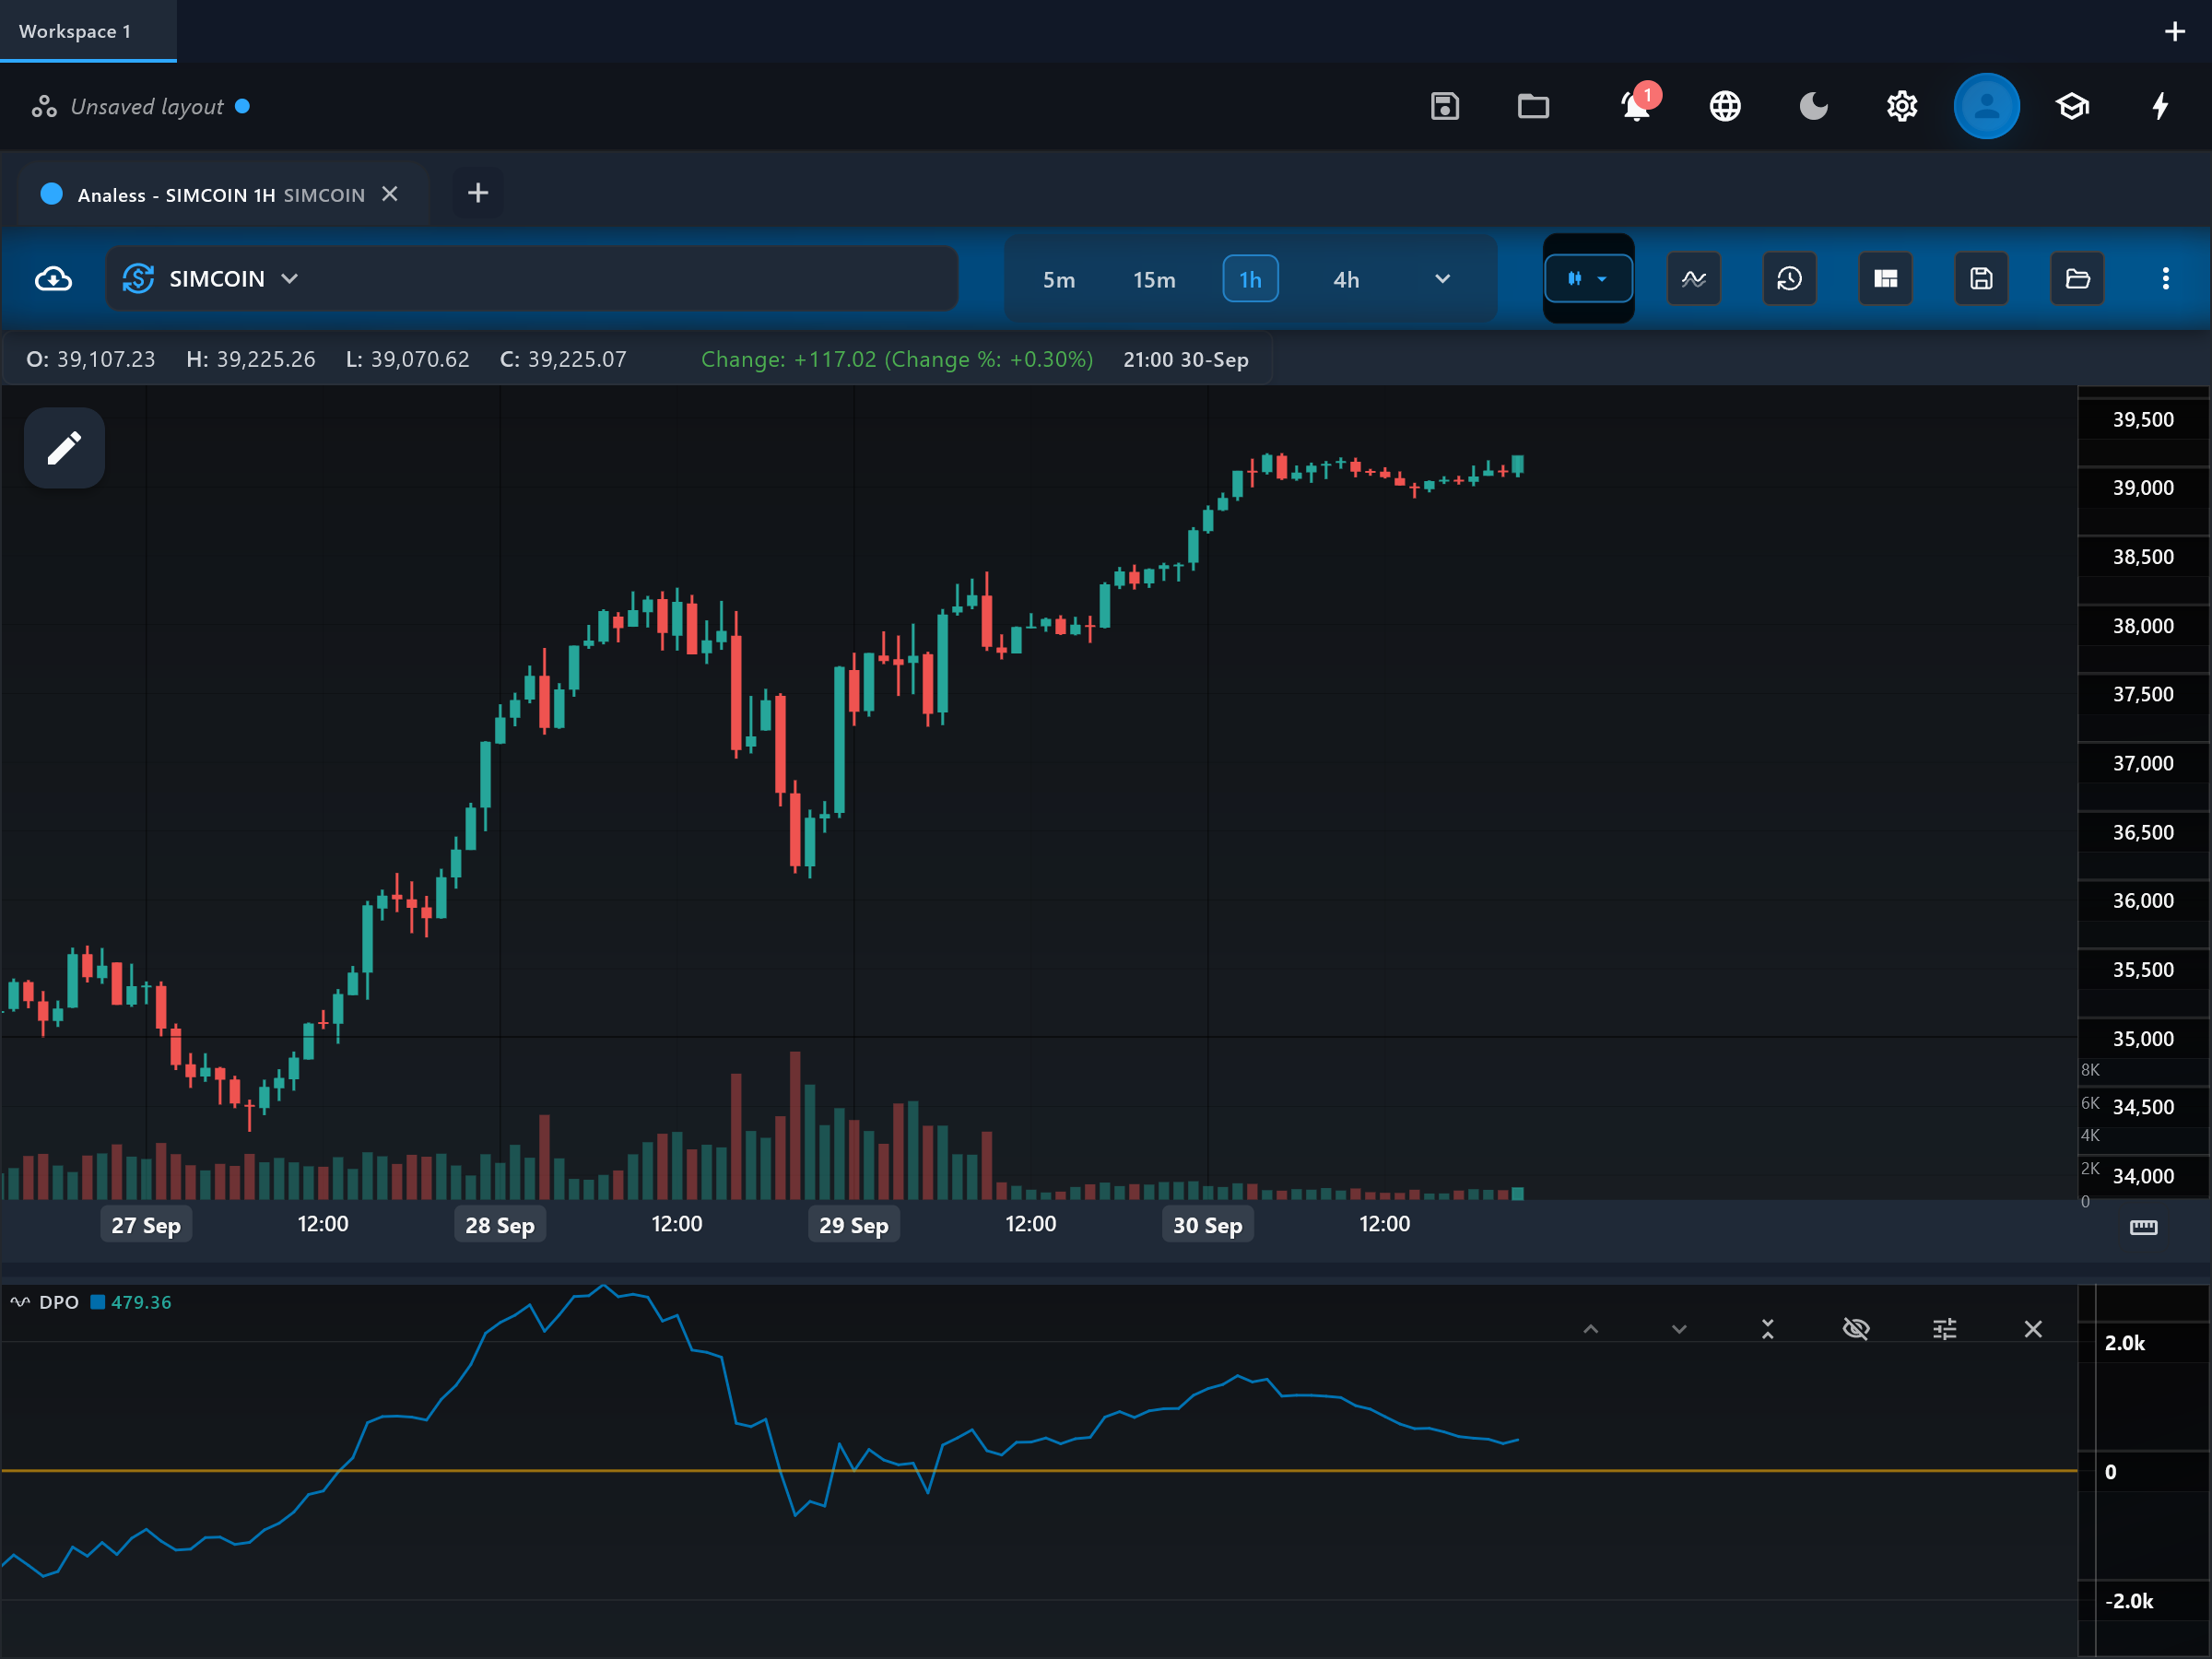
The "dpo" line oscillates around the flat "zero" level. Peaks above zero mark points where price sat above its displaced average — cycle highs — and troughs below zero mark cycle lows. The most useful reading is the spacing: measure the distance between successive DPO troughs (or peaks) to estimate the cycle length, then use that estimate to time other indicators or anticipate the next swing window. Remember the line is displaced — a DPO value is not a statement about the newest bars.
What to look for
- Centre-line crossContext
Zero crosses mark transitions between the above-average and below-average halves of the cycle — useful for mapping cycle phase, not as trade triggers.
- Turning patternUpside
A DPO trough forming at a depth similar to previous troughs, at roughly the expected cycle spacing, suggests a cycle low is in place.
- Turning patternDownside
A DPO peak at a familiar height and spacing suggests the current upswing is near its cyclical top.
- Overbought / oversoldContext
Readings far outside the instrument's usual DPO range flag an unusually stretched swing relative to the detrended norm.
When to use it
DPO is most useful on instruments and timeframes that actually cycle — range-bound stocks, FX pairs, and commodities on daily or weekly bars — where measuring peak-to-peak spacing has meaning. It is an excellent companion when tuning the lookback of other oscillators to the instrument's natural rhythm. Do not read it in real time: the displacement means it says nothing about the latest bars, and in strong trends the "cycles" it exposes are faint and unreliable.
Works well with
Settings explained
period- The SMA length that defines which trend is removed; the displacement is derived from it (period / 2 + 1). The default 20 strips out the roughly-monthly trend on daily bars, exposing shorter cycles. Use a longer period to remove slower trends and study bigger cycles; a shorter one to focus on faster wiggles.
Limitations and common mistakes
- The line is displaced backward — it does not describe the current bar, so it cannot be used as a real-time momentum signal.
- Cycle estimates are descriptive, not predictive: cycle lengths drift, and strong trends can override them entirely.
- Like any detrending method, the result depends heavily on the chosen period — a different period exposes a different "cycle".
References
- Origin: Attribution disputed—commonly credited to William Blau, 1991.
- Detrended price oscillator — Wikipedia (opens in a new tab)
This page explains how an indicator is calculated and read. It describes past data, not what price will do next, and it is not a recommendation to trade. Read the disclaimers.
Try it in Analess
Add DPO to any chart, adjust its settings, and open this explainer from the indicator itself.